
factbaseLa referencia abierta del mundo sobre
naciones, capacidades y cambios globales
197Naciones
National profiles: geography, people, economy and security.
288Capacidades
Defined and rated, domain by domain.
40Cambios globales
Where the world is moving, with the evidence for and against.
4,666Gráficos
Every metric, for every nation it covers.
Factbase está impulsado por el Global Institute for National Capability (GINC).
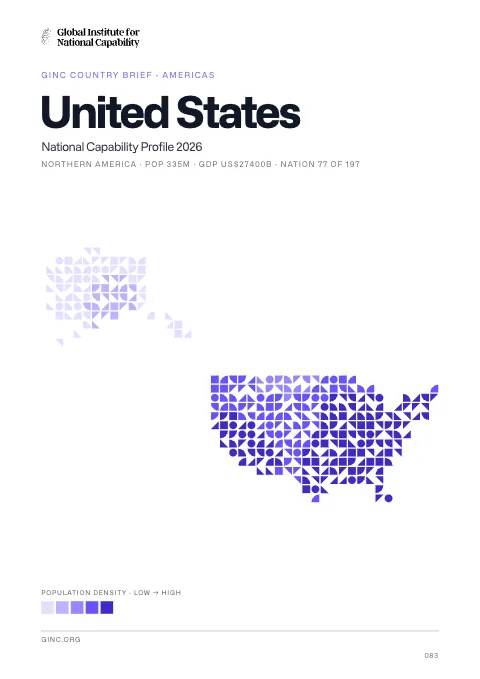
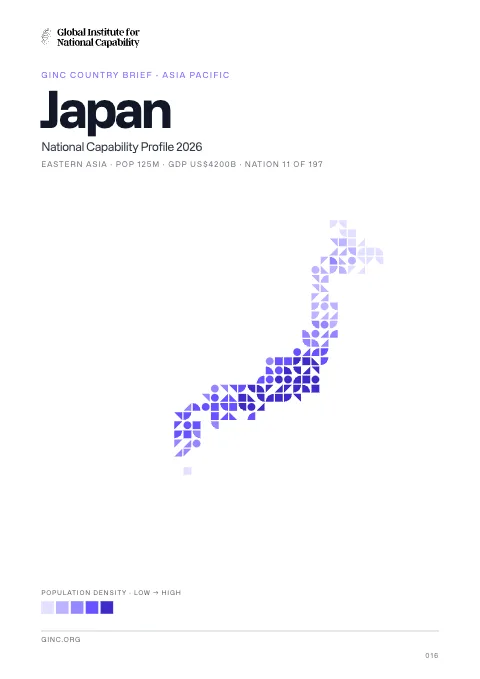
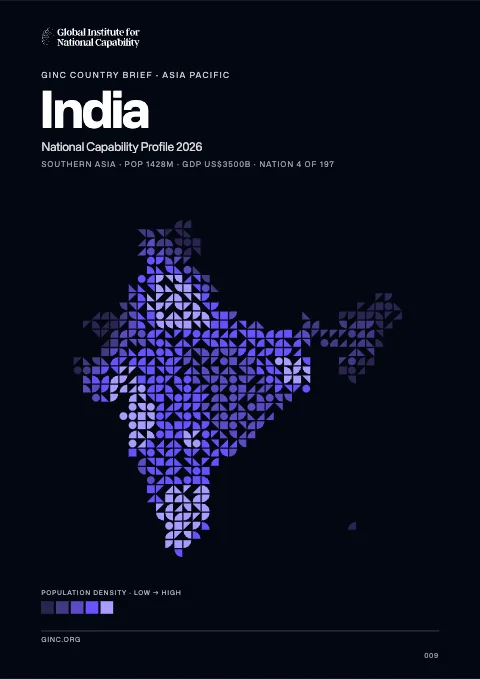
A brief on each of 197 nations
One page per nation, read from top to bottom or by chapter from the rail beside it: where the nation stands, what it can do, and how it is moving.
- Foundations: historical context, geography and environment
- Nine capability domains across hard, soft and economic power
- The GINC indices: capability ratings, trends, developments, trade and more
- A map, the headline figures and their charts, with a PDF edition where one is ready
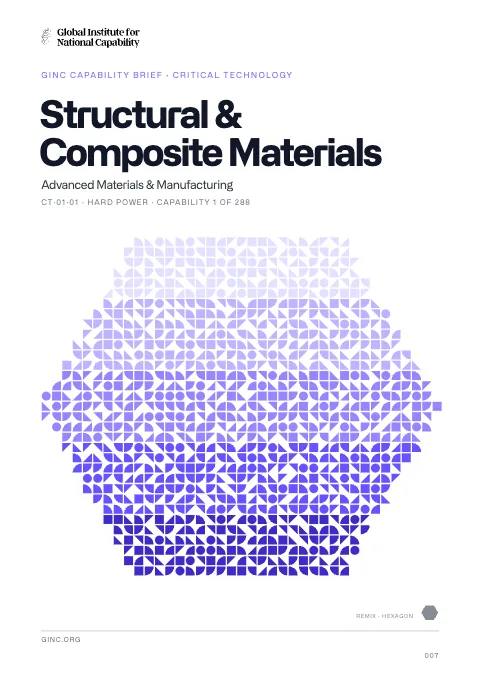
A brief on each of 288 national capabilities
Every capability in the National Capability Framework, in 73 groups and 9 domains, has a brief of its own in the same form as a nation's.
- What the capability is, and how it is measured
- Its history, and the capabilities nearest to it in the framework
- Which nations hold it, and how they are rated
- The developments and trends that bear on it
40 global shifts, with the case for and against
The movements that recur across the flagship publications of the major research institutions, each written as a shift from one condition to another and filed in one frame: five families, from who we are to what comes next, as foundations and systems.
- A headline figure and its source for every shift
- Four time series that support each shift, and two that contest it
- A direction for each: constructive, neutral or a deterioration
4,666 charts, each on a page of its own
Every one of the 50 metrics is charted for every nation it covers, and compared across all of them. Each chart has its own page, with the full series, its unit and its source.
- Embed any chart in your own page with one line of code
- Download it as a PNG or a JPG
- Share a link that opens the chart itself
GDP
Gross domestic product at current prices, in US dollars.
Source World Bank, World Development Indicators · IMF · factbase.org
Esto es lo que se dice sobre Factbase
Así marca la diferencia para profesionales, académicos, estudiantes y el público en general.
The thing I keep coming back for is the source under every figure. I can put a number in a ministerial brief and show exactly which authority published it.
One brief per nation, the same chapters in the same order for all 197. Like for like is the part nobody else gets right.
We structured a whole review on the capability framework: nine domains, 73 groups and 288 capabilities, each with a brief of its own. It replaced a spreadsheet we had been maintaining by hand for four years, and it is better than ours was.
Every Global Shift comes with four charts that support it and two that contest it. It is the first place I have found that shows the case against its own argument, which is exactly what an essay needs.
The trade chapter shows where a nation’s exports go and what they are made of in one diagram. I embed the charts straight into our notes, source line and all.
I set the 40 Global Shifts as a seminar exercise: pick one, then argue from its two contesting charts. Students fill the hour without me, which is exactly what I wanted.
Papers and patent families for each capability, with the ten nations that lead it. I knew who was ahead in batteries, and that the answer differs for research and for patents, before the kettle boiled.
A nation’s brief is laid out by capability group, and the groups line up with how we are organised internally. That sounds small. It saves a translation step on every piece of analysis we publish.
Clean, fast, and it cites everything. Every chart has a page of its own that I can link to or download as an image.
I came for one country and lost an hour. No paywall, no sign-up, and I could read it in my own language.
¿Tiene preguntas?
Tenemos respuestas
¿Qué es Factbase?
Un índice abierto de capacidad soberana. Califica a 196 naciones en nueve dominios de capacidad —que abarcan el poder duro, blando y económico— y descompone esos dominios en más de 250 capacidades medidas por separado, de modo que las fortalezas y las carencias de una nación puedan compararse en igualdad de condiciones.
¿Cómo se califica a las naciones?
Cada capacidad se puntúa en una escala común y se compara con la de todas las demás naciones; después se agrupa en un nivel por dominio, desde T1 (frontera) hacia abajo. Las columnas de Fronteras cuentan cuántos resultados T1, T2 y T3 tiene una nación, que es lo que determina la clasificación principal.
¿Cuáles son los nueve dominios de capacidad?
Tecnología Crítica, Infraestructura Estratégica y Seguridad Nacional en el poder duro; Capital Humano, Información e Influencia y Gobernanza e Integridad en el poder blando; y Fortaleza Financiera, Producción e Innovación e Inversión y Comercio en el poder económico.
¿De dónde proceden los datos?
Solo de fuentes primarias: oficinas nacionales de estadística, ministerios y los organismos internacionales que los originan (ONU, FMI, Banco Mundial, OIT, FAO, UIT, ACNUR, SIPRI, IISS y otros). Cada campo del perfil de una nación lleva su propia línea de fuente, de modo que cualquier cifra puede rastrearse hasta el organismo que la publicó.
¿Puedo llevar las calificaciones a mis propias herramientas?
Sí. Los datos subyacentes se publican en JSON junto al sitio, y el conector MCP de GINC permite consultar el índice desde su propio LLM en lenguaje natural, con preguntas sobre la capacidad soberana de naciones, dominios y capacidades concretas.
¿Con qué frecuencia se actualiza el índice?
Las calificaciones principales se publican cada año; la edición vigente es la de 2026. Los indicadores subyacentes se actualizan a medida que los organismos de origen publican nuevas cifras, y el perfil de cada nación muestra el año asociado a cada valor.