
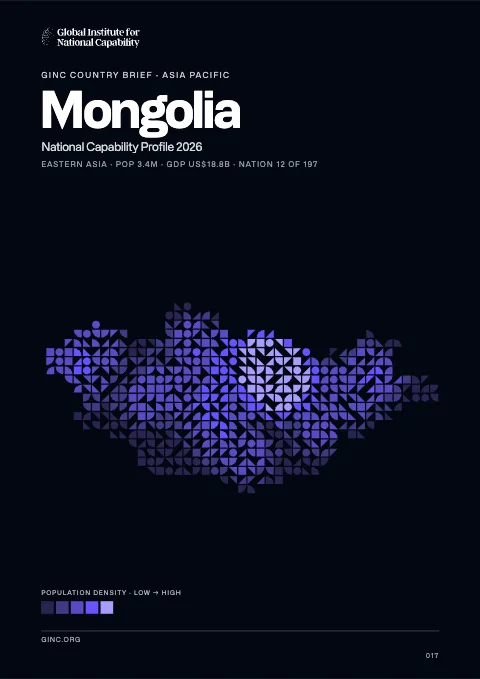
Mongolia
Mongolia is a landlocked parliamentary state in East and Southeast Asia, home to 3.0 million people, with its capital at Ulaanbaatar, and the world’s 19th-largest country by area.
Contents
12 chapters
Foundations
01–03
At a glance
- Area
- 1.6Mkm²#19 World#2 E & SE Asia
- Population
- 3M#138 World#16 E & SE Asia
- GDP (market)
- $11.1B
- GDP (PPP)
- $17B#139 World#19 E & SE Asia
- GDP per capita
- $5.9K#153 World#11 E & SE Asia
The whole brief
Mongolia National Capability Profile 2026
Foundations · Chapter 01
Historical Context
🇲🇳 Mongolia’s understanding the origins and evolution of the modern nation
BackgroundBack to top ↑
The Mongols gained fame in the 13th century when under Chinggis KHAAN they established a huge Eurasian empire through conquest. After his death the empire was divided into several powerful Mongol states, but these broke apart in the 14th century. The Mongols eventually retired to their original steppe homelands and in the late 17th century came under Chinese rule. Mongolia won its independence in 1921 with Soviet backing and a communist regime was installed in 1924. The modern country of Mongolia, however, represents only part of the Mongols' historical homeland; more ethnic Mongolians live in the Inner Mongolia Autonomous Region in the People's Republic of China than in Mongolia. Following a peaceful democratic revolution, the ex-communist Mongolian People's Revolutionary Party (MPRP) won elections in 1990 and 1992, but was defeated by the Democratic Union Coalition (DUC) in the 1996 parliamentary election. The MPRP won an overwhelming majority in the 2000 parliamentary election, but the party lost seats in the 2004 election and shared power with democratic coalition parties from 2004-08. The MPRP regained a solid majority in the 2008 parliamentary elections but nevertheless formed a coalition government with the Democratic Party that lasted until January 2012. In 2009, current President ELBEGDORJ of the Democratic Party was elected to office and was re-elected for his second term in June 2013. In 2010, the MPRP voted to retake the name of the Mongolian People's Party (MPP), a name it used in the early 1920s. Shortly thereafter, a new party was formed by former president ENKHBAYAR, which adopted the MPRP name. In the 2012 Parliamentary elections, a coalition of four political parties led by the Democratic Party, gained control of the Parliament.
IndependenceBack to top ↑
11 July 1921 (from China)
National holidayBack to top ↑
Independence Day/Revolution Day, 11 July (1921)
Foundations · Chapter 02
Geography
🇲🇳 Mongolia’s territory, resources and strategic position
Location and areaBack to top ↑
Northern Asia, between China and Russia
46 00 N, 105 00 E
Asia
slightly smaller than Alaska
0 km (landlocked)
none (landlocked)
Terrain and resourcesBack to top ↑
vast semidesert and desert plains, grassy steppe, mountains in west and southwest; Gobi Desert in south-central
oil, coal, copper, molybdenum, tungsten, phosphates, tin, nickel, zinc, fluorspar, gold, silver, iron
843 sq km (2003)
Settlement and hazardsBack to top ↑
dust storms; grassland and forest fires; drought; "zud," which is harsh winter conditions
landlocked; strategic location between China and Russia
OtherBack to top ↑
34.8 cu km (2011)
limited natural freshwater resources in some areas; the policies of former Communist regimes promoted rapid urbanization and industrial growth that had negative effects on the environment; the burning of soft coal in power plants and the lack of enforcement of environmental laws severely polluted the air in Ulaanbaatar; deforestation, overgrazing, and the converting of virgin land to agricultural production increased soil erosion from wind and rain; desertification and mining activities had a deleterious effect on the environment
Foundations · Chapter 03
Environment
🇲🇳 Mongolia’s environmental conditions, resources and national resilience
ClimateBack to top ↑
desert; continental (large daily and seasonal temperature ranges)
Emissions and pollutionBack to top ↑
Water, waste and foodBack to top ↑
Resources and agreementsBack to top ↑
GINC Capability Domains · Chapter 04
Critical Technology
🇲🇳 Mongolia’s technology frontiers and the pursuit of national advantage
Two counts are set side by side for 2015–2024: on the left, the papers researchers in Mongolia published; on the right, the patent families that began there and were filed in more than one country. First by capability group, then group by group with each group’s capabilities. The badge on a card is the nation’s place among all nations. Papers are from GINC Research Analytics, patent families from GINC Patents.
Research by capability group
#99 WorldPapers published, 2015–2024
Patents by capability group
#110 WorldInternational patent families, 2015–2024
Advanced Materials & ManufacturingBack to top ↑
Research
#96 WorldPapers published, 2015–2024
Patents
International patent families, 2015–2024
No international patent families on record for 2015–2024.
Energy TechnologiesBack to top ↑
Research
#85 WorldPapers published, 2015–2024
Patents
#98 WorldInternational patent families, 2015–2024
Semiconductors & Advanced ComputingBack to top ↑
Research
#113 WorldPapers published, 2015–2024
No research topic: Semiconductor Design & EDA · Advanced Semiconductor Fabrication · Semiconductor Equipment & Materials · Advanced Packaging & Heterogeneous Integration
Patents
International patent families, 2015–2024
No international patent families on record for 2015–2024.
Artificial IntelligenceBack to top ↑
Research
#103 WorldPapers published, 2015–2024
Patents
International patent families, 2015–2024
No international patent families on record for 2015–2024.
Quantum TechnologiesBack to top ↑
Research
#104 WorldPapers published, 2015–2024
Patents
International patent families, 2015–2024
No international patent families on record for 2015–2024.
Connectivity, Cyber & Trust TechnologiesBack to top ↑
Research
#114 WorldPapers published, 2015–2024
Patents
#93 WorldInternational patent families, 2015–2024
Sensing, Timing & NavigationBack to top ↑
Research
#95 WorldPapers published, 2015–2024
Patents
International patent families, 2015–2024
No international patent families on record for 2015–2024.
Robotics & Autonomous SystemsBack to top ↑
Research
#99 WorldPapers published, 2015–2024
No research topic: Human-Machine Interfaces
Patents
International patent families, 2015–2024
No international patent families on record for 2015–2024.
Biotechnology & Health TechnologiesBack to top ↑
Research
#105 WorldPapers published, 2015–2024
Patents
#94 WorldInternational patent families, 2015–2024
Medicine and BioTech
Clinical research and life-science invention, drawn from the same series that drive the metric pages. Each card opens the full cross-country comparison.
Space TechnologiesBack to top ↑
- Space Launch & Reusable Systems
- Advanced Propulsion & Hypersonic Systems
- Satellite & Constellation Technologies
GINC Capability Domains · Chapter 05
Strategic Infrastructure
🇲🇳 Mongolia’s energy, connectivity and the material foundations of capability
Resource InfrastructureBack to top ↑
9,935 bbl/day (2012 est.)
5,680 bbl/day (2010 est.)
0 bbl/day (2010 est.)
NA bbl
0 bbl/day (2010 est.)
21,610 bbl/day (2011 est.)
0 bbl/day (2010 est.)
17,360 bbl/day (2010 est.)
0 cu m (2011 est.)
0 cu m (2010 est.)
0 cu m (2011 est.)
0 cu m (2011 est.)
0 cu m (1 January 2013 est.)
Agriculture & Food InfrastructureBack to top ↑
- Irrigation & Agricultural Water
- Livestock & Veterinary
- Fisheries & Aquaculture
- Storage, Cold Chain & Markets
Energy InfrastructureBack to top ↑
- Thermal Generation
- Nuclear Generation
- Nuclear Fuel Cycle & Radioactive Waste
- Hydropower
- Renewable Generation
- Transmission & Distribution
- System Control & Dispatch
- Storage & Fuel Supply
833,200 kW (2010 est.)
4.48 billion kWh (2010 est.)
3.951 billion kWh (2010 est.)
22 million kWh (2010 est.)
263 million kWh (2010 est.)
99.9% of total installed capacity (2010 est.)
0% of total installed capacity (2010 est.)
0% of total installed capacity (2010 est.)
0.1% of total installed capacity (2010 est.)
10.21 million Mt (2011 est.)
Water, Sanitation & Waste InfrastructureBack to top ↑
- Dams, Reservoirs & Flood Defence
- Water Supply & Treatment
- Bulk Water Transfer & Desalination
- Wastewater & Sanitation
- Solid Waste & Recycling
Advanced ManufacturingBack to top ↑
- Materials & Inputs
- Chemicals & Hazardous Process Industry
- Production Systems
- Supply Chain & Ecosystem
- Workforce & Innovation
Transport InfrastructureBack to top ↑
- Seaports & Terminals
- Air Infrastructure
- Air Navigation & Traffic Management
- Inland Waterways & Ferries
- Rail Infrastructure
- Roads & Bridges
- Logistics, Multimodal & Border Infrastructure
- Postal & Parcel
44 (2013)
1 (2013)
580 km (the only waterway in operation is Lake Hovsgol) (135 km); Selenge River (270 km) and Orhon River (175 km) are navigable but carry little traffic; lakes and rivers freeze in winter, they are open from May to September) (2010)
Communications & Digital InfrastructureBack to top ↑
- Subsea Cables & International Gateways
- Core & Backbone Networks
- Mobile & Wireless Networks
- Spectrum & Broadcasting
- Data Centres, Compute & Cloud
- Data Resources
- AI Tools & Applications
176,700 (2012)
3.375 million (2012)
330,000 (2008)
20,084 (2012)
.mn
Financial InfrastructureBack to top ↑
- Currency & Reserves
- Payments & Settlement Systems
- Markets, Exchanges & Depositories
- Banks, Insurers & Systemic Institutions
Social InfrastructureBack to top ↑
- Health Infrastructure
- Public Health & Laboratories
- Medical Supply & Stockpiles
- Education & Skills Infrastructure
- Research & Scientific Facilities
- Housing, Community & Social Services
- Government & Public Administration
- Cultural, Community & Recreational Infrastructure
- Justice & Corrections
- Emergency Services & Civil Protection
- Hydrometeorology & Early Warning
Space, Aerospace & Defence InfrastructureBack to top ↑
GINC Capability Domains · Chapter 06
National Security
🇲🇳 Mongolia’s force, intelligence and the defence of the nation
Disputes and terrorismBack to top ↑
none
Force Generation & MobilisationBack to top ↑
Mongolian Armed Forces (Mongol ulsyn zevsegt huchin): Mongolian Army (includes Mongolian Air and Air Defense, which is to become a separate service in 2015); there is no navy (2013)
18-25 years of age for compulsory and voluntary military service; conscript service obligation is 12 months in land or air defense forces or police; a small portion of Mongolian land forces (2.5 percent) is comprised of contract soldiers; women cannot be deployed overseas for military operations (2012)
1.12% of GDP (2012)//0.99% of GDP (2011)//1.12% of GDP (2010)
Forces under arms
Active-duty strength on the Correlates of War series, which reaches back to 1816 and so carries a nation’s whole record of mobilisation rather than its present establishment. The card opens the full cross-country comparison.
Intelligence & AssessmentBack to top ↑
- Imagery & Geospatial Intelligence
- Signals & Cyber Intelligence
- Technical & Measurement Intelligence
- Open-Source & Financial Intelligence
- Human Intelligence & Counterintelligence
- All-Source Analysis & Warning
Joint Command, Projection & SustainmentBack to top ↑
- Command, Control & Communications
- Strategic Lift & Mobility
- Expeditionary & Peace Operations
- Operational Sustainment & War Reserves
- Defence Industrial Mobilisation
- CBRN Defence
Land PowerBack to top ↑
- Combined Arms Manoeuvre
- Land Fires
- Battlefield Aviation & Uncrewed Systems
- Special Operations & Irregular Warfare
Maritime PowerBack to top ↑
- Maritime Security & Constabulary
- Sea Denial & Undersea Warfare
- Sea Control
- Amphibious & Expeditionary Operations
Air PowerBack to top ↑
- Air Sovereignty & Policing
- Control of the Air
- Air Strike & Interdiction
- Airborne ISR, Early Warning & Battle Management
Strategic Strike & Missile DefenceBack to top ↑
Space OperationsBack to top ↑
Cyber & Electromagnetic OperationsBack to top ↑
Nuclear DeterrenceBack to top ↑
GINC Capability Domains · Chapter 07
Human Capital
🇲🇳 Mongolia’s population, health and the skills that sustain capability
DemographyBack to top ↑
2,953,190 (July 2014 est.)
1.37% (2014 est.)
20.88 births/1,000 population (2014 est.)
6.38 deaths/1,000 population (2014 est.)
2.22 children born/woman (2014 est.)
21.9
55% (2010)
Migration and urbanisationBack to top ↑
-0.85 migrant(s)/1,000 population (2014 est.)
ULAANBAATAR (capital) 1.184 million (2011)
Welfare and equityBack to top ↑
29.8% (2011 est.)
36.5 (2008)//32.8 (2002)
Early Childhood DevelopmentBack to top ↑
5.3% (2005)
Foundational EducationBack to top ↑
5.5% of GDP (2011)
Advanced EducationBack to top ↑
Technical & Vocational SkillsBack to top ↑
Digital & AI CompetenceBack to top ↑
Generative AI adoption
Modelled share of working-age adults using generative AI, from Microsoft telemetry scaled to each country’s 15–64 population. A measure of how fast a workforce is absorbing the technology rather than of how much of it a nation builds. The card opens the full cross-country comparison.
Lifelong Learning & ReskillingBack to top ↑
Research Talent & Knowledge CreationBack to top ↑
Population HealthBack to top ↑
63 deaths/100,000 live births (2010)
14.4% (2008)
less than 0.1% (2009 est.)
fewer than 500 (2009 est.)
fewer than 100 (2009 est.)
Health System CapabilityBack to top ↑
5.3% of GDP (2011)
2.76 physicians/1,000 population (2008)
6.8 beds/1,000 population (2011)
GINC Capability Domains · Chapter 08
Governance and Integrity
🇲🇳 Mongolia’s institutions, law and the integrity of the state
State structureBack to top ↑
parliamentary
21 provinces (aymguud, singular - aymag) and 1 municipality* (singular - hot); Arhangay, Bayanhongor, Bayan-Olgiy, Bulgan, Darhan-Uul, Dornod, Dornogovi, Dundgovi, Dzavhan (Zavkhan), Govi-Altay, Govisumber, Hentiy, Hovd, Hovsgol, Omnogovi, Orhon, Ovorhangay, Selenge, Suhbaatar, Tov, Ulaanbaatar*, Uvs
several previous; latest adopted 13 January 1992, effective 12 February 1992; amended 1999, 2001 (2011)
18 years of age; universal
Political Institutions & Civic ParticipationBack to top ↑
- Electoral Management & Integrity
- Legislature & Deliberative Institutions
- Citizen Participation & Civic Space
unicameral State Great Hural (76 seats; of which 48 members are directly elected from 26 electoral districts, while 28 members are proportionally elected based on a party's share of the total votes; all serve four-year terms)
Civil Will-Green Party or CWGP [Sanjaasuren OYUN]//Democratic Party or DP [Norov ALTANHUYAG]//Justice Coalition (includes MPRP and MNDP)//Mongolian National Democratic Party or MNDP [Mendsaikhan ENKHSAIKHAN]//Mongolian People's Party or MPP [Miyegombo ENKHBOLD]//Mongolian People's Revolutionary Party or MPRP [Nambar ENKHBAYAR]
Justice System & Fundamental RightsBack to top ↑
- Judicial Independence & Court Capability
- Access to Justice & Legal Services
- Fundamental Rights Protection
- Human Rights Institutions & Equality Bodies
civil law system influenced by Soviet and Romano-Germanic legal systems; constitution ambiguous on judicial review of legislative acts
has not submitted an ICJ jurisdiction declaration; accepts ICCt jurisdiction
Internal Security & OrderBack to top ↑
Regulatory Governance & Strategic ControlsBack to top ↑
- Regulatory Quality & Better Regulation
- Regulatory Delivery & Independent Regulators
- Strategic Controls & Economic Security Administration
Government Effectiveness & Public AdministrationBack to top ↑
- Centre of Government & Policy Coordination
- Civil Service & Public Workforce
- Digital Government & Service Delivery
- Legal Identity & Civil Registration
- Statistical & Data Capability
Public Integrity & Anti-CorruptionBack to top ↑
Transparency, Oversight & AccountabilityBack to top ↑
- Right to Information & Open Government
- Independent Oversight & Supreme Audit
- Independent Media & Journalist Safety
National Resilience & Crisis ManagementBack to top ↑
GINC Capability Domains · Chapter 09
Information and Influence
🇲🇳 Mongolia’s identity, media and the projection of influence
Identity and cultureBack to top ↑
Khalkha Mongol 90% (official), Turkic, Russian (1999)
Buddhist 53%, Muslim 3%, Christian 2.2%, Shamanist 2.9%, other 0.4%, none 38.6% (2010 est.)
Khalkh 81.9%, Kazak 3.8%, Dorvod 2.7%, Bayad 2.1%, Buryat-Bouriates 1.7%, Zakhchin 1.2%, Dariganga 1%, Uriankhai 1%, other 4.6% (2010 est.)
soyombo emblem
three equal, vertical bands of red (hoist side), blue, and red; centered on the hoist-side red band in yellow is the national emblem ("soyombo" - a columnar arrangement of abstract and geometric representation for fire, sun, moon, earth, water, and the yin-yang symbol); blue represents the sky, red symbolizes progress and prosperity
Diplomatic Statecraft & Global NetworksBack to top ↑
- Diplomatic Network & Consular Reach
- Multilateral Leadership & Norm Setting
- Agenda-Setting & Convening
- Mediation & Crisis Diplomacy
ADB, ARF, CD, CICA, CP, EBRD, EITI (compliant country), FAO, G-77, IAEA, IBRD, ICAO, ICC (NGOs), ICRM, IDA, IFAD, IFC, IFRCS, ILO, IMF, IMO, IMSO, Interpol, IOC, IOM, IPU, ISO, ITSO, ITU, ITUC, MIGA, MINURSO, MONUSCO, NAM, OPCW, OSCE, SCO (observer), UN, UNAMID, UNCTAD, UNESCO, UNIDO, UNISFA, UNMISS, UNWTO, UPU, WCO, WHO, WIPO, WMO, WTO
Alliances & Security CooperationBack to top ↑
Development Cooperation & Global AssistanceBack to top ↑
Culture, Language & Education DiplomacyBack to top ↑
- Cultural & Language Institutes
- Creative Industries & Cultural Export Reach
- Heritage & Cultural Institutions
- Education Diplomacy & Alumni Networks
- Sports & Major Events
Diaspora & Global CommunitiesBack to top ↑
Information Environment & Strategic CommunicationBack to top ↑
- Strategic Communications & Public Diplomacy
- International Media & Broadcasting
- Information Defence & Counter-Interference
following a law passed in 2005, Mongolia's state-run radio and TV provider converted to a public service provider; also available are private radio and TV broadcasters, as well as multi-channel satellite and cable TV providers; more than 100 radio stations, including some 20 via repeaters for the public broadcaster; transmissions of multiple international broadcasters are available (2008)
GINC Capability Domains · Chapter 10
Financial Strength
🇲🇳 Mongolia’s fiscal depth, reserves and the capacity to act
Monetary & Currency CapabilityBack to top ↑
- Monetary Policy & Price Stability
- Exchange Rate & External Account Management
- Currency Issuance & Digital Money
8.2% (2013 est.)//15% (2012 est.)
togrog/tugriks (MNT) per US dollar -//1,444.3 (2013 est.)//1,357.6 (2012 est.)//1,357.1 (2010 est.)//1,442.8 (2009)//1,170 (2007)
13.25% (31 December 2012)//12.25% (31 December 2011 est.)
17.5% (31 December 2013 est.)//18.2% (31 December 2012 est.)
$1.219 billion (31 December 2013 est.)//$1.318 billion (31 December 2012 est.)
$6.329 billion (31 December 2013 est.)//$5.472 billion (31 December 2012 est.)
Fiscal Capacity & Public FinanceBack to top ↑
- Revenue Mobilisation & Tax Administration
- Public Expenditure & Budget Management
- Sovereign Debt & Treasury Management
- Public Investment Management
31.1% of GDP (2013 est.)
-8.1% of GDP (2013 est.)
calendar year
Financial System Depth & AccessBack to top ↑
- Banking System Capacity
- Capital Markets Depth & Development
- Long-Term & Institutional Capital
- Financial Inclusion & Household Access
- Development & Policy Finance
$3.297 billion (31 December 2013 est.)//$3.09 billion (31 December 2012 est.)
$1.293 billion (31 December 2012 est.)//$1.579 billion (31 December 2011)//$1.093 billion (31 December 2010 est.)
Financial Regulation & IntegrityBack to top ↑
- Prudential Regulation & Supervision
- Financial Integrity & Illicit Finance Control
- Market Conduct & Consumer Protection
- Payment & Market Infrastructure Oversight
Financial Stability & Crisis ManagementBack to top ↑
- Macroprudential & Systemic Oversight
- Crisis Management, Resolution & Deposit Insurance
- External Liquidity & Financial Safety Nets
Sovereign Capital & External Financial PowerBack to top ↑
- Official Reserves Management
- Sovereign Wealth & Public Asset Management
- Currency Internationalisation & Reserve Status
- Capital Account & Flow Management
- International Financial Centre Capability
$4.954 billion (31 December 2013 est.)//$4.669 billion (31 December 2012 est.)
GINC Capability Domains · Chapter 11
Production and Innovation
🇲🇳 Mongolia’s output, industry and the engine of prosperity
Economic Output & ProductivityBack to top ↑
Mongolia's extensive mineral deposits and attendant growth in mining-sector activities have transformed Mongolia's economy, which traditionally has been dependent on herding and agriculture. Mongolia's copper, gold, coal, molybdenum, fluorspar, uranium, tin, and tungsten deposits, among others, have attracted foreign direct investment. Soviet assistance, at its height one-third of GDP, disappeared almost overnight in 1990 and 1991 at the time of the dismantlement of the USSR. The following decade saw Mongolia endure both deep recession, because of political inaction and natural disasters, as well as economic growth, because of reform-embracing, free-market economics and extensive privatization of the formerly state-run economy. The country opened a fledgling stock exchange in 1991. Mongolia joined the World Trade Organization in 1997 and seeks to expand its participation in regional economic and trade regimes. Growth averaged nearly 9% per year in 2004-08 largely because of high copper prices globally and new gold production. By late 2008, Mongolia was hit hard by the global financial crisis. Slower global economic growth hurt the country's exports, notably copper, and slashed government revenues. As a result, Mongolia's real economy contracted 1.3% in 2009. In early 2009, the International Monetary Fund reached a $236 million Stand-by Arrangement with Mongolia and the country has largely emerged from the crisis with better regulations and closer supervision. The banking sector strengthened but weaknesses remain. In October 2009, Mongolia passed long-awaited legislation on an investment agreement to develop the Oyu Tolgoi mine, considered to be among the world's largest untapped copper-gold deposits. Mongolia's ongoing dispute with a foreign investor over Oyu Tolgoi, however, has called into question the attractiveness of Mongolia as a destination for foreign direct investment. Negotiations to develop the massive Tavan Tolgoi coal field also have stalled. The economy has grown more than 10% per year since 2010, largely on the strength of commodity exports to nearby countries and high government spending domestically. Mongolia's economy, however, faces near-term economic risks from the government's loose fiscal and monetary policies, which are contributing to high inflation, and from uncertainties in foreign demand for Mongolian exports. Trade with China represents more than half of Mongolia's total external trade - China receives more than 90% of Mongolia's exports and is Mongolia's largest supplier. Mongolia has relied on Russia for energy supplies, leaving it vulnerable to price increases; in the first 11 months of 2013, Mongolia purchased 76% of its gasoline and diesel fuel and a substantial amount of electric power from Russia. A drop in foreign direct investment and a decrease in Chinese demand for Mongolia's mineral exports are putting pressure on Mongolia's balance of payments. Remittances from Mongolians working abroad, particularly in South Korea, are significant.
$17.03 billion (2013 est.)//$15.23 billion (2012 est.)//$13.57 billion (2011 est.)
11.8% (2013 est.)//12.3% (2012 est.)//17.5% (2011 est.)
$5,900 (2013 est.)//$5,400 (2012 est.)//$4,900 (2011 est.)
$11.14 billion (2013 est.)
Labour & EmploymentBack to top ↑
- Employment & Labour Force Participation
- Labour Market Institutions & Wage Setting
- Employment Services & Skills Matching
- Labour Adjustment, Transition & Formalisation
1.037 million (2011 est.)
9% (2011 est.)//13% (2010)
Industrial & Sectoral BaseBack to top ↑
- Manufacturing & Advanced Industry
- Foundational & Process Industries
- Agrifood & Primary Production
- Services Economy
wheat, barley, vegetables, forage crops; sheep, goats, cattle, camels, horses
construction and construction materials; mining (coal, copper, molybdenum, fluorspar, tin, tungsten, gold); oil; food and beverages; processing of animal products, cashmere and natural fiber manufacturing
11% (2013 est.)
Structural Transformation & ComplexityBack to top ↑
Business Dynamism & EntrepreneurshipBack to top ↑
- Entrepreneurship & Firm Creation
- Risk Capital & Scale-Up Finance
- Firm Growth, Exit & Renewal
- Competition & Market Contestability
Innovation & CommercialisationBack to top ↑
- Business Innovation Capability
- Research Commercialisation & Knowledge Transfer
- Intellectual Property & Intangible Assets
- Innovation Ecosystems & Clusters
Technology Adoption & DiffusionBack to top ↑
GINC Capability Domains · Chapter 12
Trade and Investment
🇲🇳 Mongolia’s markets, capital and the terms of global exchange
Overall tradeBack to top ↑
$14.8B of exports to 93 partners and $8.38B of imports from 82 in 2024, a surplus of $6.42B.
- Exports
- $14.8B93 partners
- Imports
- $8.38B82 partners
- Balance
- +$6.42Bsurplus
- Total trade
- $23.2B2024
ExportsBack to top ↑
Where its exports go
The largest partners in 2024, with each one's share of the nation's exports.
| Partner | Value | Share | |
|---|---|---|---|
| China | $13.6B | 92% | |
| Switzerland | $857M | 5.8% | |
| Italy | $64.5M | 0.4% | |
| South Korea | $35.4M | 0.2% | |
| United States | $24.3M | 0.2% | |
| Finland | $24.1M | 0.2% | |
| Japan | $21.6M | 0.1% | |
| Thailand | $20.5M | 0.1% | |
| France | $18.2M | 0.1% | |
| Hong Kong | $14.8M | 0.1% | |
| Germany | $8.72M | <0.1% | |
| Indonesia | $7.87M | <0.1% | |
| United Kingdom | $6.95M | <0.1% | |
| Austria | $6.89M | <0.1% | |
| Uzbekistan | $5.32M | <0.1% | |
| Nigeria | $5.28M | <0.1% | |
| Kazakhstan | $3.81M | <0.1% | |
| Poland | $3.52M | <0.1% | |
| Spain | $2.80M | <0.1% | |
| Norway | $2.73M | <0.1% |
What it exports
The largest categories in 2024.
| Category | Value | Share | |
|---|---|---|---|
| Mineral fuels, oils, distillation products | $8.72B | 59% | |
| Ores slag and ash | $4.27B | 29% | |
| Pearls, precious stones, metals, coins | $862M | 5.8% | |
| Wool, animal hair, horsehair yarn and fabric | $232M | 1.6% | |
| Salt, sulphur, earth, stone, plaster, lime and cement | $182M | 1.2% | |
| Copper | $138M | 0.9% | |
| Meat, fish and seafood preparations | $76.3M | 0.5% | |
| Meat and edible meat offal | $66.2M | 0.4% | |
| Edible fruits, nuts, peel of citrus fruit, melons | $44.2M | 0.3% | |
| Oil seed, oleaginous fruits, grain, seed, fruits | $42.7M | 0.3% | |
| Articles of apparel, knit or crocheted | $37.9M | 0.3% | |
| Aluminum | $20.4M | 0.1% | |
| Products of animal origin | $19.7M | 0.1% | |
| Machinery, nuclear reactors, boilers | $15.8M | 0.1% | |
| Plastics | $9.06M | <0.1% |
ImportsBack to top ↑
Where its imports come from
The largest partners in 2024, with each one's share of the nation's imports.
| Partner | Value | Share | |
|---|---|---|---|
| China | $4.52B | 54% | |
| Japan | $1.10B | 13% | |
| South Korea | $582M | 6.9% | |
| United States | $380M | 4.5% | |
| Germany | $235M | 2.8% | |
| Singapore | $231M | 2.8% | |
| Turkey | $137M | 1.6% | |
| Kazakhstan | $120M | 1.4% | |
| Switzerland | $113M | 1.3% | |
| Poland | $89.3M | 1.1% | |
| Italy | $80.6M | 1.0% | |
| France | $71.5M | 0.9% | |
| Netherlands | $68.4M | 0.8% | |
| Hong Kong | $59.3M | 0.7% | |
| Finland | $39.6M | 0.5% | |
| Australia | $39.0M | 0.5% | |
| Austria | $38.1M | 0.5% | |
| Czech Republic | $38.1M | 0.5% | |
| Hungary | $35.8M | 0.4% | |
| Sweden | $31.7M | 0.4% |
What it imports
The largest categories in 2024.
| Category | Value | Share | |
|---|---|---|---|
| Vehicles other than railway, tramway | $2.13B | 25% | |
| Machinery, nuclear reactors, boilers | $1.61B | 19% | |
| Electrical, electronic equipment | $763M | 9.1% | |
| Articles of iron or steel | $441M | 5.3% | |
| Mineral fuels, oils, distillation products | $261M | 3.1% | |
| Plastics | $214M | 2.6% | |
| Aircraft, spacecraft | $204M | 2.4% | |
| Iron and steel | $196M | 2.3% | |
| Rubbers | $186M | 2.2% | |
| Pharmaceutical products | $143M | 1.7% | |
| Pearls, precious stones, metals, coins | $137M | 1.6% | |
| Optical, photo, technical, medical apparatus | $135M | 1.6% | |
| Furniture, lighting signs, prefabricated buildings | $116M | 1.4% | |
| Beverages, spirits and vinegar | $106M | 1.3% | |
| Miscellaneous edible preparations | $103M | 1.2% |
In a list, the bar runs to the largest in that list. The line is each figure’s history from 2000, drawn to its own peak: it shows the shape of the years, and the value shows the size.
External balanceBack to top ↑
-$3.639 billion (2013 est.)//-$3.362 billion (2012 est.)
Trade Facilitation & LogisticsBack to top ↑
Trade Policy & Market AccessBack to top ↑
- Trade Policy & Negotiation Capability
- Market Access & Agreements Network
- Trade Law & Enforcement
- Standards, Conformity & Quality Infrastructure
Digital & Services TradeBack to top ↑
- Services Trade Capability
- Digital Trade & E-Commerce
- Data Flows & Digital Trade Governance
- Tourism & Visitor Economy
Investment Attraction & ProjectionBack to top ↑
- Investment Attraction & Facilitation
- Investment Absorption & Linkages
- Outward Investment & Global Corporate Presence
$1.69 billion (31 December 2013 est.)//$4.452 billion (31 December 2012 est.)
$NA (31 December 2013 est.)//$44 million (31 December 2012 est.)
Export Capability & SophisticationBack to top ↑
$4.294 billion (2013 est.)//$4.382 billion (2012 est.)
China 89%, Canada 4.1% (2012)
copper, apparel, livestock, animal products, cashmere, wool, hides, fluorspar, other nonferrous metals, coal, crude oil
Global Value Chain PositionBack to top ↑
- Value Chain Participation & Integration
- Value Chain Position & Upgrading
- Regional Integration & Hub Anchoring
Economic Leverage & DependenceBack to top ↑
- Strategic Supply Security
- Concentration Risk & Revenue Stabilisation
- Economic Leverage & Coercion Resistance
$5.696 billion (2013 est.)//$5.934 billion (2012 est.)
China 37.5%, Russia 25.6%, US 9.4%, South Korea 6.1%, Japan 4.9% (2012)
machinery and equipment, fuel, cars, food products, industrial consumer goods, chemicals, building materials, cigarettes and tobacco, appliances, soap and detergent
Mongolia · you are in
Historical Context
Foundations
GINC Capability Domains
Find in this brief · Mongolia