
Iceland
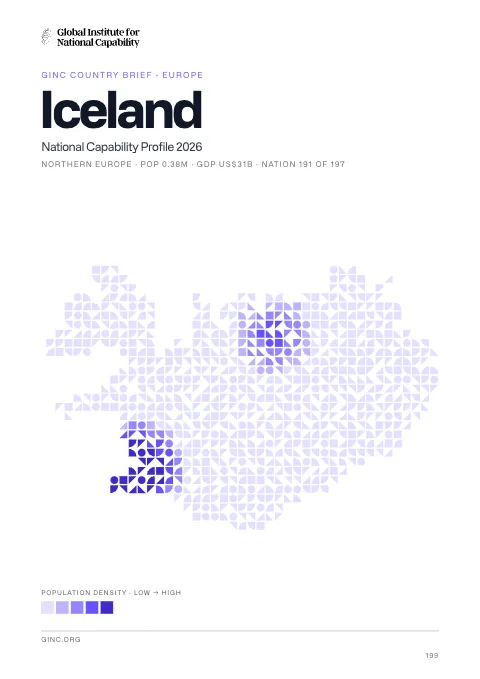
Iceland is a constitutional republic in Europe, home to 317,000 people, with its capital at Reykjavik.
Contents
12 chapters
Foundations
01–03
At a glance
- Area
- 103Kkm²#108 World#14 Europe
- Population
- 317.4K#179 World#39 Europe
- GDP (market)
- $14.6B
- GDP (PPP)
- $13.1B#149 World#37 Europe
- GDP per capita
- $40.7K#28 World#14 Europe
The whole brief
Iceland National Capability Profile 2026
Foundations · Chapter 01
Historical Context
🇮🇸 Iceland’s understanding the origins and evolution of the modern nation
BackgroundBack to top ↑
Settled by Norwegian and Celtic (Scottish and Irish) immigrants during the late 9th and 10th centuries A.D., Iceland boasts the world's oldest functioning legislative assembly, the Althing, established in 930. Independent for over 300 years, Iceland was subsequently ruled by Norway and Denmark. Fallout from the Askja volcano of 1875 devastated the Icelandic economy and caused widespread famine. Over the next quarter century, 20% of the island's population emigrated, mostly to Canada and the US. Denmark granted limited home rule in 1874 and complete independence in 1944. The second half of the 20th century saw substantial economic growth driven primarily by the fishing industry. The economy diversified greatly after the country joined the European Economic Area in 1994, but Iceland was especially hard hit by the global financial crisis in the years following 2008. Literacy, longevity, and social cohesion are first rate by world standards.
IndependenceBack to top ↑
1 December 1918 (became a sovereign state under the Danish Crown); 17 June 1944 (from Denmark; birthday of Jon SIGURDSSON leader of Iceland's 19th Century independence movement)
National holidayBack to top ↑
Independence Day, 17 June (1944)
Foundations · Chapter 02
Geography
🇮🇸 Iceland’s territory, resources and strategic position
Location and areaBack to top ↑
Northern Europe, island between the Greenland Sea and the North Atlantic Ocean, northwest of the United Kingdom
65 00 N, 18 00 W
Europe
slightly smaller than Kentucky
0 km
4,970 km
Terrain and resourcesBack to top ↑
mostly plateau interspersed with mountain peaks, icefields; coast deeply indented by bays and fiords
fish, hydropower, geothermal power, diatomite
NA
Settlement and hazardsBack to top ↑
earthquakes and volcanic activity
strategic location between Greenland and Europe; westernmost European country; Reykjavik is the northernmost national capital in the world; more land covered by glaciers than in all of continental Europe
OtherBack to top ↑
170 cu km (2011)
water pollution from fertilizer runoff; inadequate wastewater treatment
Foundations · Chapter 03
Environment
🇮🇸 Iceland’s environmental conditions, resources and national resilience
ClimateBack to top ↑
temperate; moderated by North Atlantic Current; mild, windy winters; damp, cool summers
Emissions and pollutionBack to top ↑
Water, waste and foodBack to top ↑
Resources and agreementsBack to top ↑
GINC Capability Domains · Chapter 04
Critical Technology
🇮🇸 Iceland’s technology frontiers and the pursuit of national advantage
Two counts are set side by side for 2015–2024: on the left, the papers researchers in Iceland published; on the right, the patent families that began there and were filed in more than one country. First by capability group, then group by group with each group’s capabilities. The badge on a card is the nation’s place among all nations. Papers are from GINC Research Analytics, patent families from GINC Patents.
Research by capability group
#98 WorldPapers published, 2015–2024
130
85
76
63
35
32
25
18
7
0
Patents by capability group
#62 WorldInternational patent families, 2015–2024
Advanced Materials & ManufacturingBack to top ↑
Research
#99 WorldPapers published, 2015–2024
Patents
#58 WorldInternational patent families, 2015–2024
Energy TechnologiesBack to top ↑
Research
#101 WorldPapers published, 2015–2024
Patents
#61 WorldInternational patent families, 2015–2024
Semiconductors & Advanced ComputingBack to top ↑
Research
#77 WorldPapers published, 2015–2024
No research topic: Semiconductor Design & EDA · Advanced Semiconductor Fabrication · Semiconductor Equipment & Materials · Advanced Packaging & Heterogeneous Integration
Patents
#61 WorldInternational patent families, 2015–2024
Artificial IntelligenceBack to top ↑
Research
#114 WorldPapers published, 2015–2024
Patents
#56 WorldInternational patent families, 2015–2024
Quantum TechnologiesBack to top ↑
Research
#95 WorldPapers published, 2015–2024
Patents
International patent families, 2015–2024
No international patent families on record for 2015–2024.
Connectivity, Cyber & Trust TechnologiesBack to top ↑
Research
#103 WorldPapers published, 2015–2024
Patents
#61 WorldInternational patent families, 2015–2024
Sensing, Timing & NavigationBack to top ↑
Research
#60 WorldPapers published, 2015–2024
Patents
#59 WorldInternational patent families, 2015–2024
Robotics & Autonomous SystemsBack to top ↑
Research
#134 WorldPapers published, 2015–2024
No research topic: Human-Machine Interfaces
Patents
#51 WorldInternational patent families, 2015–2024
Biotechnology & Health TechnologiesBack to top ↑
Research
#110 WorldPapers published, 2015–2024
Patents
#60 WorldInternational patent families, 2015–2024
Medicine and BioTech
Clinical research and life-science invention, drawn from the same series that drive the metric pages. Each card opens the full cross-country comparison.
Space TechnologiesBack to top ↑
- Space Launch & Reusable Systems
- Advanced Propulsion & Hypersonic Systems
- Satellite & Constellation Technologies
GINC Capability Domains · Chapter 05
Strategic Infrastructure
🇮🇸 Iceland’s energy, connectivity and the material foundations of capability
Resource InfrastructureBack to top ↑
0 bbl/day (2012 est.)
0 bbl/day (2010 est.)
0 bbl/day (2010 est.)
0 bbl (1 January 2013 est.)
0 bbl/day (2010 est.)
20,770 bbl/day (2011 est.)
1,420 bbl/day (2010 est.)
14,160 bbl/day (2010 est.)
0 cu m (2011 est.)
0 cu m (2010 est.)
0 cu m (2011 est.)
0 cu m (2011 est.)
0 cu m (1 January 2013 est.)
Agriculture & Food InfrastructureBack to top ↑
- Irrigation & Agricultural Water
- Livestock & Veterinary
- Fisheries & Aquaculture
- Storage, Cold Chain & Markets
Energy InfrastructureBack to top ↑
- Thermal Generation
- Nuclear Generation
- Nuclear Fuel Cycle & Radioactive Waste
- Hydropower
- Renewable Generation
- Transmission & Distribution
- System Control & Dispatch
- Storage & Fuel Supply
2.579 million kW (2010 est.)
17.08 billion kWh (2011 est.)
16.23 billion kWh (2010 est.)
0 kWh (2012 est.)
0 kWh (2012 est.)
4.7% of total installed capacity (2010 est.)
0% of total installed capacity (2010 est.)
73% of total installed capacity (2010 est.)
22.3% of total installed capacity (2010 est.)
3.809 million Mt (2011 est.)
Water, Sanitation & Waste InfrastructureBack to top ↑
- Dams, Reservoirs & Flood Defence
- Water Supply & Treatment
- Bulk Water Transfer & Desalination
- Wastewater & Sanitation
- Solid Waste & Recycling
Advanced ManufacturingBack to top ↑
- Materials & Inputs
- Chemicals & Hazardous Process Industry
- Production Systems
- Supply Chain & Ecosystem
- Workforce & Innovation
Transport InfrastructureBack to top ↑
- Seaports & Terminals
- Air Infrastructure
- Air Navigation & Traffic Management
- Inland Waterways & Ferries
- Rail Infrastructure
- Roads & Bridges
- Logistics, Multimodal & Border Infrastructure
- Postal & Parcel
96 (2013)
Communications & Digital InfrastructureBack to top ↑
- Subsea Cables & International Gateways
- Core & Backbone Networks
- Mobile & Wireless Networks
- Spectrum & Broadcasting
- Data Centres, Compute & Cloud
- Data Resources
- AI Tools & Applications
189,000 (2012)
346,000 (2012)
301,600 (2009)
369,969 (2012)
.is
Financial InfrastructureBack to top ↑
- Currency & Reserves
- Payments & Settlement Systems
- Markets, Exchanges & Depositories
- Banks, Insurers & Systemic Institutions
Social InfrastructureBack to top ↑
- Health Infrastructure
- Public Health & Laboratories
- Medical Supply & Stockpiles
- Education & Skills Infrastructure
- Research & Scientific Facilities
- Housing, Community & Social Services
- Government & Public Administration
- Cultural, Community & Recreational Infrastructure
- Justice & Corrections
- Emergency Services & Civil Protection
- Hydrometeorology & Early Warning
Space, Aerospace & Defence InfrastructureBack to top ↑
GINC Capability Domains · Chapter 06
National Security
🇮🇸 Iceland’s force, intelligence and the defence of the nation
Disputes and terrorismBack to top ↑
Iceland, the UK, and Ireland dispute Denmark's claim that the Faroe Islands' continental shelf extends beyond 200 nm; the European Free Trade Association Surveillance Authority filed a suit against Iceland, claiming the country violated the European Economic Area agreement in failing to pay minimum compensation to Icesave depositors
Force Generation & MobilisationBack to top ↑
no regular military forces; Icelandic National Police; Icelandic Coast Guard (2013)
0.13% of GDP (2012)//0.14% of GDP (2011)//0.13% of GDP (2010)
Iceland has no standing military force; all US military forces in Iceland were withdrawn as of October 2006; defense of Iceland remains a NATO commitment and NATO maintains an air policing presence in Icelandic airspace; Iceland participates in international peacekeeping missions with the civilian-manned Icelandic Crisis Response Unit (ICRU) (2011)
Forces under arms
Active-duty strength on the Correlates of War series, which reaches back to 1816 and so carries a nation’s whole record of mobilisation rather than its present establishment. The card opens the full cross-country comparison.
Intelligence & AssessmentBack to top ↑
- Imagery & Geospatial Intelligence
- Signals & Cyber Intelligence
- Technical & Measurement Intelligence
- Open-Source & Financial Intelligence
- Human Intelligence & Counterintelligence
- All-Source Analysis & Warning
Joint Command, Projection & SustainmentBack to top ↑
- Command, Control & Communications
- Strategic Lift & Mobility
- Expeditionary & Peace Operations
- Operational Sustainment & War Reserves
- Defence Industrial Mobilisation
- CBRN Defence
Land PowerBack to top ↑
- Combined Arms Manoeuvre
- Land Fires
- Battlefield Aviation & Uncrewed Systems
- Special Operations & Irregular Warfare
Maritime PowerBack to top ↑
- Maritime Security & Constabulary
- Sea Denial & Undersea Warfare
- Sea Control
- Amphibious & Expeditionary Operations
Air PowerBack to top ↑
- Air Sovereignty & Policing
- Control of the Air
- Air Strike & Interdiction
- Airborne ISR, Early Warning & Battle Management
Strategic Strike & Missile DefenceBack to top ↑
Space OperationsBack to top ↑
Cyber & Electromagnetic OperationsBack to top ↑
Nuclear DeterrenceBack to top ↑
GINC Capability Domains · Chapter 07
Human Capital
🇮🇸 Iceland’s population, health and the skills that sustain capability
DemographyBack to top ↑
317,351 (July 2014 est.)
0.65% (2014 est.)
13.09 births/1,000 population (2014 est.)
7.13 deaths/1,000 population (2014 est.)
1.88 children born/woman (2014 est.)
27 (2011 est.)
Migration and urbanisationBack to top ↑
0.52 migrant(s)/1,000 population (2014 est.)
REYKJAVIK (capital) 206,000 (2011)
Welfare and equityBack to top ↑
NA%
28 (2006)//25 (2005)
Early Childhood DevelopmentBack to top ↑
Foundational EducationBack to top ↑
7.6% of GDP (2010)
Advanced EducationBack to top ↑
Technical & Vocational SkillsBack to top ↑
Digital & AI CompetenceBack to top ↑
Lifelong Learning & ReskillingBack to top ↑
Research Talent & Knowledge CreationBack to top ↑
Population HealthBack to top ↑
5 deaths/100,000 live births (2010)
23.2% (2008)
0.3% (2009 est.)
fewer than 1,000 (2009 est.)
fewer than 100 (2009 est.)
Health System CapabilityBack to top ↑
9.1% of GDP (2011)
3.46 physicians/1,000 population (2011)
5.8 beds/1,000 population (2007)
GINC Capability Domains · Chapter 08
Governance and Integrity
🇮🇸 Iceland’s institutions, law and the integrity of the state
State structureBack to top ↑
constitutional republic
8 regions; Austurland, Hofudhborgarsvaedhi, Nordhurland Eystra, Nordhurland Vestra, Sudhurland, Sudhurnes, Vestfirdhir, Vesturland
several previous; latest ratified 16 June 1944, effective 17 June 1944 (at independence); amended many times, last in 2013; note - a new constitution drafted in 2012 in the aftermath of the country's banking collapse was voted down in April 2013 by the recently elected parliament, though several amendments were passed (2013)
18 years of age; universal
Political Institutions & Civic ParticipationBack to top ↑
- Electoral Management & Integrity
- Legislature & Deliberative Institutions
- Citizen Participation & Civic Space
unicameral Althingi (parliament) (63 seats; members elected by popular vote to serve four-year terms)
Bright Future (Bjort Framtid) or BF [Gudmundur STEINGRIMSSON]//Dawn (Dogun) [Benedikt SIGURDARSON]//Independence Party (Sjalfstaedisflokkurinn) or IP [Bjarni BENEDIKTSSON]//Left-Green Movement (Vinstrihreyfingin) or LGM [Katrin JAKOBSDOTTIR]//Pirate Party [Birgitta JONSDOTTIR]//Progressive Party (Framsoknarflokkurinn) or PP [Sigmundur David GUNNLAUGSSON]//Rainbow [Atli GISLASON] [Jon BJARNASON]//Social Democratic Alliance (Samfylkingin) or SDA [Arni Pall ARNASON]//Solidarity (Samstada) [Lilja MOSESDOTTIR]
Justice System & Fundamental RightsBack to top ↑
- Judicial Independence & Court Capability
- Access to Justice & Legal Services
- Fundamental Rights Protection
- Human Rights Institutions & Equality Bodies
civil law system influenced by the Danish model
has not submitted an ICJ jurisdiction declaration; accepts ICCt jurisdiction
Internal Security & OrderBack to top ↑
Regulatory Governance & Strategic ControlsBack to top ↑
- Regulatory Quality & Better Regulation
- Regulatory Delivery & Independent Regulators
- Strategic Controls & Economic Security Administration
Government Effectiveness & Public AdministrationBack to top ↑
- Centre of Government & Policy Coordination
- Civil Service & Public Workforce
- Digital Government & Service Delivery
- Legal Identity & Civil Registration
- Statistical & Data Capability
Public Integrity & Anti-CorruptionBack to top ↑
Transparency, Oversight & AccountabilityBack to top ↑
- Right to Information & Open Government
- Independent Oversight & Supreme Audit
- Independent Media & Journalist Safety
National Resilience & Crisis ManagementBack to top ↑
GINC Capability Domains · Chapter 09
Information and Influence
🇮🇸 Iceland’s identity, media and the projection of influence
Identity and cultureBack to top ↑
Icelandic, English, Nordic languages, German widely spoken
Evangelical Lutheran Church of Iceland (official) 76.2%, Roman Catholic 3.4%, Reykjavik Free Church 2.9%, Hafnarfjorour Free Church 1.9%, The Independent Congregation 1%, other religions 3.6% (includes Pentecostal and Asatru Association), none 5.2%, other or unspecified 5.9% (2013 est.)
homogeneous mixture of descendants of Norse and Celts 94%, population of foreign origin 6%
gyrfalcon
blue with a red cross outlined in white extending to the edges of the flag; the vertical part of the cross is shifted to the hoist side in the style of the Dannebrog (Danish flag); the colors represent three of the elements that make up the island: red is for the island's volcanic fires, white recalls the snow and ice fields of the island, and blue is for the surrounding ocean
Diplomatic Statecraft & Global NetworksBack to top ↑
- Diplomatic Network & Consular Reach
- Multilateral Leadership & Norm Setting
- Agenda-Setting & Convening
- Mediation & Crisis Diplomacy
Arctic Council, Australia Group, BIS, CBSS, CD, CE, EAPC, EBRD, EFTA, EU (candidate country), FAO, FATF, IAEA, IBRD, ICAO, ICC (national committees), ICRM, IDA, IFAD, IFC, IFRCS, IHO, ILO, IMF, IMO, IMSO, Interpol, IOC, IPU, ISO, ITSO, ITU, ITUC (NGOs), MIGA, NATO, NC, NEA, NIB, NSG, OAS (observer), OECD, OPCW, OSCE, PCA, Schengen Convention, UN, UNCTAD, UNESCO, UPU, WCO, WHO, WIPO, WMO, WTO
Alliances & Security CooperationBack to top ↑
Development Cooperation & Global AssistanceBack to top ↑
Culture, Language & Education DiplomacyBack to top ↑
- Cultural & Language Institutes
- Creative Industries & Cultural Export Reach
- Heritage & Cultural Institutions
- Education Diplomacy & Alumni Networks
- Sports & Major Events
Diaspora & Global CommunitiesBack to top ↑
Information Environment & Strategic CommunicationBack to top ↑
- Strategic Communications & Public Diplomacy
- International Media & Broadcasting
- Information Defence & Counter-Interference
state-owned public TV broadcaster operates 1 TV channel nationally; several privately owned TV stations broadcast nationally and roughly another half-dozen operate locally; about one-half the households utilize multi-channel cable or satellite TV services; state-owned public radio broadcaster operates 2 national networks and 4 regional stations; 2 privately owned radio stations operate nationally and another 15 provide more limited coverage (2007)
GINC Capability Domains · Chapter 10
Financial Strength
🇮🇸 Iceland’s fiscal depth, reserves and the capacity to act
Monetary & Currency CapabilityBack to top ↑
- Monetary Policy & Price Stability
- Exchange Rate & External Account Management
- Currency Issuance & Digital Money
3.9% (2013 est.)//$NA (2012 est.)
Icelandic kronur (ISK) per US dollar -//123.7 (2013 est.)//125.08 (2012 est.)//122.24 (2010 est.)//123.64 (2009)//85.619 (2008)
5.4% (31 January 2012 est.)//5.75% (31 December 2010 est.)
9.3% (31 December 2013 est.)//8.33% (31 December 2012 est.)
$3.876 billion (31 December 2013 est.)//$3.562 billion (31 December 2012 est.)
$7.152 billion (31 December 2012 est.)//$7.006 billion (31 December 2012 est.)
Fiscal Capacity & Public FinanceBack to top ↑
- Revenue Mobilisation & Tax Administration
- Public Expenditure & Budget Management
- Sovereign Debt & Treasury Management
- Public Investment Management
42.7% of GDP (2013 est.)
-1.5% of GDP (2013 est.)
130.5% of GDP (2013 est.)//131.8% of GDP (2012 est.)
calendar year
Financial System Depth & AccessBack to top ↑
- Banking System Capacity
- Capital Markets Depth & Development
- Long-Term & Institutional Capital
- Financial Inclusion & Household Access
- Development & Policy Finance
$19.35 billion (31 December 2013 est.)//$18.96 billion (31 December 2012 est.)
$2.825 billion (31 December 2012 est.)//$2.021 billion (31 December 2011)//$1.996 billion (31 December 2010 est.)
15.4% of GDP (2013 est.)//9.3% of GDP (2012 est.)//8.1% of GDP (2011 est.)
Financial Regulation & IntegrityBack to top ↑
- Prudential Regulation & Supervision
- Financial Integrity & Illicit Finance Control
- Market Conduct & Consumer Protection
- Payment & Market Infrastructure Oversight
Financial Stability & Crisis ManagementBack to top ↑
- Macroprudential & Systemic Oversight
- Crisis Management, Resolution & Deposit Insurance
- External Liquidity & Financial Safety Nets
Sovereign Capital & External Financial PowerBack to top ↑
- Official Reserves Management
- Sovereign Wealth & Public Asset Management
- Currency Internationalisation & Reserve Status
- Capital Account & Flow Management
- International Financial Centre Capability
$5.604 billion (31 December 2013 est.)//$4.192 billion (31 December 2012 est.)
$102 billion (31 December 2012 est.)//$110.8 billion (31 December 2011 est.)
GINC Capability Domains · Chapter 11
Production and Innovation
🇮🇸 Iceland’s output, industry and the engine of prosperity
Economic Output & ProductivityBack to top ↑
Iceland's Scandinavian-type social-market economy combines a capitalist structure and free-market principles with an extensive welfare system. Prior to the 2008 crisis, Iceland had achieved high growth, low unemployment, and a remarkably even distribution of income. The economy depends heavily on the fishing industry, which provides 40% of export earnings, more than 12% of GDP, and employs nearly 5% of the work force. It remains sensitive to declining fish stocks as well as to fluctuations in world prices for its main exports: fish and fish products, aluminum, and ferrosilicon. Iceland's economy has been diversifying into manufacturing and service industries in the last decade, particularly within the fields of software production, biotechnology, and tourism. In fall 2013, the Icelandic government approved a joint application by Icelandic, Chinese and Norwegian energy firms to conduct oil exploration off Iceland’s northeast coast. Abundant geothermal and hydropower sources have attracted substantial foreign investment in the aluminum sector, boosted economic growth, and sparked some interest from high-tech firms looking to establish data centers using cheap green energy, although the financial crisis has put several investment projects on hold. Much of Iceland's economic growth in recent years came as the result of a boom in domestic demand following the rapid expansion of the country's financial sector. Domestic banks expanded aggressively in foreign markets, and consumers and businesses borrowed heavily in foreign currencies, following the privatization of the banking sector in the early 2000s. Worsening global financial conditions throughout 2008 resulted in a sharp depreciation of the krona vis-a-vis other major currencies. The foreign exposure of Icelandic banks, whose loans and other assets totaled more than 10 times the country's GDP, became unsustainable. Iceland's three largest banks collapsed in late 2008. The country secured over $10 billion in loans from the IMF and other countries to stabilize its currency and financial sector, and to back government guarantees for foreign deposits in Icelandic banks. GDP fell 6.8% in 2009, and unemployment peaked at 9.4% in February 2009. Since the collapse of Iceland's financial sector, government economic priorities have included: stabilizing the krona, implementing capital controls, reducing Iceland's high budget deficit, containing inflation, addressing high household debt, restructuring the financial sector, and diversifying the economy. Three new banks were established to take over the domestic assets of the collapsed banks. Two of them have foreign majority ownership, while the State holds a majority of the shares of the third. Iceland began making payments to the UK, the Netherlands, and other claimants in late 2011 following Iceland's Supreme Court ruling that upheld 2008 emergency legislation that gives priority to depositors for compensation from failed Icelandic banks. Iceland owes British and Dutch authorities approximately $5.5 billion for compensating British and Dutch citizens who lost deposits in Icesave when parent bank Landsbanki failed in 2008. Iceland began accession negotiations with the EU in July 2010, but decided in mid-2013 to suspend negotiations with the EU because of concern about losing control over fishing resources and worries over the ongoing Eurozone crisis.
$13.11 billion (2013 est.)//$12.87 billion (2012 est.)//$12.66 billion (2011 est.)
1.9% (2013 est.)//1.6% (2012 est.)//2.9% (2011 est.)
$40,700 (2013 est.)//$40,300 (2012 est.)//$39,800 (2011 est.)
$14.59 billion (2013 est.)
Labour & EmploymentBack to top ↑
- Employment & Labour Force Participation
- Labour Market Institutions & Wage Setting
- Employment Services & Skills Matching
- Labour Adjustment, Transition & Formalisation
181,100 (2013 est.)
4.5% (2013 est.)//5.8% (2012 est.)
Industrial & Sectoral BaseBack to top ↑
- Manufacturing & Advanced Industry
- Foundational & Process Industries
- Agrifood & Primary Production
- Services Economy
potatoes, green vegetables; mutton, chicken, pork, beef, dairy products; fish
fish processing; aluminum smelting, ferrosilicon production; geothermal power, hydropower, tourism
-1% (2013 est.)
Structural Transformation & ComplexityBack to top ↑
Business Dynamism & EntrepreneurshipBack to top ↑
- Entrepreneurship & Firm Creation
- Risk Capital & Scale-Up Finance
- Firm Growth, Exit & Renewal
- Competition & Market Contestability
Innovation & CommercialisationBack to top ↑
- Business Innovation Capability
- Research Commercialisation & Knowledge Transfer
- Intellectual Property & Intangible Assets
- Innovation Ecosystems & Clusters
Technology Adoption & DiffusionBack to top ↑
GINC Capability Domains · Chapter 12
Trade and Investment
🇮🇸 Iceland’s markets, capital and the terms of global exchange
Overall tradeBack to top ↑
$7.50B of exports to 160 partners and $9.98B of imports from 183 in 2024, a deficit of $2.48B.
- Exports
- $7.50B160 partners
- Imports
- $9.98B183 partners
- Balance
- −$2.48Bdeficit
- Total trade
- $17.5B2024
ExportsBack to top ↑
Where its exports go
The largest partners in 2024, with each one's share of the nation's exports.
| Partner | Value | Share | |
|---|---|---|---|
| Netherlands | $1.59B | 21% | |
| United States | $1.05B | 14% | |
| United Kingdom | $710M | 9.5% | |
| Germany | $638M | 8.5% | |
| France | $521M | 6.9% | |
| Norway | $436M | 5.8% | |
| Poland | $377M | 5.0% | |
| Spain | $302M | 4.0% | |
| Denmark | $164M | 2.2% | |
| China | $152M | 2.0% | |
| Japan | $127M | 1.7% | |
| Canada | $115M | 1.5% | |
| Switzerland | $98.3M | 1.3% | |
| Ukraine | $97.3M | 1.3% | |
| Czech Republic | $94.8M | 1.3% | |
| Sweden | $66.1M | 0.9% | |
| Belgium | $64.9M | 0.9% | |
| Portugal | $64.4M | 0.9% | |
| Nigeria | $49.3M | 0.7% | |
| Uzbekistan | $45.1M | 0.6% |
What it exports
The largest categories in 2024.
| Category | Value | Share | |
|---|---|---|---|
| Aluminum | $2.41B | 32% | |
| Fish, crustaceans, molluscs, aquatics invertebrates | $2.31B | 31% | |
| Optical, photo, technical, medical apparatus | $593M | 7.9% | |
| Pharmaceutical products | $400M | 5.3% | |
| Animal, vegetable fats and oils, cleavage products | $253M | 3.4% | |
| Residues, wastes of food industry, animal fodder | $251M | 3.3% | |
| Iron and steel | $198M | 2.6% | |
| Machinery, nuclear reactors, boilers | $173M | 2.3% | |
| Meat, fish and seafood preparations | $127M | 1.7% | |
| Mineral fuels, oils, distillation products | $114M | 1.5% | |
| Electrical, electronic equipment | $86.7M | 1.2% | |
| Aircraft, spacecraft | $79.0M | 1.1% | |
| Ships, boats, and other floating structures | $63.0M | 0.8% | |
| Inorganic chemicals, precious metal compound, isotope | $60.5M | 0.8% | |
| Beverages, spirits and vinegar | $54.2M | 0.7% |
ImportsBack to top ↑
Where its imports come from
The largest partners in 2024, with each one's share of the nation's imports.
| Partner | Value | Share | |
|---|---|---|---|
| China | $1.13B | 11% | |
| Norway | $1.07B | 11% | |
| United States | $830M | 8.3% | |
| Germany | $794M | 8.0% | |
| Denmark | $688M | 6.9% | |
| Netherlands | $634M | 6.4% | |
| Sweden | $414M | 4.1% | |
| United Kingdom | $381M | 3.8% | |
| Brazil | $293M | 2.9% | |
| Poland | $280M | 2.8% | |
| Italy | $246M | 2.5% | |
| France | $239M | 2.4% | |
| Australia | $213M | 2.1% | |
| Spain | $196M | 2.0% | |
| Lithuania | $166M | 1.7% | |
| Turkey | $160M | 1.6% | |
| Belgium | $149M | 1.5% | |
| Jamaica | $149M | 1.5% | |
| Kuwait | $134M | 1.3% | |
| Ireland | $131M | 1.3% |
What it imports
The largest categories in 2024.
| Category | Value | Share | |
|---|---|---|---|
| Machinery, nuclear reactors, boilers | $1.46B | 15% | |
| Electrical, electronic equipment | $1.21B | 12% | |
| Mineral fuels, oils, distillation products | $1.14B | 11% | |
| Vehicles other than railway, tramway | $785M | 7.9% | |
| Inorganic chemicals, precious metal compound, isotope | $758M | 7.6% | |
| Plastics | $294M | 2.9% | |
| Furniture, lighting signs, prefabricated buildings | $274M | 2.7% | |
| Pharmaceutical products | $268M | 2.7% | |
| Optical, photo, technical, medical apparatus | $235M | 2.4% | |
| Articles of iron or steel | $223M | 2.2% | |
| Residues, wastes of food industry, animal fodder | $205M | 2.1% | |
| Ships, boats, and other floating structures | $191M | 1.9% | |
| Wood and articles of wood, wood charcoal | $176M | 1.8% | |
| Aircraft, spacecraft | $156M | 1.6% | |
| Aluminum | $145M | 1.5% |
In a list, the bar runs to the largest in that list. The line is each figure’s history from 2000, drawn to its own peak: it shows the shape of the years, and the value shows the size.
External balanceBack to top ↑
-$100 million (2013 est.)//-$740 million (2012 est.)
Trade Facilitation & LogisticsBack to top ↑
Trade Policy & Market AccessBack to top ↑
- Trade Policy & Negotiation Capability
- Market Access & Agreements Network
- Trade Law & Enforcement
- Standards, Conformity & Quality Infrastructure
Digital & Services TradeBack to top ↑
- Services Trade Capability
- Digital Trade & E-Commerce
- Data Flows & Digital Trade Governance
- Tourism & Visitor Economy
Investment Attraction & ProjectionBack to top ↑
- Investment Attraction & Facilitation
- Investment Absorption & Linkages
- Outward Investment & Global Corporate Presence
$NA//$9.2 billion (31 December 2008)
$NA//$8.8 billion (31 December 2008)
Export Capability & SophisticationBack to top ↑
$5.2 billion (2013 est.)//$5.06 billion (2012 est.)
Netherlands 30%, Germany 12.9%, UK 9.8%, Norway 5.1%, US 4.5%, France 4.4% (2012)
fish and fish products 40%, aluminum, animal products, ferrosilicon, diatomite
Global Value Chain PositionBack to top ↑
- Value Chain Participation & Integration
- Value Chain Position & Upgrading
- Regional Integration & Hub Anchoring
Economic Leverage & DependenceBack to top ↑
- Strategic Supply Security
- Concentration Risk & Revenue Stabilisation
- Economic Leverage & Coercion Resistance
$4.526 billion (2013 est.)//$4.441 billion (2012 est.)
Norway 16.6%, US 10.2%, Germany 9.2%, China 7.2%, Brazil 6.7%, Netherlands 6%, Denmark 5.7%, UK 4.6% (2012)
machinery and equipment, petroleum products, foodstuffs, textiles
Iceland · you are in
Historical Context
Foundations
GINC Capability Domains
Find in this brief · Iceland