
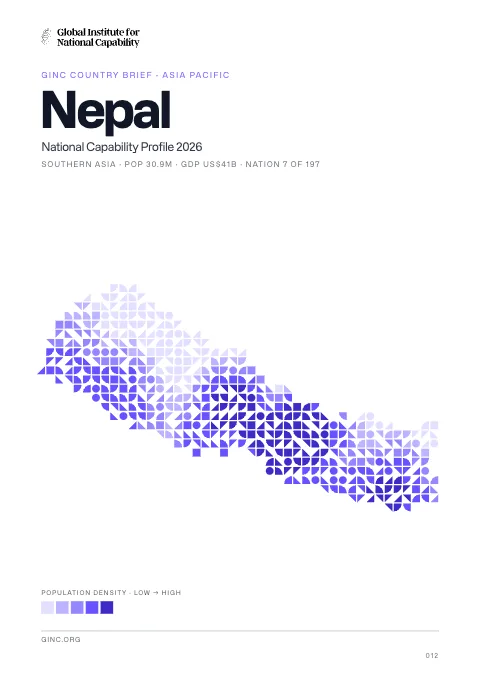
Nepal
Nepal is a landlocked federal democratic republic in South Asia, home to 31 million people, with its capital at Kathmandu.
Contents
12 chapters
Foundations
01–03
At a glance
- Area
- 147.2Kkm²#94 World#3 South Asia
- Population
- 31M#41 World#4 South Asia
- GDP (market)
- $19.3B
- GDP (PPP)
- $42.1B#103 World#5 South Asia
- GDP per capita
- $1.5K#204 World#6 South Asia
The whole brief
Nepal National Capability Profile 2026
Foundations · Chapter 01
Historical Context
🇳🇵 Nepal’s understanding the origins and evolution of the modern nation
BackgroundBack to top ↑
In 1951, the Nepali monarch ended the century-old system of rule by hereditary premiers and instituted a cabinet system of government. Reforms in 1990 established a multiparty democracy within the framework of a constitutional monarchy. An insurgency led by Maoists broke out in 1996. The ensuing 10-year civil war between Maoist and government forces witnessed the dissolution of the cabinet and parliament and assumption of absolute power by the king in 2002. Several weeks of mass protests in April 2006 were followed by several months of peace negotiations between the Maoists and government officials, and culminated in a late 2006 peace accord and the promulgation of an interim constitution. Following a nationwide election in April 2008, the newly formed Constituent Assembly (CA) declared Nepal a federal democratic republic and abolished the monarchy at its first meeting the following month. The CA elected the country's first president in July. Between 2008 and 2011 there were four different coalition governments, led twice by the United Communist Party of Nepal-Maoist, which received a plurality of votes in the 2008 CA election, and twice by the Communist Party of Nepal-United Marxist-Leninist (UML). After the CA failed to draft a constitution by the May 2012 deadline set by the Supreme Court, then Prime Minister Baburam BHATTARAI dissolved the CA. Months of negotiations ensued until March 2013 when the major political parties agreed to create an interim government headed by then Chief Justice Khil Raj REGMI with a mandate to hold elections for a new CA. Elections were held in November 2013, in which and the Nepali Congress won the largest share of the seats in the CA and in February 2014 formed a coalition government with the second place UML and with Nepali Congress President Sushil KOIRALA as prime minister
IndependenceBack to top ↑
1768 (unified by Prithvi Narayan SHAH)
National holidayBack to top ↑
Republic Day, 29 May
Foundations · Chapter 02
Geography
🇳🇵 Nepal’s territory, resources and strategic position
Location and areaBack to top ↑
Southern Asia, between China and India
28 00 N, 84 00 E
Asia
slightly larger than Arkansas
0 km (landlocked)
none (landlocked)
Terrain and resourcesBack to top ↑
Tarai or flat river plain of the Ganges in south, central hill region, rugged Himalayas in north
quartz, water, timber, hydropower, scenic beauty, small deposits of lignite, copper, cobalt, iron ore
11,680 sq km (2003)
Settlement and hazardsBack to top ↑
severe thunderstorms; flooding; landslides; drought and famine depending on the timing, intensity, and duration of the summer monsoons
landlocked; strategic location between China and India; contains eight of world's 10 highest peaks, including Mount Everest and Kanchenjunga - the world's tallest and third tallest - on the borders with China and India respectively
OtherBack to top ↑
210.2 cu km (2011)
deforestation (overuse of wood for fuel and lack of alternatives); contaminated water (with human and animal wastes, agricultural runoff, and industrial effluents); wildlife conservation; vehicular emissions
Foundations · Chapter 03
Environment
🇳🇵 Nepal’s environmental conditions, resources and national resilience
ClimateBack to top ↑
varies from cool summers and severe winters in north to subtropical summers and mild winters in south
Emissions and pollutionBack to top ↑
Water, waste and foodBack to top ↑
Resources and agreementsBack to top ↑
GINC Capability Domains · Chapter 04
Critical Technology
🇳🇵 Nepal’s technology frontiers and the pursuit of national advantage
Two counts are set side by side for 2015–2024: on the left, the papers researchers in Nepal published; on the right, the patent families that began there and were filed in more than one country. First by capability group, then group by group with each group’s capabilities. The badge on a card is the nation’s place among all nations. Papers are from GINC Research Analytics, patent families from GINC Patents.
Research by capability group
#73 WorldPapers published, 2015–2024
901
252
195
171
140
123
35
26
19
5
Patents by capability group
International patent families, 2015–2024
No international patent families on record for 2015–2024.
Advanced Materials & ManufacturingBack to top ↑
Research
#76 WorldPapers published, 2015–2024
Patents
International patent families, 2015–2024
No international patent families on record for 2015–2024.
Energy TechnologiesBack to top ↑
Research
#74 WorldPapers published, 2015–2024
Patents
International patent families, 2015–2024
No international patent families on record for 2015–2024.
Semiconductors & Advanced ComputingBack to top ↑
Research
#88 WorldPapers published, 2015–2024
No research topic: Semiconductor Design & EDA · Advanced Semiconductor Fabrication · Semiconductor Equipment & Materials · Advanced Packaging & Heterogeneous Integration
Patents
International patent families, 2015–2024
No international patent families on record for 2015–2024.
Artificial IntelligenceBack to top ↑
Research
#60 WorldPapers published, 2015–2024
Patents
International patent families, 2015–2024
No international patent families on record for 2015–2024.
Quantum TechnologiesBack to top ↑
Research
#82 WorldPapers published, 2015–2024
Patents
International patent families, 2015–2024
No international patent families on record for 2015–2024.
Connectivity, Cyber & Trust TechnologiesBack to top ↑
Research
#69 WorldPapers published, 2015–2024
Patents
International patent families, 2015–2024
No international patent families on record for 2015–2024.
Sensing, Timing & NavigationBack to top ↑
Research
#83 WorldPapers published, 2015–2024
Patents
International patent families, 2015–2024
No international patent families on record for 2015–2024.
Robotics & Autonomous SystemsBack to top ↑
Research
#75 WorldPapers published, 2015–2024
No research topic: Human-Machine Interfaces
Patents
International patent families, 2015–2024
No international patent families on record for 2015–2024.
Biotechnology & Health TechnologiesBack to top ↑
Research
#70 WorldPapers published, 2015–2024
Patents
International patent families, 2015–2024
No international patent families on record for 2015–2024.
Medicine and BioTech
Clinical research and life-science invention, drawn from the same series that drive the metric pages. Each card opens the full cross-country comparison.
Space TechnologiesBack to top ↑
Research
#61 WorldPapers published, 2015–2024
Patents
International patent families, 2015–2024
No international patent families on record for 2015–2024.
GINC Capability Domains · Chapter 05
Strategic Infrastructure
🇳🇵 Nepal’s energy, connectivity and the material foundations of capability
Resource InfrastructureBack to top ↑
0 bbl/day (2012 est.)
0 bbl/day (2010 est.)
0 bbl/day (2010 est.)
0 bbl (1 January 2013 est.)
0 bbl/day (2010 est.)
18,430 bbl/day (2011 est.)
0 bbl/day (2010 est.)
21,960 bbl/day (2010 est.)
0 cu m (2011 est.)
0 cu m (2010 est.)
0 cu m (2011 est.)
0 cu m (2011 est.)
0 cu m (1 January 2013 est.)
Agriculture & Food InfrastructureBack to top ↑
- Irrigation & Agricultural Water
- Livestock & Veterinary
- Fisheries & Aquaculture
- Storage, Cold Chain & Markets
Energy InfrastructureBack to top ↑
- Thermal Generation
- Nuclear Generation
- Nuclear Fuel Cycle & Radioactive Waste
- Hydropower
- Renewable Generation
- Transmission & Distribution
- System Control & Dispatch
- Storage & Fuel Supply
721,000 kW (2010 est.)
3.431 billion kWh (2012 est.)
2.745 billion kWh (2010 est.)
30 million kWh (2010 est.)
694 million kWh (2010 est.)
7.9% of total installed capacity (2010 est.)
0% of total installed capacity (2010 est.)
92.1% of total installed capacity (2010 est.)
0% of total installed capacity (2010 est.)
3.173 million Mt (2011 est.)
Water, Sanitation & Waste InfrastructureBack to top ↑
- Dams, Reservoirs & Flood Defence
- Water Supply & Treatment
- Bulk Water Transfer & Desalination
- Wastewater & Sanitation
- Solid Waste & Recycling
Advanced ManufacturingBack to top ↑
- Materials & Inputs
- Chemicals & Hazardous Process Industry
- Production Systems
- Supply Chain & Ecosystem
- Workforce & Innovation
Transport InfrastructureBack to top ↑
- Seaports & Terminals
- Air Infrastructure
- Air Navigation & Traffic Management
- Inland Waterways & Ferries
- Rail Infrastructure
- Roads & Bridges
- Logistics, Multimodal & Border Infrastructure
- Postal & Parcel
47 (2013)
Communications & Digital InfrastructureBack to top ↑
- Subsea Cables & International Gateways
- Core & Backbone Networks
- Mobile & Wireless Networks
- Spectrum & Broadcasting
- Data Centres, Compute & Cloud
- Data Resources
- AI Tools & Applications
834,000 (2013)
18.138 million (2013)
577,800 (2009)
41,256 (2012)
.np
Financial InfrastructureBack to top ↑
- Currency & Reserves
- Payments & Settlement Systems
- Markets, Exchanges & Depositories
- Banks, Insurers & Systemic Institutions
Social InfrastructureBack to top ↑
- Health Infrastructure
- Public Health & Laboratories
- Medical Supply & Stockpiles
- Education & Skills Infrastructure
- Research & Scientific Facilities
- Housing, Community & Social Services
- Government & Public Administration
- Cultural, Community & Recreational Infrastructure
- Justice & Corrections
- Emergency Services & Civil Protection
- Hydrometeorology & Early Warning
Space, Aerospace & Defence InfrastructureBack to top ↑
GINC Capability Domains · Chapter 06
National Security
🇳🇵 Nepal’s force, intelligence and the defence of the nation
Disputes and terrorismBack to top ↑
joint border commission continues to work on contested sections of boundary with India, including the 400 sq km dispute over the source of the Kalapani River; India has instituted a stricter border regime to restrict transit of Maoist insurgents and illegal cross-border activities
Force Generation & MobilisationBack to top ↑
Nepal Army (2012)
18 years of age for voluntary military service; no conscription (2014)
NA% (2012)//1.41% of GDP (2011)//NA% (2010)
Forces under arms
Active-duty strength on the Correlates of War series, which reaches back to 1816 and so carries a nation’s whole record of mobilisation rather than its present establishment. The card opens the full cross-country comparison.
Intelligence & AssessmentBack to top ↑
- Imagery & Geospatial Intelligence
- Signals & Cyber Intelligence
- Technical & Measurement Intelligence
- Open-Source & Financial Intelligence
- Human Intelligence & Counterintelligence
- All-Source Analysis & Warning
Joint Command, Projection & SustainmentBack to top ↑
- Command, Control & Communications
- Strategic Lift & Mobility
- Expeditionary & Peace Operations
- Operational Sustainment & War Reserves
- Defence Industrial Mobilisation
- CBRN Defence
Land PowerBack to top ↑
- Combined Arms Manoeuvre
- Land Fires
- Battlefield Aviation & Uncrewed Systems
- Special Operations & Irregular Warfare
Maritime PowerBack to top ↑
- Maritime Security & Constabulary
- Sea Denial & Undersea Warfare
- Sea Control
- Amphibious & Expeditionary Operations
Air PowerBack to top ↑
- Air Sovereignty & Policing
- Control of the Air
- Air Strike & Interdiction
- Airborne ISR, Early Warning & Battle Management
Strategic Strike & Missile DefenceBack to top ↑
Space OperationsBack to top ↑
Cyber & Electromagnetic OperationsBack to top ↑
Nuclear DeterrenceBack to top ↑
GINC Capability Domains · Chapter 07
Human Capital
🇳🇵 Nepal’s population, health and the skills that sustain capability
DemographyBack to top ↑
30,986,975 (July 2014 est.)
1.82% (2014 est.)
21.07 births/1,000 population (2014 est.)
6.62 deaths/1,000 population (2014 est.)
2.3 children born/woman (2014 est.)
20.1
49.7% (2011)
Migration and urbanisationBack to top ↑
3.71 migrant(s)/1,000 population (2014 est.)
KATHMANDU (capital) 1.015 million (2011)
Welfare and equityBack to top ↑
25.2% (2011 est.)
32.8 (2010)//47.2 (2008 est.)
DisplacementBack to top ↑
Early Childhood DevelopmentBack to top ↑
29.1% (2011)
Foundational EducationBack to top ↑
4.7% of GDP (2010)
Advanced EducationBack to top ↑
Technical & Vocational SkillsBack to top ↑
Digital & AI CompetenceBack to top ↑
Generative AI adoption
Modelled share of working-age adults using generative AI, from Microsoft telemetry scaled to each country’s 15–64 population. A measure of how fast a workforce is absorbing the technology rather than of how much of it a nation builds. The card opens the full cross-country comparison.
Lifelong Learning & ReskillingBack to top ↑
Research Talent & Knowledge CreationBack to top ↑
Population HealthBack to top ↑
170 deaths/100,000 live births (2010)
1.4% (2008)
0.3% (2012 est.)
48,700 (2012 est.)
4,100 (2012 est.)
Health System CapabilityBack to top ↑
5.4% of GDP (2011)
0.21 physicians/1,000 population (2004)
4.7 beds/1,000 population (2009)
GINC Capability Domains · Chapter 08
Governance and Integrity
🇳🇵 Nepal’s institutions, law and the integrity of the state
State structureBack to top ↑
federal democratic republic
14 zones (anchal, singular and plural); Bagmati, Bheri, Dhawalagiri, Gandaki, Janakpur, Karnali, Kosi, Lumbini, Mahakali, Mechi, Narayani, Rapti, Sagarmatha, Seti
several previous; latest entered into force 15 January 2007 (interim); note -a Constituent Assembly (CA) elected in 2008 to draft and promulgate a new constitution was unsuccessful and was disolved in mid-2012; a new CA was elected in late 2013 and the parties have committed to promulgating a new constitution by mid-February 2015 (2014)
18 years of age; universal
Political Institutions & Civic ParticipationBack to top ↑
- Electoral Management & Integrity
- Legislature & Deliberative Institutions
- Citizen Participation & Civic Space
unicameral Constituent Assembly (601 seats; 240 members elected by direct popular vote, 335 by proportional representation, and 26 appointed by the Cabinet (Council of Ministers); note - interim government Chairman REGMI convened Nepal's second Constituency Assembly on 22 January 2014
The Communist Party of Nepal - Maoist (CPN-M); note - this party split from the UCPN(M) in June 2012,opposed the November 2013 elections, and is not represented in the current Constituent Assembly
Justice System & Fundamental RightsBack to top ↑
- Judicial Independence & Court Capability
- Access to Justice & Legal Services
- Fundamental Rights Protection
- Human Rights Institutions & Equality Bodies
English common law and Hindu legal concepts
has not submitted an ICJ jurisdiction declaration; non-party state to the ICCt
Internal Security & OrderBack to top ↑
illicit producer of cannabis and hashish for the domestic and international drug markets; transit point for opiates from Southeast Asia to the West
Regulatory Governance & Strategic ControlsBack to top ↑
- Regulatory Quality & Better Regulation
- Regulatory Delivery & Independent Regulators
- Strategic Controls & Economic Security Administration
Government Effectiveness & Public AdministrationBack to top ↑
- Centre of Government & Policy Coordination
- Civil Service & Public Workforce
- Digital Government & Service Delivery
- Legal Identity & Civil Registration
- Statistical & Data Capability
Public Integrity & Anti-CorruptionBack to top ↑
Transparency, Oversight & AccountabilityBack to top ↑
- Right to Information & Open Government
- Independent Oversight & Supreme Audit
- Independent Media & Journalist Safety
National Resilience & Crisis ManagementBack to top ↑
GINC Capability Domains · Chapter 09
Information and Influence
🇳🇵 Nepal’s identity, media and the projection of influence
Identity and cultureBack to top ↑
Nepali (official) 44.6%, Maithali 11.7%, Bhojpuri 6%, Tharu 5.8%, Tamang 5.1%, Newar 3.2%, Magar 3%, Bajjika 3%, Urdu 2.6%, Avadhi 1.9%, Limbu 1.3%, Gurung 1.2%, other 10.4%, unspecified 0.2%
Hindu 81.3%, Buddhist 9%, Muslim 4.4%, Kirant 3.1%, Christian 1.4%, other 0.5%, unspecifed 0.2% (2011 est.)
Chhettri 16.6%, Brahman-Hill 12.2%, Magar 7.1%, Tharu 6.6%, Tamang 5.8%, Newar 5%, Kami 4.8%, Muslim 4.4%, Yadav 4%, Rai 2.3%, Gurung 2%, Damai/Dholii 1.8%, Thakuri 1.6%, Limbu 1.5%, Sarki 1.4%, Teli 1.4%, Chamar/Harijan/Ram 1.3%, Koiri/Kushwaha 1.2%, other 19%
rhododendron blossom
red with a blue border around the unique shape of two overlapping right triangles; the smaller, upper triangle bears a white stylized moon and the larger, lower triangle displays a white 12-pointed sun; the color red represents the rhododendron (Nepal's national flower) and is a sign of victory and bravery, the blue border signifies peace and harmony; the two right triangles are a combination of two single pennons (pennants) that originally symbolized the Himalaya Mountains while their charges represented the families of the king (upper) and the prime minister, but today they are understood to denote Hinduism and Buddhism, the country's two main religions; the moon represents the serenity of the Nepalese people and the shade and cool weather in the Himalayas, while the sun depicts the heat and higher temperatures of the lower parts of Nepal; the moon and the sun are also said to express the hope that the nation will endure as long as these heavenly bodies
Diplomatic Statecraft & Global NetworksBack to top ↑
- Diplomatic Network & Consular Reach
- Multilateral Leadership & Norm Setting
- Agenda-Setting & Convening
- Mediation & Crisis Diplomacy
ADB, BIMSTEC, CD, CP, FAO, G-77, IAEA, IBRD, ICAO, ICC, ICRM, IDA, IFAD, IFC, IFRCS, ILO, IMF, IMO, Interpol, IOC, IOM, IPU, ISO (correspondent), ITSO, ITU, ITUC (NGOs), MIGA, MINURSO, MINUSMA, MINUSTAH, MONUSCO, NAM, OPCW, SAARC, SACEP, UN, UNAMID, UNCTAD, UNESCO, UNIDO, UNIFIL, UNISFA, UNMIL, UNMISS, UNMIT, UNOCI, UNTSO, UNWTO, UPU, WCO, WFTU (NGOs), WHO, WIPO, WMO, WTO
Alliances & Security CooperationBack to top ↑
Development Cooperation & Global AssistanceBack to top ↑
Culture, Language & Education DiplomacyBack to top ↑
- Cultural & Language Institutes
- Creative Industries & Cultural Export Reach
- Heritage & Cultural Institutions
- Education Diplomacy & Alumni Networks
- Sports & Major Events
Diaspora & Global CommunitiesBack to top ↑
Information Environment & Strategic CommunicationBack to top ↑
- Strategic Communications & Public Diplomacy
- International Media & Broadcasting
- Information Defence & Counter-Interference
state operates 2 TV stations as well as national and regional radio stations; roughly 30 independent TV channels are registered with only about half in regular operation; nearly 400 FM radio stations are licensed with roughly 300 operational (2007)
GINC Capability Domains · Chapter 10
Financial Strength
🇳🇵 Nepal’s fiscal depth, reserves and the capacity to act
Monetary & Currency CapabilityBack to top ↑
- Monetary Policy & Price Stability
- Exchange Rate & External Account Management
- Currency Issuance & Digital Money
NA% (2013 est.)//9.5% (2012 est.)
Nepalese rupees (NPR) per US dollar -//87.96 (2013 est.)//85.2 (2012 est.)//73.16 (2010 est.)//77.44 (2009)//65.21 (2008)
6% (31 December 2010 est.)//6.5% (31 December 2009 est.)
9% (31 December 2013 est.)//8% (31 December 2012 est.)
$3.553 billion (31 December 2013 est.)//$3.104 billion (31 December 2012 est.)
$11.49 billion (31 December 2013 est.)//$11.71 billion (31 December 2012 est.)
Fiscal Capacity & Public FinanceBack to top ↑
- Revenue Mobilisation & Tax Administration
- Public Expenditure & Budget Management
- Sovereign Debt & Treasury Management
- Public Investment Management
17.1% of GDP (FY12/13)
-3.1% of GDP (FY12/13)
28% of GDP (FY11/12)
16 July - 15 July
Financial System Depth & AccessBack to top ↑
- Banking System Capacity
- Capital Markets Depth & Development
- Long-Term & Institutional Capital
- Financial Inclusion & Household Access
- Development & Policy Finance
$13.46 billion (31 December 2013 est.)//$11.88 billion (31 December 2012 est.)
$4.16 billion (31 December 2012 est.)//$3.849 billion (31 December 2011)//$5.235 billion (31 December 2010 est.)
Financial Regulation & IntegrityBack to top ↑
- Prudential Regulation & Supervision
- Financial Integrity & Illicit Finance Control
- Market Conduct & Consumer Protection
- Payment & Market Infrastructure Oversight
Financial Stability & Crisis ManagementBack to top ↑
- Macroprudential & Systemic Oversight
- Crisis Management, Resolution & Deposit Insurance
- External Liquidity & Financial Safety Nets
Sovereign Capital & External Financial PowerBack to top ↑
- Official Reserves Management
- Sovereign Wealth & Public Asset Management
- Currency Internationalisation & Reserve Status
- Capital Account & Flow Management
- International Financial Centre Capability
$6.574 billion (15 January 2014 est.)//$5.833 billion (15 July 2013 est.)
$3.956 billion (31 December 2011 est.)//$3.673 billion (31 December 2010 est.)
GINC Capability Domains · Chapter 11
Production and Innovation
🇳🇵 Nepal’s output, industry and the engine of prosperity
Economic Output & ProductivityBack to top ↑
Nepal is among the poorest and least developed countries in the world, with about one-quarter of its population living below the poverty line. Nepal is heavily dependent on remittances, which amount to as much as 22-25% of GDP. Agriculture is the mainstay of the economy, providing a livelihood for more than 70% of the population and accounting for a little over one-third of GDP. Industrial activity mainly involves the processing of agricultural products, including pulses, jute, sugarcane, tobacco, and grain. Nepal has considerable scope for exploiting its potential in hydropower, with an estimated 42,000 MW of commercially feasible capacity, but political uncertainty and a difficult business climate have hampered foreign investment. Additional challenges to Nepal's growth include its landlocked geographic location, persistent power shortages, underdeveloped transportation infrastructure, civil strife and labor unrest, and its susceptibility to natural disaster. The lack of political consensus in the past several years has delayed national budgets and prevented much-needed economic reform, although the government passed a full budget in 2013.
$42.06 billion (2013 est.)//$40.57 billion (2012 est.)//$38.7 billion (2011 est.)
3.6% (2013 est.)//4.9% (2012 est.)//3.4% (2011 est.)
$1,500 (2013 est.)//$1,500 (2012 est.)//$1,400 (2011 est.)
$19.34 billion (2013 est.)
Labour & EmploymentBack to top ↑
- Employment & Labour Force Participation
- Labour Market Institutions & Wage Setting
- Employment Services & Skills Matching
- Labour Adjustment, Transition & Formalisation
16 million
46% (2008 est.)//42% (2004 est.)
Industrial & Sectoral BaseBack to top ↑
- Manufacturing & Advanced Industry
- Foundational & Process Industries
- Agrifood & Primary Production
- Services Economy
pulses, rice, corn, wheat, sugarcane, jute, root crops; milk, water buffalo meat
tourism, carpets, textiles; small rice, jute, sugar, and oilseed mills; cigarettes, cement and brick production
1.5% (2013 est.)
Structural Transformation & ComplexityBack to top ↑
Business Dynamism & EntrepreneurshipBack to top ↑
- Entrepreneurship & Firm Creation
- Risk Capital & Scale-Up Finance
- Firm Growth, Exit & Renewal
- Competition & Market Contestability
Innovation & CommercialisationBack to top ↑
- Business Innovation Capability
- Research Commercialisation & Knowledge Transfer
- Intellectual Property & Intangible Assets
- Innovation Ecosystems & Clusters
Technology Adoption & DiffusionBack to top ↑
GINC Capability Domains · Chapter 12
Trade and Investment
🇳🇵 Nepal’s markets, capital and the terms of global exchange
Overall tradeBack to top ↑
$1.24B of exports to 111 partners and $10.3B of imports from 80 in 2024, a deficit of $9.05B.
- Exports
- $1.24B111 partners
- Imports
- $10.3B80 partners
- Balance
- −$9.05Bdeficit
- Total trade
- $11.5B2024
ExportsBack to top ↑
Where its exports go
The largest partners in 2024, with each one's share of the nation's exports.
| Partner | Value | Share | |
|---|---|---|---|
| India | $868M | 70% | |
| United States | $126M | 10% | |
| Germany | $35.2M | 2.8% | |
| China | $27.4M | 2.2% | |
| France | $22.0M | 1.8% | |
| United Kingdom | $21.3M | 1.7% | |
| Japan | $15.9M | 1.3% | |
| Australia | $13.0M | 1.1% | |
| Canada | $11.3M | 0.9% | |
| Switzerland | $10.7M | 0.9% | |
| Italy | $9.06M | 0.7% | |
| Turkey | $7.12M | 0.6% | |
| South Korea | $6.70M | 0.5% | |
| Netherlands | $6.65M | 0.5% | |
| Hong Kong | $5.50M | 0.4% | |
| Denmark | $5.49M | 0.4% | |
| Pakistan | $4.27M | 0.3% | |
| Austria | $4.23M | 0.3% | |
| Singapore | $3.99M | 0.3% | |
| Belgium | $3.17M | 0.3% |
What it exports
The largest categories in 2024.
| Category | Value | Share | |
|---|---|---|---|
| Animal, vegetable fats and oils, cleavage products | $156M | 13% | |
| Coffee, tea, mate and spices | $106M | 8.5% | |
| Iron and steel | $101M | 8.2% | |
| Carpets and other textile floor coverings | $98.0M | 7.9% | |
| Manmade staple fibers | $91.6M | 7.4% | |
| Wood and articles of wood, wood charcoal | $74.4M | 6.0% | |
| Beverages, spirits and vinegar | $63.4M | 5.1% | |
| Residues, wastes of food industry, animal fodder | $48.7M | 3.9% | |
| Articles of apparel, not knit or crocheted | $46.6M | 3.8% | |
| Other made textile articles, sets, worn clothing | $45.9M | 3.7% | |
| Vegetable textile fibers not specified elsewhere, paper yarn, woven fabric | $38.0M | 3.1% | |
| Articles of apparel, knit or crocheted | $37.5M | 3.0% | |
| Plastics | $32.8M | 2.6% | |
| Salt, sulphur, earth, stone, plaster, lime and cement | $26.4M | 2.1% | |
| Vegetable plaiting materials, vegetable products | $25.7M | 2.1% |
ImportsBack to top ↑
Where its imports come from
The largest partners in 2024, with each one's share of the nation's imports.
| Partner | Value | Share | |
|---|---|---|---|
| India | $6.95B | 68% | |
| China | $2.16B | 21% | |
| Singapore | $242M | 2.3% | |
| Australia | $100M | 1.0% | |
| United States | $94.1M | 0.9% | |
| Hong Kong | $76.5M | 0.7% | |
| France | $61.7M | 0.6% | |
| Israel | $49.7M | 0.5% | |
| South Korea | $46.1M | 0.4% | |
| Thailand | $41.6M | 0.4% | |
| Canada | $37.8M | 0.4% | |
| Turkey | $37.2M | 0.4% | |
| Germany | $36.5M | 0.4% | |
| Malaysia | $35.4M | 0.3% | |
| Ukraine | $30.5M | 0.3% | |
| Netherlands | $26.6M | 0.3% | |
| Belgium | $24.6M | 0.2% | |
| Indonesia | $23.7M | 0.2% | |
| Italy | $23.4M | 0.2% | |
| Brunei | $20.2M | 0.2% |
What it imports
The largest categories in 2024.
| Category | Value | Share | |
|---|---|---|---|
| Mineral fuels, oils, distillation products | $2.20B | 21% | |
| Machinery, nuclear reactors, boilers | $825M | 8.0% | |
| Electrical, electronic equipment | $761M | 7.4% | |
| Iron and steel | $721M | 7.0% | |
| Vehicles other than railway, tramway | $652M | 6.3% | |
| Plastics | $395M | 3.8% | |
| Cereals | $317M | 3.1% | |
| Pharmaceutical products | $297M | 2.9% | |
| Edible vegetables and certain roots and tubers | $211M | 2.0% | |
| Optical, photo, technical, medical apparatus | $186M | 1.8% | |
| Residues, wastes of food industry, animal fodder | $169M | 1.6% | |
| Articles of apparel, knit or crocheted | $167M | 1.6% | |
| Articles of iron or steel | $155M | 1.5% | |
| Oil seed, oleaginous fruits, grain, seed, fruits | $155M | 1.5% | |
| Edible fruits, nuts, peel of citrus fruit, melons | $153M | 1.5% |
In a list, the bar runs to the largest in that list. The line is each figure’s history from 2000, drawn to its own peak: it shows the shape of the years, and the value shows the size.
External balanceBack to top ↑
$648 million (2013 est.)//$283.9 million (2012 est.)
Trade Facilitation & LogisticsBack to top ↑
Trade Policy & Market AccessBack to top ↑
- Trade Policy & Negotiation Capability
- Market Access & Agreements Network
- Trade Law & Enforcement
- Standards, Conformity & Quality Infrastructure
Digital & Services TradeBack to top ↑
- Services Trade Capability
- Digital Trade & E-Commerce
- Data Flows & Digital Trade Governance
- Tourism & Visitor Economy
Investment Attraction & ProjectionBack to top ↑
- Investment Attraction & Facilitation
- Investment Absorption & Linkages
- Outward Investment & Global Corporate Presence
$103 million
$NA
Export Capability & SophisticationBack to top ↑
$1.06 billion (2013 est.)//$1.004 billion (2012 est.)
India 93.9%, Bangladesh 4%, Italy 0.4% (2013 est.)
clothing, pulses, carpets, textiles, juice, pashima, jute goods
Global Value Chain PositionBack to top ↑
- Value Chain Participation & Integration
- Value Chain Position & Upgrading
- Regional Integration & Hub Anchoring
Economic Leverage & DependenceBack to top ↑
- Strategic Supply Security
- Concentration Risk & Revenue Stabilisation
- Economic Leverage & Coercion Resistance
$6.329 billion (2013 est.)//$5.951 billion (2012 est.)
India 79.4%, South Korea 3.1%, China 2.5% (2013 est.)
petroleum products, machinery and equipment, gold, electrical goods, medicine
Nepal · you are in
Historical Context
Foundations
GINC Capability Domains
Find in this brief · Nepal