
Rwanda
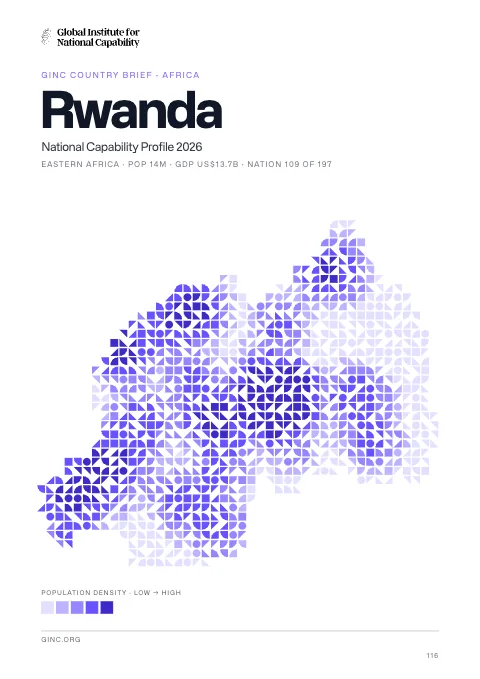
Rwanda is a landlocked republic in Africa, home to 12 million people, with its capital at Kigali.
Contents
12 chapters
Foundations
01–03
At a glance
- Area
- 26.3Kkm²#148 World#47 Africa
- Population
- 12.3M#73 World#25 Africa
- GDP (market)
- $7.7B
- GDP (PPP)
- $16.4B#141 World#32 Africa
- GDP per capita
- $1.5K#205 World#36 Africa
The whole brief
Rwanda National Capability Profile 2026
Foundations · Chapter 01
Historical Context
🇷🇼 Rwanda’s understanding the origins and evolution of the modern nation
BackgroundBack to top ↑
In 1959, three years before independence from Belgium, the majority ethnic group, the Hutus, overthrew the ruling Tutsi king. Over the next several years, thousands of Tutsis were killed, and some 150,000 driven into exile in neighboring countries. The children of these exiles later formed a rebel group, the Rwandan Patriotic Front (RPF), and began a civil war in 1990. The war, along with several political and economic upheavals, exacerbated ethnic tensions, culminating in April 1994 in a state-orchestrated genocide, in which Rwandans killed up to a million of their fellow citizens, including approximately three-quarters of the Tutsi population. The genocide ended later that same year when the predominantly Tutsi RPF, operating out of Uganda and northern Rwanda, defeated the national army and Hutu militias, and established an RPF-led government of national unity. Approximately 2 million Hutu refugees - many fearing Tutsi retribution - fled to neighboring Burundi, Tanzania, Uganda, and former Zaire. Since then, most of the refugees have returned to Rwanda, but several thousand remained in the neighboring Democratic Republic of the Congo (DRC, the former Zaire) and formed an extremist insurgency bent on retaking Rwanda, much as the RPF did in 1990. Rwanda held its first local elections in 1999 and its first post-genocide presidential and legislative elections in 2003. Rwanda in 2009 staged a joint military operation with the Congolese Army in DRC to rout out the Hutu extremist insurgency there, and Kigali and Kinshasa restored diplomatic relations. Rwanda also joined the Commonwealth in late 2009. In January 2013, Rwanda assumed a nonpermanent seat on the UN Security Council for the 2013-14 term.
IndependenceBack to top ↑
1 July 1962 (from Belgium-administered UN trusteeship)
National holidayBack to top ↑
Independence Day, 1 July (1962)
Foundations · Chapter 02
Geography
🇷🇼 Rwanda’s territory, resources and strategic position
Location and areaBack to top ↑
Central Africa, east of Democratic Republic of the Congo
2 00 S, 30 00 E
Africa
slightly smaller than Maryland
0 km (landlocked)
none (landlocked)
Terrain and resourcesBack to top ↑
mostly grassy uplands and hills; relief is mountainous with altitude declining from west to east
gold, cassiterite (tin ore), wolframite (tungsten ore), methane, hydropower, arable land
96.25 sq km (2007)
Settlement and hazardsBack to top ↑
periodic droughts; the volcanic Virunga mountains are in the northwest along the border with Democratic Republic of the Congo
landlocked; most of the country is savanna grassland with the population predominantly rural
OtherBack to top ↑
9.5 cu km (2011)
deforestation results from uncontrolled cutting of trees for fuel; overgrazing; soil exhaustion; soil erosion; widespread poaching
Foundations · Chapter 03
Environment
🇷🇼 Rwanda’s environmental conditions, resources and national resilience
ClimateBack to top ↑
temperate; two rainy seasons (February to April, November to January); mild in mountains with frost and snow possible
Emissions and pollutionBack to top ↑
Water, waste and foodBack to top ↑
Resources and agreementsBack to top ↑
GINC Capability Domains · Chapter 04
Critical Technology
🇷🇼 Rwanda’s technology frontiers and the pursuit of national advantage
Two counts are set side by side for 2015–2024: on the left, the papers researchers in Rwanda published; on the right, the patent families that began there and were filed in more than one country. First by capability group, then group by group with each group’s capabilities. The badge on a card is the nation’s place among all nations. Papers are from GINC Research Analytics, patent families from GINC Patents.
Research by capability group
#116 WorldPapers published, 2015–2024
Patents by capability group
International patent families, 2015–2024
No international patent families on record for 2015–2024.
Advanced Materials & ManufacturingBack to top ↑
Research
#121 WorldPapers published, 2015–2024
Patents
International patent families, 2015–2024
No international patent families on record for 2015–2024.
Energy TechnologiesBack to top ↑
Research
#106 WorldPapers published, 2015–2024
Patents
International patent families, 2015–2024
No international patent families on record for 2015–2024.
Semiconductors & Advanced ComputingBack to top ↑
Research
#136 WorldPapers published, 2015–2024
No research topic: Semiconductor Design & EDA · Advanced Semiconductor Fabrication · Semiconductor Equipment & Materials · Advanced Packaging & Heterogeneous Integration
Patents
International patent families, 2015–2024
No international patent families on record for 2015–2024.
Artificial IntelligenceBack to top ↑
Research
#111 WorldPapers published, 2015–2024
Patents
International patent families, 2015–2024
No international patent families on record for 2015–2024.
Quantum TechnologiesBack to top ↑
Connectivity, Cyber & Trust TechnologiesBack to top ↑
Research
#121 WorldPapers published, 2015–2024
Patents
International patent families, 2015–2024
No international patent families on record for 2015–2024.
Sensing, Timing & NavigationBack to top ↑
Research
#103 WorldPapers published, 2015–2024
Patents
International patent families, 2015–2024
No international patent families on record for 2015–2024.
Robotics & Autonomous SystemsBack to top ↑
Research
#123 WorldPapers published, 2015–2024
No research topic: Human-Machine Interfaces
Patents
International patent families, 2015–2024
No international patent families on record for 2015–2024.
Biotechnology & Health TechnologiesBack to top ↑
Research
#103 WorldPapers published, 2015–2024
Patents
International patent families, 2015–2024
No international patent families on record for 2015–2024.
Medicine and BioTech
Clinical research and life-science invention, drawn from the same series that drive the metric pages. Each card opens the full cross-country comparison.
Space TechnologiesBack to top ↑
- Space Launch & Reusable Systems
- Advanced Propulsion & Hypersonic Systems
- Satellite & Constellation Technologies
GINC Capability Domains · Chapter 05
Strategic Infrastructure
🇷🇼 Rwanda’s energy, connectivity and the material foundations of capability
Resource InfrastructureBack to top ↑
10 bbl/day (2012 est.)
0 bbl/day (2010 est.)
0 bbl/day (2010 est.)
0 bbl (1 January 2013 est.)
0 bbl/day (2010 est.)
5,245 bbl/day (2011 est.)
0 bbl/day (2010 est.)
5,302 bbl/day (2010 est.)
0 cu m (2011 est.)
0 cu m (2010 est.)
0 cu m (2011 est.)
0 cu m (2011 est.)
56.63 billion cu m (1 January 2013 est.)
Agriculture & Food InfrastructureBack to top ↑
- Irrigation & Agricultural Water
- Livestock & Veterinary
- Fisheries & Aquaculture
- Storage, Cold Chain & Markets
Energy InfrastructureBack to top ↑
- Thermal Generation
- Nuclear Generation
- Nuclear Fuel Cycle & Radioactive Waste
- Hydropower
- Renewable Generation
- Transmission & Distribution
- System Control & Dispatch
- Storage & Fuel Supply
57,250 kW (2010 est.)
280.2 million kWh (2010 est.)
319.6 million kWh (2010 est.)
3 million kWh (2010 est.)
62 million kWh (2010 est.)
52.4% of total installed capacity (2010 est.)
0% of total installed capacity (2010 est.)
47.2% of total installed capacity (2010 est.)
0.4% of total installed capacity (2010 est.)
865,100 Mt (2011 est.)
Water, Sanitation & Waste InfrastructureBack to top ↑
- Dams, Reservoirs & Flood Defence
- Water Supply & Treatment
- Bulk Water Transfer & Desalination
- Wastewater & Sanitation
- Solid Waste & Recycling
Advanced ManufacturingBack to top ↑
- Materials & Inputs
- Chemicals & Hazardous Process Industry
- Production Systems
- Supply Chain & Ecosystem
- Workforce & Innovation
Transport InfrastructureBack to top ↑
- Seaports & Terminals
- Air Infrastructure
- Air Navigation & Traffic Management
- Inland Waterways & Ferries
- Rail Infrastructure
- Roads & Bridges
- Logistics, Multimodal & Border Infrastructure
- Postal & Parcel
7 (2013)
(Lac Kivu navigable by shallow-draft barges and native craft) (2011)
Communications & Digital InfrastructureBack to top ↑
- Subsea Cables & International Gateways
- Core & Backbone Networks
- Mobile & Wireless Networks
- Spectrum & Broadcasting
- Data Centres, Compute & Cloud
- Data Resources
- AI Tools & Applications
44,400 (2012)
5.69 million (2012)
450,000 (2009)
1,447 (2012)
.rw
Financial InfrastructureBack to top ↑
- Currency & Reserves
- Payments & Settlement Systems
- Markets, Exchanges & Depositories
- Banks, Insurers & Systemic Institutions
Social InfrastructureBack to top ↑
- Health Infrastructure
- Public Health & Laboratories
- Medical Supply & Stockpiles
- Education & Skills Infrastructure
- Research & Scientific Facilities
- Housing, Community & Social Services
- Government & Public Administration
- Cultural, Community & Recreational Infrastructure
- Justice & Corrections
- Emergency Services & Civil Protection
- Hydrometeorology & Early Warning
Space, Aerospace & Defence InfrastructureBack to top ↑
GINC Capability Domains · Chapter 06
National Security
🇷🇼 Rwanda’s force, intelligence and the defence of the nation
Disputes and terrorismBack to top ↑
Burundi and Rwanda dispute two sq km (0.8 sq mi) of Sabanerwa, a farmed area in the Rukurazi Valley where the Akanyaru/Kanyaru River shifted its course southward after heavy rains in 1965; fighting among ethnic groups - loosely associated political rebels, armed gangs, and various government forces in Great Lakes region transcending the boundaries of Burundi, Democratic Republic of the Congo (DROC), Rwanda, and Uganda - abated substantially from a decade ago due largely to UN peacekeeping, international mediation, and efforts by local governments to create civil societies; nonetheless, 57,000 Rwandan refugees still reside in 21 African states, including Zambia, Gabon, and 20,000 who fled to Burundi in 2005 and 2006 to escape drought and recriminations from traditional courts investigating the 1994 massacres; the 2005 DROC and Rwanda border verification mechanism to stem rebel actions on both sides of the border remains in place
Force Generation & MobilisationBack to top ↑
Rwanda Defense Force (RDF): Rwanda Army (Rwanda Land Force), Rwanda Air Force (Force Aerienne Rwandaise, FAR) (2013)
18 years of age for voluntary military service; no conscription; Rwandan citizenship is required, as is a 9th grade education for enlisted recruits and an A-level certificate for officer candidates; enlistment is either as contract (5-years, renewable twice) or career; retirement (for officers and senior NCOs) after 20 years of service or at 40-60 years of age (2012)
1.12% of GDP (2012)//1.19% of GDP (2011)//1.12% of GDP (2010)
Forces under arms
Active-duty strength on the Correlates of War series, which reaches back to 1816 and so carries a nation’s whole record of mobilisation rather than its present establishment. The card opens the full cross-country comparison.
Intelligence & AssessmentBack to top ↑
- Imagery & Geospatial Intelligence
- Signals & Cyber Intelligence
- Technical & Measurement Intelligence
- Open-Source & Financial Intelligence
- Human Intelligence & Counterintelligence
- All-Source Analysis & Warning
Joint Command, Projection & SustainmentBack to top ↑
- Command, Control & Communications
- Strategic Lift & Mobility
- Expeditionary & Peace Operations
- Operational Sustainment & War Reserves
- Defence Industrial Mobilisation
- CBRN Defence
Land PowerBack to top ↑
- Combined Arms Manoeuvre
- Land Fires
- Battlefield Aviation & Uncrewed Systems
- Special Operations & Irregular Warfare
Maritime PowerBack to top ↑
- Maritime Security & Constabulary
- Sea Denial & Undersea Warfare
- Sea Control
- Amphibious & Expeditionary Operations
Air PowerBack to top ↑
- Air Sovereignty & Policing
- Control of the Air
- Air Strike & Interdiction
- Airborne ISR, Early Warning & Battle Management
Strategic Strike & Missile DefenceBack to top ↑
Space OperationsBack to top ↑
Cyber & Electromagnetic OperationsBack to top ↑
Nuclear DeterrenceBack to top ↑
GINC Capability Domains · Chapter 07
Human Capital
🇷🇼 Rwanda’s population, health and the skills that sustain capability
DemographyBack to top ↑
12,337,138
2.63% (2014 est.)
34.61 births/1,000 population (2014 est.)
9.18 deaths/1,000 population (2014 est.)
4.62 children born/woman (2014 est.)
22.9
51.6% (2010/11)
Rwanda is the most densely populated country in Africa
Migration and urbanisationBack to top ↑
0.9 migrant(s)/1,000 population (2014 est.)
KIGALI (capital) 1.004 million (2011)
Welfare and equityBack to top ↑
44.9% (2011 est.)
46.8 (2000)//28.9 (1985)
DisplacementBack to top ↑
Early Childhood DevelopmentBack to top ↑
11.7% (2011)
Foundational EducationBack to top ↑
5.1% of GDP (2013)
Advanced EducationBack to top ↑
Technical & Vocational SkillsBack to top ↑
Digital & AI CompetenceBack to top ↑
Generative AI adoption
Modelled share of working-age adults using generative AI, from Microsoft telemetry scaled to each country’s 15–64 population. A measure of how fast a workforce is absorbing the technology rather than of how much of it a nation builds. The card opens the full cross-country comparison.
Lifelong Learning & ReskillingBack to top ↑
Research Talent & Knowledge CreationBack to top ↑
Population HealthBack to top ↑
340 deaths/100,000 live births (2010)
4.3% (2008)
2.9% (2012 est.)
206,900 (2012 est.)
5,600 (2012 est.)
Health System CapabilityBack to top ↑
10.8% of GDP (2011)
0.06 physicians/1,000 population (2010)
1.6 beds/1,000 population (2007)
GINC Capability Domains · Chapter 08
Governance and Integrity
🇷🇼 Rwanda’s institutions, law and the integrity of the state
State structureBack to top ↑
republic; presidential, multiparty system
4 provinces (in French - provinces, singular - province; in Kinyarwanda - intara for singular and plural) and 1 city* (in French - ville; in Kinyarwanda - umujyi); Est (Eastern), Kigali*, Nord (Northern), Ouest (Western), Sud (Southern)
several previous; latest adopted by referendum 26 May 2003, effective 4 June 2003; amended several times, last in 2010 (2013)
18 years of age; universal
Political Institutions & Civic ParticipationBack to top ↑
- Electoral Management & Integrity
- Legislature & Deliberative Institutions
- Citizen Participation & Civic Space
bicameral Parliament consists of Senate (26 seats; 12 members elected by local councils, 8 appointed by the president, 4 appointed by the Political Organizations Forum, 2 represent institutions of higher learning; members to serve eight-year terms) and Chamber of Deputies (80 seats; 53 members elected by popular vote, 24 women elected by local bodies, 3 selected by youth and disability organizations; members to serve five-year terms)
Centrist Democratic Party or PDC [Agnes MUKABARANGA]//Democratic Popular Union of Rwanda or UDPR [Gonzague RWIGEMA]//Democratic Republican Movement or MDR [Celestin KABANDA] (officially banned)//Islamic Democratic Party or PDI [Musa Fazil HARERIMANA]//Liberal Party or PL [Protais MITALI]//Party for Democratic Renewal (officially banned)//Party for Progress and Concord or PPC [Alvera MUKABARAMBA]//Rwandan Patriotic Front or RPF [Paul KAGAME]//Rwandan Socialist Party or PSR [Jean Baptist RUCIBIGANGO]//Social Democratic Party or PSD [Vincent BIRUTA]//Socialist Party-Imberakuri or PS-Imberakuri [Christine MUKABUNANI]//Solidarity and Prosperity Party or PSP [Pheobe KANYANGE]
IBUKA (association of genocide survivors)
Justice System & Fundamental RightsBack to top ↑
- Judicial Independence & Court Capability
- Access to Justice & Legal Services
- Fundamental Rights Protection
- Human Rights Institutions & Equality Bodies
mixed legal system of civil law, based on German and Belgian models, and customary law; judicial review of legislative acts in the Supreme Court
has not submitted an ICJ jurisdiction declaration; non-party state to the ICCt
Internal Security & OrderBack to top ↑
Regulatory Governance & Strategic ControlsBack to top ↑
- Regulatory Quality & Better Regulation
- Regulatory Delivery & Independent Regulators
- Strategic Controls & Economic Security Administration
Government Effectiveness & Public AdministrationBack to top ↑
- Centre of Government & Policy Coordination
- Civil Service & Public Workforce
- Digital Government & Service Delivery
- Legal Identity & Civil Registration
- Statistical & Data Capability
Public Integrity & Anti-CorruptionBack to top ↑
Transparency, Oversight & AccountabilityBack to top ↑
- Right to Information & Open Government
- Independent Oversight & Supreme Audit
- Independent Media & Journalist Safety
National Resilience & Crisis ManagementBack to top ↑
GINC Capability Domains · Chapter 09
Information and Influence
🇷🇼 Rwanda’s identity, media and the projection of influence
Identity and cultureBack to top ↑
Kinyarwanda only (official, universal Bantu vernacular) 93.2%, Kinyarwanda and other language(s) 6.2%, French (official) and other language(s) 0.1%, English (official) and other language(s) 0.1%, Swahili (or Kiswahili, used in commercial centers) 0.02%, other 0.03%, unspecified 0.3% (2002 est.)
Roman Catholic 49.5%, Protestant 39.4% (includes Adventist 12.2% and other Protestant 27.2%), other Christian 4.5%, Muslim 1.8%, animist 0.1%, other 0.6%, none 3.6% (2001), unspecified 0.5% (2002 est.)
Hutu (Bantu) 84%, Tutsi (Hamitic) 15%, Twa (Pygmy) 1%
three horizontal bands of sky blue (top, double width), yellow, and green, with a golden sun with 24 rays near the fly end of the blue band; blue represents happiness and peace, yellow economic development and mineral wealth, green hope of prosperity and natural resources; the sun symbolizes unity, as well as enlightenment and transparency from ignorance
Diplomatic Statecraft & Global NetworksBack to top ↑
- Diplomatic Network & Consular Reach
- Multilateral Leadership & Norm Setting
- Agenda-Setting & Convening
- Mediation & Crisis Diplomacy
ACP, AfDB, AU, C, CEPGL, COMESA, EAC, EADB, FAO, G-77, IAEA, IBRD, ICAO, ICRM, IDA, IFAD, IFC, IFRCS, ILO, IMF, Interpol, IOC, IOM, IPU, ISO (correspondent), ITSO, ITU, ITUC (NGOs), MIGA, MINUSMA, NAM, OIF, OPCW, PCA, UN, UN Security Council (temporary), UNAMID, UNCTAD, UNESCO, UNHCR, UNIDO, UNISFA, UNMISS, UNWTO, UPU, WCO, WHO, WIPO, WMO, WTO
Alliances & Security CooperationBack to top ↑
Development Cooperation & Global AssistanceBack to top ↑
Culture, Language & Education DiplomacyBack to top ↑
- Cultural & Language Institutes
- Creative Industries & Cultural Export Reach
- Heritage & Cultural Institutions
- Education Diplomacy & Alumni Networks
- Sports & Major Events
Diaspora & Global CommunitiesBack to top ↑
Information Environment & Strategic CommunicationBack to top ↑
- Strategic Communications & Public Diplomacy
- International Media & Broadcasting
- Information Defence & Counter-Interference
government owns and operates the only TV station; government-owned and operated Radio Rwanda has a national reach; 9 private radio stations; transmissions of multiple international broadcasters are available (2007)
GINC Capability Domains · Chapter 10
Financial Strength
🇷🇼 Rwanda’s fiscal depth, reserves and the capacity to act
Monetary & Currency CapabilityBack to top ↑
- Monetary Policy & Price Stability
- Exchange Rate & External Account Management
- Currency Issuance & Digital Money
5.9% (2013 est.)//6.3% (2012 est.)
Rwandan francs (RWF) per US dollar -//633.6 (2013 est.)//616.6 (2012 est.)//583.13 (2010 est.)//568.18 (2009)//550 (2008)
7.75% (31 December 2010 est.)//11.25% (31 December 2008)
16.3% (31 December 2013 est.)//17.5% (31 December 2012 est.)
$791.6 million (31 December 2013 est.)//$671.2 million (31 December 2012 est.)
$1.445 billion (31 December 2013 est.)//$1.137 billion (31 December 2012 est.)
Fiscal Capacity & Public FinanceBack to top ↑
- Revenue Mobilisation & Tax Administration
- Public Expenditure & Budget Management
- Sovereign Debt & Treasury Management
- Public Investment Management
23.6% of GDP (2013 est.)
-4.3% of GDP (2013 est.)
23.5% of GDP (2013 est.)//21.7% of GDP (2012 est.)
calendar year
Financial System Depth & AccessBack to top ↑
- Banking System Capacity
- Capital Markets Depth & Development
- Long-Term & Institutional Capital
- Financial Inclusion & Household Access
- Development & Policy Finance
$717.3 million (31 December 2013 est.)//$557 million (31 December 2012 est.)
$NA
12.6% of GDP (2013 est.)//14.8% of GDP (2012 est.)//14.1% of GDP (2011 est.)
Financial Regulation & IntegrityBack to top ↑
- Prudential Regulation & Supervision
- Financial Integrity & Illicit Finance Control
- Market Conduct & Consumer Protection
- Payment & Market Infrastructure Oversight
Financial Stability & Crisis ManagementBack to top ↑
- Macroprudential & Systemic Oversight
- Crisis Management, Resolution & Deposit Insurance
- External Liquidity & Financial Safety Nets
Sovereign Capital & External Financial PowerBack to top ↑
- Official Reserves Management
- Sovereign Wealth & Public Asset Management
- Currency Internationalisation & Reserve Status
- Capital Account & Flow Management
- International Financial Centre Capability
$1.354 billion (31 December 2013 est.)//$847.8 million (31 December 2012 est.)
$1.656 billion (31 December 2013 est.)//$1.153 billion (31 December 2012 est.)
GINC Capability Domains · Chapter 11
Production and Innovation
🇷🇼 Rwanda’s output, industry and the engine of prosperity
Economic Output & ProductivityBack to top ↑
Rwanda is a poor rural country with about 90% of the population engaged in (mainly subsistence) agriculture and some mineral and agro-processing. Tourism, minerals, coffee and tea are Rwanda's main sources of foreign exchange. The 1994 genocide decimated Rwanda's fragile economic base, severely impoverished the population, particularly women, and temporarily stalled the country's ability to attract private and external investment. However, Rwanda has made substantial progress in stabilizing and rehabilitating its economy to pre-1994 levels. GDP has rebounded with an average annual growth of 7%-8% since 2003 and inflation has been reduced to single digits. Nonetheless, a significant percent of the population still live below the official poverty line. Despite Rwanda's fertile ecosystem, food production often does not keep pace with demand, requiring food imports. Rwanda continues to receive substantial aid money and obtained IMF-World Bank Heavily Indebted Poor Country (HIPC) initiative debt relief in 2005-06. In recognition of Rwanda's successful management of its macro economy, in 2010, the IMF graduated Rwanda to a Policy Support Instrument (PSI). Rwanda also received a Millennium Challenge Threshold Program in 2008. Africa's most densely populated country is trying to overcome the limitations of its small, landlocked economy by leveraging regional trade. Rwanda joined the East African Community and is aligning its budget, trade, and immigration policies with its regional partners. The government has embraced an expansionary fiscal policy to reduce poverty by improving education, infrastructure, and foreign and domestic investment and pursuing market-oriented reforms. Energy shortages, instability in neighboring states, and lack of adequate transportation linkages to other countries continue to handicap private sector growth. The Rwandan Government is seeking to become regional leader in information and communication technologies. In 2010, Rwanda neared completion of the first modern Special Economic Zone (SEZ) in Kigali. The SEZ seeks to attract investment in all sectors, but specifically in agribusiness, information and communications technologies, trade and logistics, mining, and construction. The global downturn hurt export demand and tourism, but economic growth has recovered, driven in large part by the services sector, but inflation has grown. On the back of this growth, government is gradually ending its fiscal stimulus policy while protecting aid to the poor.
$16.37 billion (2013 est.)//$15.23 billion (2012 est.)//$14.1 billion (2011 est.)
7.5% (2013 est.)//8% (2012 est.)//8.2% (2011 est.)
$1,500 (2013 est.)//$1,500 (2012 est.)//$1,400 (2011 est.)
$7.7 billion (2013 est.)
Labour & EmploymentBack to top ↑
- Employment & Labour Force Participation
- Labour Market Institutions & Wage Setting
- Employment Services & Skills Matching
- Labour Adjustment, Transition & Formalisation
4.446 million (2007)
NA%
Industrial & Sectoral BaseBack to top ↑
- Manufacturing & Advanced Industry
- Foundational & Process Industries
- Agrifood & Primary Production
- Services Economy
coffee, tea, pyrethrum (insecticide made from chrysanthemums), bananas, beans, sorghum, potatoes; livestock
cement, agricultural products, small-scale beverages, soap, furniture, shoes, plastic goods, textiles, cigarettes
6% (2013 est.)
Structural Transformation & ComplexityBack to top ↑
Business Dynamism & EntrepreneurshipBack to top ↑
- Entrepreneurship & Firm Creation
- Risk Capital & Scale-Up Finance
- Firm Growth, Exit & Renewal
- Competition & Market Contestability
Innovation & CommercialisationBack to top ↑
- Business Innovation Capability
- Research Commercialisation & Knowledge Transfer
- Intellectual Property & Intangible Assets
- Innovation Ecosystems & Clusters
Technology Adoption & DiffusionBack to top ↑
GINC Capability Domains · Chapter 12
Trade and Investment
🇷🇼 Rwanda’s markets, capital and the terms of global exchange
Overall tradeBack to top ↑
$580M of exports to 106 partners and $2.10B of imports from 81 in 2024, a deficit of $1.52B.
- Exports
- $580M106 partners
- Imports
- $2.10B81 partners
- Balance
- −$1.52Bdeficit
- Total trade
- $2.68B2024
ExportsBack to top ↑
Where its exports go
The largest partners in 2024, with each one's share of the nation's exports.
| Partner | Value | Share | |
|---|---|---|---|
| China | $160M | 28% | |
| Thailand | $51.3M | 8.8% | |
| Poland | $50.2M | 8.7% | |
| United Kingdom | $38.5M | 6.6% | |
| Pakistan | $33.3M | 5.7% | |
| United States | $30.3M | 5.2% | |
| Malaysia | $29.2M | 5.0% | |
| India | $25.6M | 4.4% | |
| Kenya | $24.9M | 4.3% | |
| Germany | $24.2M | 4.2% | |
| Sweden | $13.1M | 2.3% | |
| Italy | $12.7M | 2.2% | |
| Netherlands | $11.4M | 2.0% | |
| Uganda | $10.6M | 1.8% | |
| Singapore | $6.99M | 1.2% | |
| Japan | $5.85M | 1.0% | |
| Finland | $5.04M | 0.9% | |
| Turkey | $4.79M | 0.8% | |
| Belgium | $4.74M | 0.8% | |
| France | $4.60M | 0.8% |
What it exports
The largest categories in 2024.
| Category | Value | Share | |
|---|---|---|---|
| Ores slag and ash | $225M | 39% | |
| Coffee, tea, mate and spices | $156M | 27% | |
| Aircraft, spacecraft | $47.8M | 8.2% | |
| Tin | $25.2M | 4.3% | |
| Articles of apparel, not knit or crocheted | $18.5M | 3.2% | |
| Cereal, flour, starch, milk preparations and products | $13.8M | 2.4% | |
| Edible vegetables and certain roots and tubers | $13.2M | 2.3% | |
| Lead | $9.41M | 1.6% | |
| Lac, gums, resins | $7.44M | 1.3% | |
| Live trees, plants, bulbs, roots, cut flowers | $6.89M | 1.2% | |
| Electrical, electronic equipment | $5.47M | 0.9% | |
| Pearls, precious stones, metals, coins | $5.19M | 0.9% | |
| Organic chemicals | $4.30M | 0.7% | |
| Essential oils, perfumes, cosmetics, toiletries | $4.18M | 0.7% | |
| Aluminum | $3.11M | 0.5% |
ImportsBack to top ↑
Where its imports come from
The largest partners in 2024, with each one's share of the nation's imports.
| Partner | Value | Share | |
|---|---|---|---|
| China | $508M | 24% | |
| Kenya | $315M | 15% | |
| Uganda | $269M | 13% | |
| Tanzania | $164M | 7.8% | |
| India | $101M | 4.8% | |
| South Korea | $85.4M | 4.1% | |
| Belgium | $71.2M | 3.4% | |
| Germany | $70.2M | 3.3% | |
| Hong Kong | $63.4M | 3.0% | |
| Egypt | $49.0M | 2.3% | |
| South Africa | $45.9M | 2.2% | |
| United States | $38.9M | 1.9% | |
| Turkey | $35.5M | 1.7% | |
| France | $34.5M | 1.6% | |
| Netherlands | $28.4M | 1.4% | |
| United Kingdom | $20.4M | 1.0% | |
| Spain | $20.4M | 1.0% | |
| Portugal | $18.2M | 0.9% | |
| Poland | $17.2M | 0.8% | |
| Malawi | $14.3M | 0.7% |
What it imports
The largest categories in 2024.
| Category | Value | Share | |
|---|---|---|---|
| Electrical, electronic equipment | $261M | 12% | |
| Vehicles other than railway, tramway | $160M | 7.6% | |
| Machinery, nuclear reactors, boilers | $152M | 7.3% | |
| Mineral fuels, oils, distillation products | $109M | 5.2% | |
| Fish, crustaceans, molluscs, aquatics invertebrates | $93.3M | 4.4% | |
| Pharmaceutical products | $83.7M | 4.0% | |
| Plastics | $79.1M | 3.8% | |
| Sugars and sugar confectionery | $77.6M | 3.7% | |
| Cereals | $72.7M | 3.5% | |
| Optical, photo, technical, medical apparatus | $61.3M | 2.9% | |
| Beverages, spirits and vinegar | $56.0M | 2.7% | |
| Articles of iron or steel | $54.9M | 2.6% | |
| Milling products, malt, starches, inulin, wheat gluten | $47.2M | 2.3% | |
| Salt, sulphur, earth, stone, plaster, lime and cement | $46.1M | 2.2% | |
| Iron and steel | $44.1M | 2.1% |
In a list, the bar runs to the largest in that list. The line is each figure’s history from 2000, drawn to its own peak: it shows the shape of the years, and the value shows the size.
External balanceBack to top ↑
-$667.9 million (2013 est.)//-$569.2 million (2012 est.)
Trade Facilitation & LogisticsBack to top ↑
Trade Policy & Market AccessBack to top ↑
- Trade Policy & Negotiation Capability
- Market Access & Agreements Network
- Trade Law & Enforcement
- Standards, Conformity & Quality Infrastructure
Digital & Services TradeBack to top ↑
- Services Trade Capability
- Digital Trade & E-Commerce
- Data Flows & Digital Trade Governance
- Tourism & Visitor Economy
Investment Attraction & ProjectionBack to top ↑
- Investment Attraction & Facilitation
- Investment Absorption & Linkages
- Outward Investment & Global Corporate Presence
$900.1 million (31 December 2013 est.)//$743.3 million (31 December 2012 est.)
$12.9 million (31 December 2013 est.)//$12.9 million (31 December 2012 est.)
Export Capability & SophisticationBack to top ↑
$538.3 million (2013 est.)//$512 million (2012 est.)
Kenya 30.5%, Democratic Republic of the Congo 12.2%, China 12.1%, Malaysia 10.7%, US 5.8%, Swaziland 4.9% (2012)
coffee, tea, hides, tin ore
Global Value Chain PositionBack to top ↑
- Value Chain Participation & Integration
- Value Chain Position & Upgrading
- Regional Integration & Hub Anchoring
Economic Leverage & DependenceBack to top ↑
- Strategic Supply Security
- Concentration Risk & Revenue Stabilisation
- Economic Leverage & Coercion Resistance
$1.937 billion (2013 est.)//$1.871 billion (2012 est.)
Kenya 17.3%, Uganda 15.6%, UAE 8.9%, China 7.2%, India 5.6%, Tanzania 5%, Belgium 4.5%, Canada 4.1% (2012)
foodstuffs, machinery and equipment, steel, petroleum products, cement and construction material
Rwanda · you are in
Historical Context
Foundations
GINC Capability Domains
Find in this brief · Rwanda