
factbaseA referência aberta do mundo sobre
nações, capacidades e mudanças globais
197Nações
National profiles: geography, people, economy and security.
288Capacidades
Defined and rated, domain by domain.
40Mudanças globais
Where the world is moving, with the evidence for and against.
4,666Gráficos
Every metric, for every nation it covers.
O Factbase é impulsionado pelo Global Institute for National Capability (GINC).
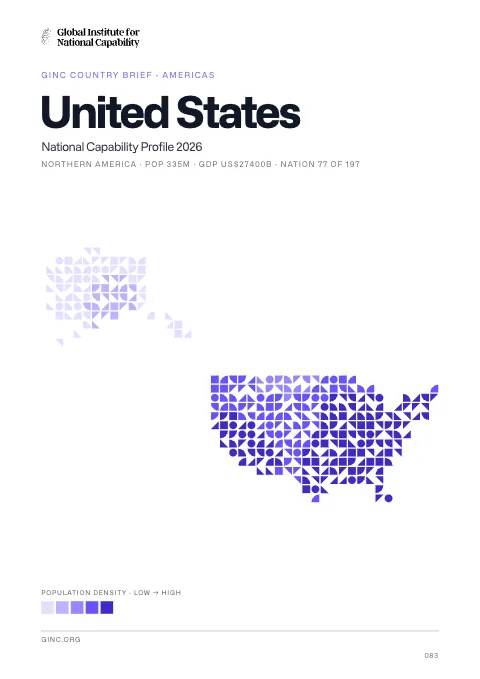
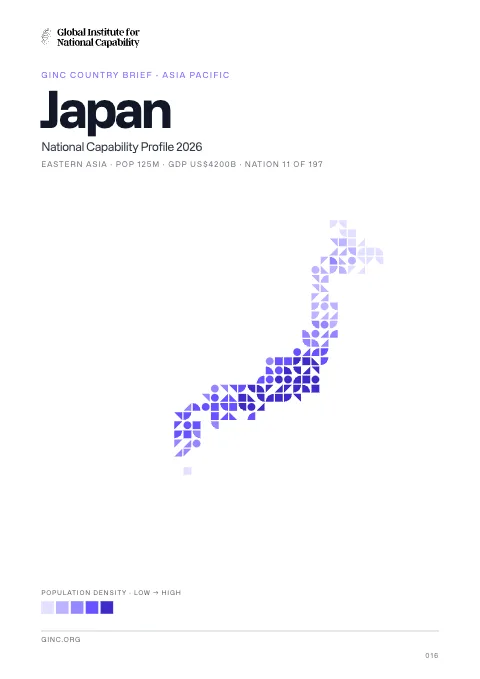
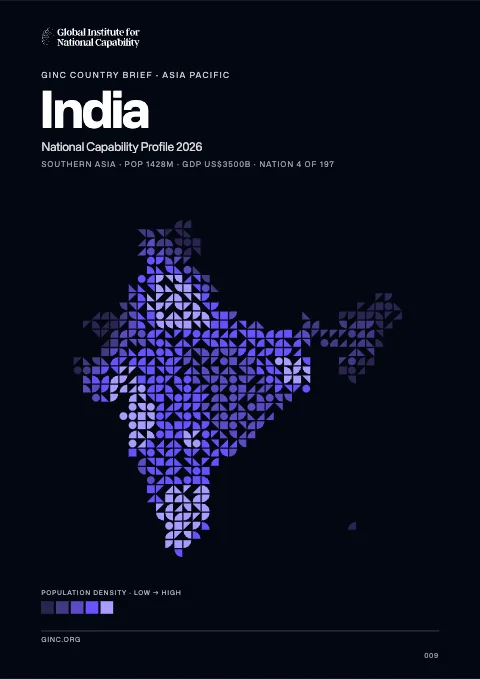
A brief on each of 197 nations
One page per nation, read from top to bottom or by chapter from the rail beside it: where the nation stands, what it can do, and how it is moving.
- Foundations: historical context, geography and environment
- Nine capability domains across hard, soft and economic power
- The GINC indices: capability ratings, trends, developments, trade and more
- A map, the headline figures and their charts, with a PDF edition where one is ready
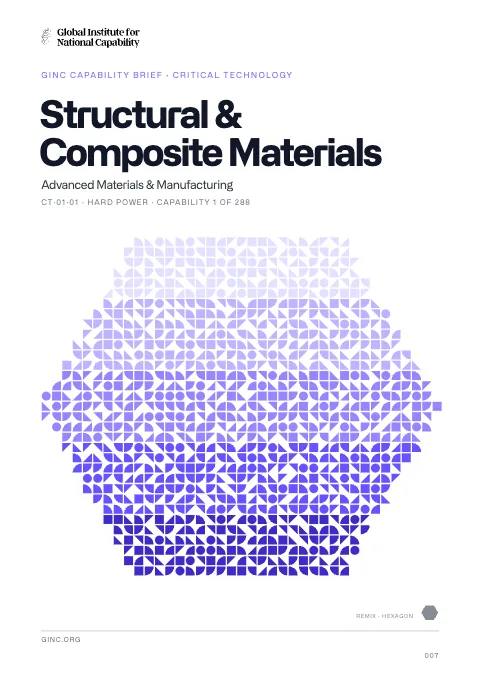
A brief on each of 288 national capabilities
Every capability in the National Capability Framework, in 73 groups and 9 domains, has a brief of its own in the same form as a nation's.
- What the capability is, and how it is measured
- Its history, and the capabilities nearest to it in the framework
- Which nations hold it, and how they are rated
- The developments and trends that bear on it
40 global shifts, with the case for and against
The movements that recur across the flagship publications of the major research institutions, each written as a shift from one condition to another and filed in one frame: five families, from who we are to what comes next, as foundations and systems.
- A headline figure and its source for every shift
- Four time series that support each shift, and two that contest it
- A direction for each: constructive, neutral or a deterioration
4,666 charts, each on a page of its own
Every one of the 50 metrics is charted for every nation it covers, and compared across all of them. Each chart has its own page, with the full series, its unit and its source.
- Embed any chart in your own page with one line of code
- Download it as a PNG or a JPG
- Share a link that opens the chart itself
GDP
Gross domestic product at current prices, in US dollars.
Source World Bank, World Development Indicators · IMF · factbase.org
Veja o que dizem sobre o Factbase
Eis a diferença que faz para profissionais, académicos, estudantes e o público em geral.
The thing I keep coming back for is the source under every figure. I can put a number in a ministerial brief and show exactly which authority published it.
One brief per nation, the same chapters in the same order for all 197. Like for like is the part nobody else gets right.
We structured a whole review on the capability framework: nine domains, 73 groups and 288 capabilities, each with a brief of its own. It replaced a spreadsheet we had been maintaining by hand for four years, and it is better than ours was.
Every Global Shift comes with four charts that support it and two that contest it. It is the first place I have found that shows the case against its own argument, which is exactly what an essay needs.
The trade chapter shows where a nation’s exports go and what they are made of in one diagram. I embed the charts straight into our notes, source line and all.
I set the 40 Global Shifts as a seminar exercise: pick one, then argue from its two contesting charts. Students fill the hour without me, which is exactly what I wanted.
Papers and patent families for each capability, with the ten nations that lead it. I knew who was ahead in batteries, and that the answer differs for research and for patents, before the kettle boiled.
A nation’s brief is laid out by capability group, and the groups line up with how we are organised internally. That sounds small. It saves a translation step on every piece of analysis we publish.
Clean, fast, and it cites everything. Every chart has a page of its own that I can link to or download as an image.
I came for one country and lost an hour. No paywall, no sign-up, and I could read it in my own language.
Tem perguntas?
Temos respostas
O que é o Factbase?
Um índice aberto de capacidade soberana. Classifica 196 nações em nove domínios de capacidades — abrangendo o poder duro, suave e económico — e decompõe esses domínios em mais de 250 capacidades medidas individualmente, para que as forças e as lacunas de uma nação possam ser comparadas em pé de igualdade.
Como são classificadas as nações?
Cada capacidade é pontuada numa escala comum e comparada com a de todas as outras nações, sendo depois agregada num nível por domínio — de T1 (fronteira) para baixo. As colunas Fronteiras contam quantos resultados T1, T2 e T3 uma nação detém, o que determina a classificação principal.
Quais são os nove domínios de capacidades?
Tecnologia Crítica, Infraestrutura Estratégica e Segurança Nacional no poder duro; Capital Humano, Informação e Influência e Governação e Integridade no poder suave; e Solidez Financeira, Produção e Inovação e Investimento e Comércio no poder económico.
De onde vêm os dados?
Apenas de fontes primárias: institutos nacionais de estatística, ministérios e as autoridades internacionais que os originam (ONU, FMI, Banco Mundial, OIT, FAO, UIT, ACNUR, SIPRI, IISS e outras). Cada campo do perfil de uma nação tem a sua própria linha de fonte, pelo que qualquer número pode ser rastreado até ao organismo que o publicou.
Posso levar as classificações para as minhas próprias ferramentas?
Sim. Os dados subjacentes são publicados em JSON juntamente com o sítio, e o conector MCP do GINC permite consultar o índice a partir do seu próprio LLM em linguagem corrente, com perguntas sobre a capacidade soberana de nações, domínios e capacidades individuais.
Com que frequência é atualizado o índice?
As classificações principais são publicadas anualmente, sendo a edição de 2026 a atual. Os indicadores subjacentes são atualizados à medida que as respetivas fontes publicam novos números, e o perfil de cada nação mostra o ano associado a cada valor.