
Japan
Japan is a parliamentary government with a constitutional monarchy in East and Southeast Asia, home to 127 million people, with its capital at Tokyo.
Contents
12 chapters
Foundations
01–03
At a glance
- Area
- 377.9Kkm²#62 World#6 E & SE Asia
- Population
- 127.1M#10 World#2 E & SE Asia
- GDP (market)
- $5T
- GDP (PPP)
- $4.7T#4 World#1 E & SE Asia
- GDP per capita
- $37.1K#36 World#6 E & SE Asia
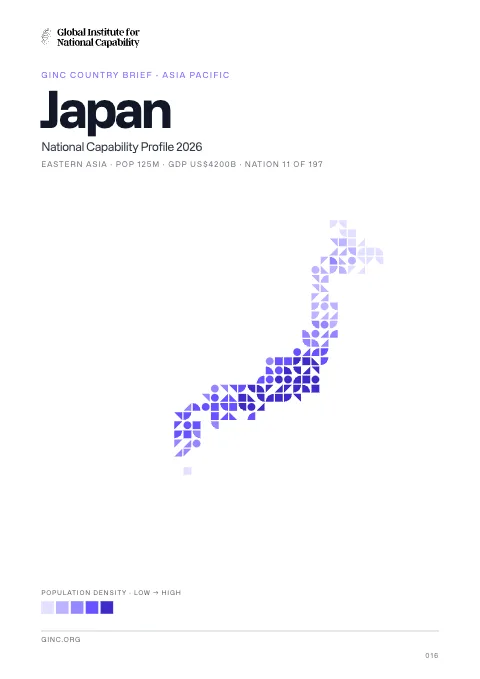
The whole brief
Japan National Capability Profile 2026
Foundations · Chapter 01
Historical Context
🇯🇵 Japan’s understanding the origins and evolution of the modern nation
BackgroundBack to top ↑
In 1603, after decades of civil warfare, the Tokugawa shogunate (a military-led, dynastic government) ushered in a long period of relative political stability and isolation from foreign influence. For more than two centuries this policy enabled Japan to enjoy a flowering of its indigenous culture. Japan opened its ports after signing the Treaty of Kanagawa with the US in 1854 and began to intensively modernize and industrialize. During the late 19th and early 20th centuries, Japan became a regional power that was able to defeat the forces of both China and Russia. It occupied Korea, Formosa (Taiwan), and southern Sakhalin Island. In 1931-32 Japan occupied Manchuria, and in 1937 it launched a full-scale invasion of China. Japan attacked US forces in 1941 - triggering America's entry into World War II - and soon occupied much of East and Southeast Asia. After its defeat in World War II, Japan recovered to become an economic power and an ally of the US. While the emperor retains his throne as a symbol of national unity, elected politicians hold actual decision-making power. Following three decades of unprecedented growth, Japan's economy experienced a major slowdown starting in the 1990s, but the country remains a major economic power. In March 2011, Japan's strongest-ever earthquake, and an accompanying tsunami, devastated the northeast part of Honshu island, killing thousands and damaging several nuclear power plants. The catastrophe hobbled the country's economy and its energy infrastructure, and tested its ability to deal with humanitarian disasters.
IndependenceBack to top ↑
3 May 1947 (current constitution adopted as amendment to Meiji Constitution); notable earlier dates: 660 B.C. (traditional date of the founding of the nation by Emperor JIMMU); 29 November 1890 (Meiji Constitution provides for constitutional monarchy)
National holidayBack to top ↑
Birthday of Emperor AKIHITO, 23 December (1933)
Foundations · Chapter 02
Geography
🇯🇵 Japan’s territory, resources and strategic position
Location and areaBack to top ↑
Eastern Asia, island chain between the North Pacific Ocean and the Sea of Japan, east of the Korean Peninsula
36 00 N, 138 00 E
Asia
slightly smaller than California
0 km
29,751 km
Terrain and resourcesBack to top ↑
mostly rugged and mountainous
negligible mineral resources, fish
25,000 sq km (2010)
Settlement and hazardsBack to top ↑
many dormant and some active volcanoes; about 1,500 seismic occurrences (mostly tremors but occasional severe earthquakes) every year; tsunamis; typhoons
strategic location in northeast Asia
OtherBack to top ↑
430 cu km (2011)
air pollution from power plant emissions results in acid rain; acidification of lakes and reservoirs degrading water quality and threatening aquatic life; Japan is one of the largest consumers of fish and tropical timber, contributing to the depletion of these resources in Asia and elsewhere
Foundations · Chapter 03
Environment
🇯🇵 Japan’s environmental conditions, resources and national resilience
ClimateBack to top ↑
varies from tropical in south to cool temperate in north
Emissions and pollutionBack to top ↑
Water, waste and foodBack to top ↑
Resources and agreementsBack to top ↑
GINC Capability Domains · Chapter 04
Critical Technology
🇯🇵 Japan’s technology frontiers and the pursuit of national advantage
Two counts are set side by side for 2015–2024: on the left, the papers researchers in Japan published; on the right, the patent families that began there and were filed in more than one country. First by capability group, then group by group with each group’s capabilities. The badge on a card is the nation’s place among all nations. Papers are from GINC Research Analytics, patent families from GINC Patents.
Research by capability group
#6 WorldPapers published, 2015–2024
16,875
14,411
11,147
9,296
5,729
5,640
4,358
4,046
3,522
286
Patents by capability group
#2 WorldInternational patent families, 2015–2024
78,404
54,788
43,724
43,285
36,506
35,596
21,947
16,229
1,310
1,016
Advanced Materials & ManufacturingBack to top ↑
Research
#6 WorldPapers published, 2015–2024
Patents
#1 WorldInternational patent families, 2015–2024
Energy TechnologiesBack to top ↑
Research
#6 WorldPapers published, 2015–2024
Patents
#1 WorldInternational patent families, 2015–2024
Semiconductors & Advanced ComputingBack to top ↑
Research
#3 WorldPapers published, 2015–2024
No research topic: Semiconductor Design & EDA · Advanced Semiconductor Fabrication · Semiconductor Equipment & Materials · Advanced Packaging & Heterogeneous Integration
Patents
#1 WorldInternational patent families, 2015–2024
Artificial IntelligenceBack to top ↑
Research
#9 WorldPapers published, 2015–2024
Patents
#3 WorldInternational patent families, 2015–2024
Quantum TechnologiesBack to top ↑
Research
#6 WorldPapers published, 2015–2024
Patents
#2 WorldInternational patent families, 2015–2024
Connectivity, Cyber & Trust TechnologiesBack to top ↑
Research
#5 WorldPapers published, 2015–2024
Patents
#3 WorldInternational patent families, 2015–2024
Sensing, Timing & NavigationBack to top ↑
Research
#7 WorldPapers published, 2015–2024
Patents
#1 WorldInternational patent families, 2015–2024
Robotics & Autonomous SystemsBack to top ↑
Research
#3 WorldPapers published, 2015–2024
No research topic: Human-Machine Interfaces
Patents
#1 WorldInternational patent families, 2015–2024
Biotechnology & Health TechnologiesBack to top ↑
Research
#10 WorldPapers published, 2015–2024
Patents
#3 WorldInternational patent families, 2015–2024
Medicine and BioTech
Clinical research and life-science invention, drawn from the same series that drive the metric pages. Each card opens the full cross-country comparison.
Space TechnologiesBack to top ↑
Research
#7 WorldPapers published, 2015–2024
Patents
#3 WorldInternational patent families, 2015–2024
GINC Capability Domains · Chapter 05
Strategic Infrastructure
🇯🇵 Japan’s energy, connectivity and the material foundations of capability
Resource InfrastructureBack to top ↑
135,500 bbl/day (2012 est.)
0 bbl/day (2010 est.)
3.472 million bbl/day (2010 est.)
44.12 million bbl (1 January 2013 est.)
3.862 million bbl/day (2010 est.)
4.464 million bbl/day (2011 est.)
349,900 bbl/day (2010 est.)
1.311 million bbl/day (2010 est.)
3.273 billion cu m (2012 est.)
112.6 billion cu m (2011 est.)
0 cu m (2012 est.)
122.2 billion cu m (2012 est.)
20.9 billion cu m (1 January 2013 est.)
gas 4,456 km; oil 174 km; oil/gas/water 104 km (2013)
Agriculture & Food InfrastructureBack to top ↑
- Irrigation & Agricultural Water
- Livestock & Veterinary
- Fisheries & Aquaculture
- Storage, Cold Chain & Markets
Energy InfrastructureBack to top ↑
- Thermal Generation
- Nuclear Generation
- Nuclear Fuel Cycle & Radioactive Waste
- Hydropower
- Renewable Generation
- Transmission & Distribution
- System Control & Dispatch
- Storage & Fuel Supply
287 million kW (2010 est.)
936.2 billion kWh (2012 est.)
859.7 billion kWh (2012 est.)
0 kWh (2012 est.)
0 kWh (2012 est.)
63.5% of total installed capacity (2010 est.)
17.1% of total installed capacity (2010 est.)
7.8% of total installed capacity (2010 est.)
2.8% of total installed capacity (2010 est.)
1.181 billion Mt (2011 est.)
Water, Sanitation & Waste InfrastructureBack to top ↑
- Dams, Reservoirs & Flood Defence
- Water Supply & Treatment
- Bulk Water Transfer & Desalination
- Wastewater & Sanitation
- Solid Waste & Recycling
Advanced ManufacturingBack to top ↑
- Materials & Inputs
- Chemicals & Hazardous Process Industry
- Production Systems
- Supply Chain & Ecosystem
- Workforce & Innovation
Transport InfrastructureBack to top ↑
- Seaports & Terminals
- Air Infrastructure
- Air Navigation & Traffic Management
- Inland Waterways & Ferries
- Rail Infrastructure
- Roads & Bridges
- Logistics, Multimodal & Border Infrastructure
- Postal & Parcel
175 (2013)
16 (2013)
1,770 km (seagoing vessels use inland seas) (2010)
Communications & Digital InfrastructureBack to top ↑
- Subsea Cables & International Gateways
- Core & Backbone Networks
- Mobile & Wireless Networks
- Spectrum & Broadcasting
- Data Centres, Compute & Cloud
- Data Resources
- AI Tools & Applications
64.273 million (2012)
138.363 million (2011)
99.182 million (2009)
64.453 million (2012)
.jp
Financial InfrastructureBack to top ↑
- Currency & Reserves
- Payments & Settlement Systems
- Markets, Exchanges & Depositories
- Banks, Insurers & Systemic Institutions
Social InfrastructureBack to top ↑
- Health Infrastructure
- Public Health & Laboratories
- Medical Supply & Stockpiles
- Education & Skills Infrastructure
- Research & Scientific Facilities
- Housing, Community & Social Services
- Government & Public Administration
- Cultural, Community & Recreational Infrastructure
- Justice & Corrections
- Emergency Services & Civil Protection
- Hydrometeorology & Early Warning
Space, Aerospace & Defence InfrastructureBack to top ↑
GINC Capability Domains · Chapter 06
National Security
🇯🇵 Japan’s force, intelligence and the defence of the nation
Disputes and terrorismBack to top ↑
the sovereignty dispute over the islands of Etorofu, Kunashiri, and Shikotan, and the Habomai group, known in Japan as the "Northern Territories" and in Russia as the "Southern Kuril Islands," occupied by the Soviet Union in 1945, now administered by Russia and claimed by Japan, remains the primary sticking point to signing a peace treaty formally ending World War II hostilities; Japan and South Korea claim Liancourt Rocks (Take-shima/Tok-do) occupied by South Korea since 1954; China and Taiwan dispute both Japan's claims to the uninhabited islands of the Senkaku-shoto (Diaoyu Tai) and Japan's unilaterally declared exclusive economic zone in the East China Sea, the site of intensive hydrocarbon prospecting
Force Generation & MobilisationBack to top ↑
Japanese Ministry of Defense (MOD): Ground Self-Defense Force (Rikujou Jieitai, GSDF); Maritime Self-Defense Force (Kaijou Jieitai, MSDF); Air Self-Defense Force (Koukuu Jieitai, ASDF) (2011)
18 years of age for voluntary military service; no conscription; mandatory retirement at age 53 for senior enlisted personnel and at 62 years for senior service officers (2012)
0.99% of GDP (2012)//1.01% of GDP (2011)//0.99% of GDP (2010)
Forces under arms
Active-duty strength on the Correlates of War series, which reaches back to 1816 and so carries a nation’s whole record of mobilisation rather than its present establishment. The card opens the full cross-country comparison.
Intelligence & AssessmentBack to top ↑
- Imagery & Geospatial Intelligence
- Signals & Cyber Intelligence
- Technical & Measurement Intelligence
- Open-Source & Financial Intelligence
- Human Intelligence & Counterintelligence
- All-Source Analysis & Warning
Joint Command, Projection & SustainmentBack to top ↑
- Command, Control & Communications
- Strategic Lift & Mobility
- Expeditionary & Peace Operations
- Operational Sustainment & War Reserves
- Defence Industrial Mobilisation
- CBRN Defence
Land PowerBack to top ↑
- Combined Arms Manoeuvre
- Land Fires
- Battlefield Aviation & Uncrewed Systems
- Special Operations & Irregular Warfare
Maritime PowerBack to top ↑
- Maritime Security & Constabulary
- Sea Denial & Undersea Warfare
- Sea Control
- Amphibious & Expeditionary Operations
Air PowerBack to top ↑
- Air Sovereignty & Policing
- Control of the Air
- Air Strike & Interdiction
- Airborne ISR, Early Warning & Battle Management
Strategic Strike & Missile DefenceBack to top ↑
Space OperationsBack to top ↑
Cyber & Electromagnetic OperationsBack to top ↑
Nuclear DeterrenceBack to top ↑
GINC Capability Domains · Chapter 07
Human Capital
🇯🇵 Japan’s population, health and the skills that sustain capability
DemographyBack to top ↑
127,103,388 (July 2014 est.)
-0.13% (2014 est.)
8.07 births/1,000 population (2014 est.)
9.38 deaths/1,000 population (2014 est.)
1.4 children born/woman (2014 est.)
30.3 (2012 est.)
54.3%
Migration and urbanisationBack to top ↑
0 migrant(s)/1,000 population (2014 est.)
TOKYO (capital) 37.217 million; Osaka-Kobe 11.494 million; Nagoya 3.328 million; Fukuoka-Kitakyushu 2.868 million; Sapporo 2.742 million; Sendai 2.428 million (2011)
Welfare and equityBack to top ↑
16% (2010)
37.6 (2008)//24.9 (1993)
Early Childhood DevelopmentBack to top ↑
Foundational EducationBack to top ↑
3.8% of GDP (2011)
Advanced EducationBack to top ↑
Technical & Vocational SkillsBack to top ↑
Digital & AI CompetenceBack to top ↑
Generative AI adoption
Modelled share of working-age adults using generative AI, from Microsoft telemetry scaled to each country’s 15–64 population. A measure of how fast a workforce is absorbing the technology rather than of how much of it a nation builds. The card opens the full cross-country comparison.
Lifelong Learning & ReskillingBack to top ↑
Research Talent & Knowledge CreationBack to top ↑
Population HealthBack to top ↑
5 deaths/100,000 live births (2010)
5% (2008)
less than 0.1% (2009 est.)
8,100 (2009 est.)
fewer than 100 (2009 est.)
Health System CapabilityBack to top ↑
9.3% of GDP (2011)
2.14 physicians/1,000 population (2008)
13.7 beds/1,000 population (2009)
GINC Capability Domains · Chapter 08
Governance and Integrity
🇯🇵 Japan’s institutions, law and the integrity of the state
State structureBack to top ↑
a parliamentary government with a constitutional monarchy
47 prefectures; Aichi, Akita, Aomori, Chiba, Ehime, Fukui, Fukuoka, Fukushima, Gifu, Gunma, Hiroshima, Hokkaido, Hyogo, Ibaraki, Ishikawa, Iwate, Kagawa, Kagoshima, Kanagawa, Kochi, Kumamoto, Kyoto, Mie, Miyagi, Miyazaki, Nagano, Nagasaki, Nara, Niigata, Oita, Okayama, Okinawa, Osaka, Saga, Saitama, Shiga, Shimane, Shizuoka, Tochigi, Tokushima, Tokyo, Tottori, Toyama, Wakayama, Yamagata, Yamaguchi, Yamanashi
previous 1890; latest approved 6 October 1946, adopted 3 November 1946, effective 3 May 1947 (2013)
20 years of age; universal
Political Institutions & Civic ParticipationBack to top ↑
- Electoral Management & Integrity
- Legislature & Deliberative Institutions
- Citizen Participation & Civic Space
bicameral Diet or Kokkai consists of the House of Councillors or Sangi-in (242 seats - members elected for fixed six-year terms; 146 members in multi-seat constituencies and 96 by proportional representation) half elected every three years; and the House of Representatives or Shugi-in (480 seats - members elected for maximum four-year terms; 300 in single-seat constituencies; 180 members by proportional representation in 11 regional blocs); the prime minister has the right to dissolve the House of Representatives at any time with the concurrence of the cabinet
Democratic Party of Japan or DPJ [Banri KAIEDA]//Japan Communist Party or JCP [Kazuo SHII]//Japan Restoration Party or JRP [Shintaro ISHIHARA]//Liberal Democratic Party or LDP [Shinzo ABE]//New Komeito or NK [Natsuo YAMAGUCHI]//People's Life Party or PF [Ichiro OZAWA]//Social Democratic Party or SDP [Tadatomo YOSHIDA]//Tomorrow Party of Japan or TPJ [Tomoko ABE]//Your Party or YP [Yoshimi WATANABE]
Justice System & Fundamental RightsBack to top ↑
- Judicial Independence & Court Capability
- Access to Justice & Legal Services
- Fundamental Rights Protection
- Human Rights Institutions & Equality Bodies
civil law system based on German model; system also reflects Anglo-American influence and Japanese traditions; judicial review of legislative acts in the Supreme Court
accepts compulsory ICJ jurisdiction with reservations; accepts ICCt jurisdiction
Internal Security & OrderBack to top ↑
Regulatory Governance & Strategic ControlsBack to top ↑
- Regulatory Quality & Better Regulation
- Regulatory Delivery & Independent Regulators
- Strategic Controls & Economic Security Administration
Government Effectiveness & Public AdministrationBack to top ↑
- Centre of Government & Policy Coordination
- Civil Service & Public Workforce
- Digital Government & Service Delivery
- Legal Identity & Civil Registration
- Statistical & Data Capability
Public Integrity & Anti-CorruptionBack to top ↑
Transparency, Oversight & AccountabilityBack to top ↑
- Right to Information & Open Government
- Independent Oversight & Supreme Audit
- Independent Media & Journalist Safety
National Resilience & Crisis ManagementBack to top ↑
GINC Capability Domains · Chapter 09
Information and Influence
🇯🇵 Japan’s identity, media and the projection of influence
Identity and cultureBack to top ↑
Japanese
Shintoism 83.9%, Buddhism 71.4%, Christianity 2%, other 7.8%
Japanese 98.5%, Koreans 0.5%, Chinese 0.4%, other 0.6%
red sun disc; chrysanthemum
white with a large red disk (representing the sun without rays) in the center
Diplomatic Statecraft & Global NetworksBack to top ↑
- Diplomatic Network & Consular Reach
- Multilateral Leadership & Norm Setting
- Agenda-Setting & Convening
- Mediation & Crisis Diplomacy
ADB, AfDB (nonregional member), APEC, ARF, ASEAN (dialogue partner), Australia Group, BIS, CD, CE (observer), CERN (observer), CICA (observer), CP, EAS, EBRD, EITI (implementing country), FAO, FATF, G-20, G-5, G-7, G-8, G-10, IADB, IAEA, IBRD, ICAO, ICC (national committees), ICRM, IDA, IEA, IFAD, IFC, IFRCS, IGAD (partners), IHO, ILO, IMF, IMO, IMSO, Interpol, IOC, IOM, IPU, ISO, ITSO, ITU, ITUC (NGOs), LAIA (observer), MIGA, NEA, NSG, OAS (observer), OECD, OPCW, OSCE (partner), Pacific Alliance (observer), Paris Club, PCA, PIF (partner), SAARC (observer), SELEC (observer), SICA (observer), UN, UNCTAD, UNDOF, UNESCO, UNHCR, UNIDO, UNMISS, UNRWA, UNWTO, UPU, WCO, WFTU (NGOs), WHO, WIPO, WMO, WTO, ZC
Alliances & Security CooperationBack to top ↑
Development Cooperation & Global AssistanceBack to top ↑
Culture, Language & Education DiplomacyBack to top ↑
- Cultural & Language Institutes
- Creative Industries & Cultural Export Reach
- Heritage & Cultural Institutions
- Education Diplomacy & Alumni Networks
- Sports & Major Events
Diaspora & Global CommunitiesBack to top ↑
Information Environment & Strategic CommunicationBack to top ↑
- Strategic Communications & Public Diplomacy
- International Media & Broadcasting
- Information Defence & Counter-Interference
a mixture of public and commercial broadcast TV and radio stations; 6 national terrestrial TV networks including 1 public broadcaster; the large number of radio and TV stations available provide a wide range of choices; satellite and cable services provide access to international channels (2012)
GINC Capability Domains · Chapter 10
Financial Strength
🇯🇵 Japan’s fiscal depth, reserves and the capacity to act
Monetary & Currency CapabilityBack to top ↑
- Monetary Policy & Price Stability
- Exchange Rate & External Account Management
- Currency Issuance & Digital Money
0.2% (2013 est.)//0% (2012 est.)
yen (JPY) per US dollar -//97.44 (2013 est.)//79.79 (2012 est.)//87.78 (2010 est.)//93.57 (2009)//103.58 (2008)
0.1% (31 December 2012)//0.3% (31 December 2009)
1.5% (31 December 2013 est.)//1.48% (31 December 2012 est.)
$5.604 trillion (31 December 2013 est.)//$6.176 trillion (31 December 2012 est.)
$13.12 trillion (31 December 2011 est.)//$13.41 trillion (31 December 2010 est.)
Fiscal Capacity & Public FinanceBack to top ↑
- Revenue Mobilisation & Tax Administration
- Public Expenditure & Budget Management
- Sovereign Debt & Treasury Management
- Public Investment Management
34.7% of GDP (2013 est.)
-8.2% of GDP (2013 est.)
226.1% of GDP (2013 est.)//219.1% of GDP (2012 est.)
1 April - 31 March
Financial System Depth & AccessBack to top ↑
- Banking System Capacity
- Capital Markets Depth & Development
- Long-Term & Institutional Capital
- Financial Inclusion & Household Access
- Development & Policy Finance
$12.39 trillion (31 December 2013 est.)//$13.72 trillion (31 December 2012 est.)
$3.681 trillion (31 December 2012 est.)//$3.541 trillion (31 December 2011)//$NA (31 December 2010 est.)
22.1% of GDP (2013 est.)//21.6% of GDP (2012 est.)//22% of GDP (2011 est.)
Financial Regulation & IntegrityBack to top ↑
- Prudential Regulation & Supervision
- Financial Integrity & Illicit Finance Control
- Market Conduct & Consumer Protection
- Payment & Market Infrastructure Oversight
Financial Stability & Crisis ManagementBack to top ↑
- Macroprudential & Systemic Oversight
- Crisis Management, Resolution & Deposit Insurance
- External Liquidity & Financial Safety Nets
Sovereign Capital & External Financial PowerBack to top ↑
- Official Reserves Management
- Sovereign Wealth & Public Asset Management
- Currency Internationalisation & Reserve Status
- Capital Account & Flow Management
- International Financial Centre Capability
$1.268 trillion (31 December 2012 est.)//$1.296 trillion (31 December 2011 est.)
$3.017 trillion (31 December 2012 est.)//$3.115 trillion (31 December 2011)
GINC Capability Domains · Chapter 11
Production and Innovation
🇯🇵 Japan’s output, industry and the engine of prosperity
Economic Output & ProductivityBack to top ↑
In the years following World War II, government-industry cooperation, a strong work ethic, mastery of high technology, and a comparatively small defense allocation (1% of GDP) helped Japan develop a technologically advanced economy. Two notable characteristics of the post-war economy were the close interlocking structures of manufacturers, suppliers, and distributors, known as keiretsu, and the guarantee of lifetime employment for a substantial portion of the urban labor force. Both features are now eroding under the dual pressures of global competition and domestic demographic change. Japan's industrial sector is heavily dependent on imported raw materials and fuels. A small agricultural sector is highly subsidized and protected, with crop yields among the highest in the world. While self-sufficient in rice production, Japan imports about 60% of its food on a caloric basis. For three decades, overall real economic growth had been spectacular - a 10% average in the 1960s, a 5% average in the 1970s, and a 4% average in the 1980s. Growth slowed markedly in the 1990s, averaging just 1.7%, largely because of the after effects of inefficient investment and an asset price bubble in the late 1980s that required a protracted period of time for firms to reduce excess debt, capital, and labor. Modest economic growth continued after 2000, but the economy has fallen into recession three times since 2008. A sharp downturn in business investment and global demand for Japan's exports in late 2008 pushed Japan into recession. Government stimulus spending helped the economy recover in late 2009 and 2010, but the economy contracted again in 2011 as the massive 9.0 magnitude earthquake and the ensuing tsunami in March disrupted manufacturing. The economy has largely recovered in the two years since the disaster, but reconstruction in the Tohoku region has been uneven. Prime Minister Shinzo ABE has declared the economy his government's top priority; he has overturned his predecessor's plan to permanently close nuclear power plants and is pursuing an economic revitalization agenda of fiscal stimulus, monetary easing, and structural reform. Japan joined the Trans Pacific Partnership negotiations in 2013, a pact that would open Japan's economy to increased foreign competition and create new export opportunities for Japanese businesses. Measured on a purchasing power parity (PPP) basis that adjusts for price differences, Japan in 2013 stood as the fourth-largest economy in the world after second-place China, which surpassed Japan in 2001, and third-place India, which edged out Japan in 2012. The new government will continue a longstanding debate on restructuring the economy and reining in Japan's huge government debt, which is exceeding 230% of GDP. To help raise government revenue and reduce public debt, Japan decided in 2013 to gradually increase the consumption tax to a total of 10% by the year 2015. Japan is making progress on ending deflation due to a weaker yen and higher energy costs, but reliance on exports to drive growth and an aging, shrinking population pose other major long-term challenges for the economy.
$4.729 trillion (2013 est.)//$4.638 trillion (2012 est.)//$4.549 trillion (2011 est.)
2% (2013 est.)//2% (2012 est.)//-0.6% (2011 est.)
$37,100 (2013 est.)//$36,300 (2012 est.)//$35,600 (2011 est.)
$5.007 trillion (2013 est.)
Labour & EmploymentBack to top ↑
- Employment & Labour Force Participation
- Labour Market Institutions & Wage Setting
- Employment Services & Skills Matching
- Labour Adjustment, Transition & Formalisation
65.62 million (2013 est.)
4.1% (2013 est.)//4.4% (2012 est.)
Industrial & Sectoral BaseBack to top ↑
- Manufacturing & Advanced Industry
- Foundational & Process Industries
- Agrifood & Primary Production
- Services Economy
rice, sugar beets, vegetables, fruit; pork, poultry, dairy products, eggs; fish
among world's largest and most technologically advanced producers of motor vehicles, electronic equipment, machine tools, steel and nonferrous metals, ships, chemicals, textiles, processed foods
1% (2013 est.)
Structural Transformation & ComplexityBack to top ↑
Business Dynamism & EntrepreneurshipBack to top ↑
- Entrepreneurship & Firm Creation
- Risk Capital & Scale-Up Finance
- Firm Growth, Exit & Renewal
- Competition & Market Contestability
Innovation & CommercialisationBack to top ↑
- Business Innovation Capability
- Research Commercialisation & Knowledge Transfer
- Intellectual Property & Intangible Assets
- Innovation Ecosystems & Clusters
Technology Adoption & DiffusionBack to top ↑
GINC Capability Domains · Chapter 12
Trade and Investment
🇯🇵 Japan’s markets, capital and the terms of global exchange
Overall tradeBack to top ↑
$759B of exports to 211 partners and $721B of imports from 210 in 2024, a surplus of $37.9B.
- Exports
- $759B211 partners
- Imports
- $721B210 partners
- Balance
- +$37.9Bsurplus
- Total trade
- $1.48T2024
ExportsBack to top ↑
Where its exports go
The largest partners in 2024, with each one's share of the nation's exports.
| Partner | Value | Share | |
|---|---|---|---|
| United States | $144B | 19% | |
| China | $138B | 18% | |
| South Korea | $46.8B | 6.2% | |
| Taiwan | $45.3B | 6.0% | |
| Hong Kong | $34.9B | 4.6% | |
| Thailand | $26.6B | 3.5% | |
| Germany | $21.8B | 2.9% | |
| Singapore | $19.5B | 2.6% | |
| India | $18.6B | 2.5% | |
| Australia | $17.1B | 2.3% | |
| Mexico | $16.1B | 2.1% | |
| Vietnam | $15.9B | 2.1% | |
| Malaysia | $14.8B | 2.0% | |
| Canada | $14.6B | 1.9% | |
| Indonesia | $14.2B | 1.9% | |
| United Kingdom | $13.1B | 1.7% | |
| Philippines | $10.5B | 1.4% | |
| France | $9.10B | 1.2% | |
| United Arab Emirates | $8.41B | 1.1% | |
| Belgium | $8.33B | 1.1% |
What it exports
The largest categories in 2024.
| Category | Value | Share | |
|---|---|---|---|
| Vehicles other than railway, tramway | $165B | 22% | |
| Machinery, nuclear reactors, boilers | $145B | 19% | |
| Electrical, electronic equipment | $140B | 18% | |
| Optical, photo, technical, medical apparatus | $40.2B | 5.3% | |
| Plastics | $29.9B | 3.9% | |
| Iron and steel | $28.9B | 3.8% | |
| Pearls, precious stones, metals, coins | $24.8B | 3.3% | |
| Pharmaceutical products | $16.4B | 2.2% | |
| Organic chemicals | $15.2B | 2.0% | |
| Miscellaneous chemical products | $14.3B | 1.9% | |
| Copper | $14.1B | 1.9% | |
| Rubbers | $11.5B | 1.5% | |
| Articles of iron or steel | $11.5B | 1.5% | |
| Ships, boats, and other floating structures | $9.73B | 1.3% | |
| Mineral fuels, oils, distillation products | $9.27B | 1.2% |
ImportsBack to top ↑
Where its imports come from
The largest partners in 2024, with each one's share of the nation's imports.
| Partner | Value | Share | |
|---|---|---|---|
| China | $163B | 23% | |
| United States | $80.6B | 11% | |
| Australia | $49.3B | 6.8% | |
| United Arab Emirates | $36.8B | 5.1% | |
| Saudi Arabia | $29.8B | 4.1% | |
| South Korea | $28.7B | 4.0% | |
| Taiwan | $28.1B | 3.9% | |
| Vietnam | $26.5B | 3.7% | |
| Thailand | $24.1B | 3.3% | |
| Indonesia | $22.4B | 3.1% | |
| Germany | $21.0B | 2.9% | |
| Malaysia | $19.6B | 2.7% | |
| Canada | $12.2B | 1.7% | |
| Italy | $10.9B | 1.5% | |
| France | $10.7B | 1.5% | |
| Philippines | $10.5B | 1.5% | |
| Singapore | $8.99B | 1.2% | |
| Switzerland | $8.47B | 1.2% | |
| Chile | $8.05B | 1.1% | |
| Brazil | $7.80B | 1.1% |
What it imports
The largest categories in 2024.
| Category | Value | Share | |
|---|---|---|---|
| Mineral fuels, oils, distillation products | $165B | 23% | |
| Electrical, electronic equipment | $105B | 15% | |
| Machinery, nuclear reactors, boilers | $74.5B | 10% | |
| Pharmaceutical products | $29.6B | 4.1% | |
| Ores slag and ash | $27.8B | 3.9% | |
| Optical, photo, technical, medical apparatus | $26.3B | 3.6% | |
| Vehicles other than railway, tramway | $22.8B | 3.2% | |
| Plastics | $17.4B | 2.4% | |
| Pearls, precious stones, metals, coins | $15.1B | 2.1% | |
| Organic chemicals | $14.3B | 2.0% | |
| Articles of apparel, knit or crocheted | $11.9B | 1.7% | |
| Articles of apparel, not knit or crocheted | $10.8B | 1.5% | |
| Meat and edible meat offal | $10.1B | 1.4% | |
| Wood and articles of wood, wood charcoal | $9.34B | 1.3% | |
| Fish, crustaceans, molluscs, aquatics invertebrates | $8.76B | 1.2% |
In a list, the bar runs to the largest in that list. The line is each figure’s history from 2000, drawn to its own peak: it shows the shape of the years, and the value shows the size.
External balanceBack to top ↑
$56.6 billion (2013 est.)//$60.8 billion (2012 est.)
Trade Facilitation & LogisticsBack to top ↑
Trade Policy & Market AccessBack to top ↑
- Trade Policy & Negotiation Capability
- Market Access & Agreements Network
- Trade Law & Enforcement
- Standards, Conformity & Quality Infrastructure
Digital & Services TradeBack to top ↑
- Services Trade Capability
- Digital Trade & E-Commerce
- Data Flows & Digital Trade Governance
- Tourism & Visitor Economy
Investment Attraction & ProjectionBack to top ↑
- Investment Attraction & Facilitation
- Investment Absorption & Linkages
- Outward Investment & Global Corporate Presence
$231.2 billion (31 December 2013 est.)//$222.2 billion (31 December 2012 est.)
$1.179 trillion (31 December 2013 est.)//$1.054 trillion (31 December 2012 est.)
Export Capability & SophisticationBack to top ↑
$697 billion (2013 est.)//$776.6 billion (2012 est.)
China 18.1%, US 17.8%, South Korea 7.7%, Thailand 5.5%, Hong Kong 5.1% (2012)
motor vehicles 13.6%; semiconductors 6.2%; iron and steel products 5.5%; auto parts 4.6%; plastic materials 3.5%; power generating machinery 3.5%
Global Value Chain PositionBack to top ↑
- Value Chain Participation & Integration
- Value Chain Position & Upgrading
- Regional Integration & Hub Anchoring
Economic Leverage & DependenceBack to top ↑
- Strategic Supply Security
- Concentration Risk & Revenue Stabilisation
- Economic Leverage & Coercion Resistance
$766.6 billion (2013 est.)//$830.1 billion (2012 est.)
China 21.3%, US 8.8%, Australia 6.4%, Saudi Arabia 6.2%, UAE 5%, South Korea 4.6%, Qatar 4% (2012)
petroleum 15.5%; liquid natural gas 5.7%; clothing 3.9%; semiconductors 3.5%; coal 3.5%; audio and visual apparatus 2.7% (2011 est.)
Japan · you are in
Historical Context
Foundations
GINC Capability Domains
Find in this brief · Japan