
Taiwan
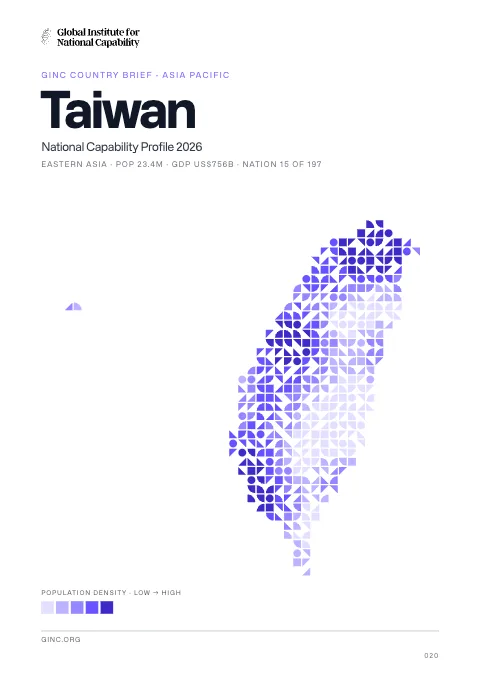
Taiwan is a multiparty democracy in East and Southeast Asia, home to 23 million people, with its capital at Taipei.
Contents
12 chapters
Foundations
01–03
At a glance
- Area
- 36Kkm²#138 World#14 E & SE Asia
- Population
- 23.4M#51 World#10 E & SE Asia
- GDP (market)
- $485B
- GDP (PPP)
- $926.4B#20 World#4 E & SE Asia
- GDP per capita
- $39.6K#29 World#5 E & SE Asia
The whole brief
Taiwan National Capability Profile 2026
Foundations · Chapter 01
Historical Context
🇹🇼 Taiwan’s understanding the origins and evolution of the modern nation
BackgroundBack to top ↑
In 1895, military defeat forced China's Qing Dynasty to cede Taiwan to Japan. Taiwan came under Chinese Nationalist control after World War II. Following the communist victory on the mainland in 1949, 2 million Nationalists fled to Taiwan and established a government using the 1947 constitution drawn up for all of China. Beginning in the 1950s, the ruling authorities gradually democratized and incorporated the local population within the governing structure. This process expanded rapidly in the 1980s. In 2000, Taiwan underwent its first peaceful transfer of power from the Nationalist (Kuomintang or KMT) to the Democratic Progressive Party. Throughout this period, the island prospered and became one of East Asia's economic "Tigers." The dominant political issues continue to be management of sensitive relations between Taiwan and China - specifically the question of Taiwan's eventual status - as well as domestic priorities for economic reform and growth.
National holidayBack to top ↑
Republic Day (Anniversary of the Chinese Revolution), 10 October (1911)
Foundations · Chapter 02
Geography
🇹🇼 Taiwan’s territory, resources and strategic position
Location and areaBack to top ↑
Eastern Asia, islands bordering the East China Sea, Philippine Sea, South China Sea, and Taiwan Strait, north of the Philippines, off the southeastern coast of China
23 30 N, 121 00 E
Southeast Asia
slightly smaller than Maryland and Delaware combined
0 km
1,566.3 km
Terrain and resourcesBack to top ↑
eastern two-thirds mostly rugged mountains; flat to gently rolling plains in west
small deposits of coal, natural gas, limestone, marble, and asbestos
NA
Settlement and hazardsBack to top ↑
earthquakes; typhoons
strategic location adjacent to both the Taiwan Strait and the Luzon Strait
OtherBack to top ↑
67 cu km (2011)
air pollution; water pollution from industrial emissions, raw sewage; contamination of drinking water supplies; trade in endangered species; low-level radioactive waste disposal
Foundations · Chapter 03
Environment
🇹🇼 Taiwan’s environmental conditions, resources and national resilience
ClimateBack to top ↑
tropical; marine; rainy season during southwest monsoon (June to August); cloudiness is persistent and extensive all year
GINC Capability Domains · Chapter 04
Critical Technology
🇹🇼 Taiwan’s technology frontiers and the pursuit of national advantage
Two counts are set side by side for 2015–2024: on the left, the papers researchers in Taiwan published; on the right, the patent families that began there and were filed in more than one country. First by capability group, then group by group with each group’s capabilities. The badge on a card is the nation’s place among all nations. Papers are from GINC Research Analytics, patent families from GINC Patents.
Research by capability group
#19 WorldPapers published, 2015–2024
5,985
3,253
3,170
2,745
1,676
1,629
1,345
1,003
761
19
Patents by capability group
#6 WorldInternational patent families, 2015–2024
27,677
8,726
6,110
4,484
3,403
3,356
2,647
1,886
102
70
Advanced Materials & ManufacturingBack to top ↑
Research
#24 WorldPapers published, 2015–2024
Patents
#7 WorldInternational patent families, 2015–2024
Energy TechnologiesBack to top ↑
Research
#13 WorldPapers published, 2015–2024
Patents
#9 WorldInternational patent families, 2015–2024
Semiconductors & Advanced ComputingBack to top ↑
Research
#12 WorldPapers published, 2015–2024
No research topic: Semiconductor Design & EDA · Advanced Semiconductor Fabrication · Semiconductor Equipment & Materials · Advanced Packaging & Heterogeneous Integration
Patents
#5 WorldInternational patent families, 2015–2024
Artificial IntelligenceBack to top ↑
Research
#20 WorldPapers published, 2015–2024
Patents
#6 WorldInternational patent families, 2015–2024
Quantum TechnologiesBack to top ↑
Research
#24 WorldPapers published, 2015–2024
Patents
#17 WorldInternational patent families, 2015–2024
Connectivity, Cyber & Trust TechnologiesBack to top ↑
Research
#17 WorldPapers published, 2015–2024
Patents
#8 WorldInternational patent families, 2015–2024
Sensing, Timing & NavigationBack to top ↑
Research
#20 WorldPapers published, 2015–2024
Patents
#7 WorldInternational patent families, 2015–2024
Robotics & Autonomous SystemsBack to top ↑
Research
#16 WorldPapers published, 2015–2024
No research topic: Human-Machine Interfaces
Patents
#7 WorldInternational patent families, 2015–2024
Biotechnology & Health TechnologiesBack to top ↑
Research
#31 WorldPapers published, 2015–2024
Patents
#12 WorldInternational patent families, 2015–2024
Medicine and BioTech
Clinical research and life-science invention, drawn from the same series that drive the metric pages. Each card opens the full cross-country comparison.
Space TechnologiesBack to top ↑
Research
#38 WorldPapers published, 2015–2024
Patents
#11 WorldInternational patent families, 2015–2024
GINC Capability Domains · Chapter 05
Strategic Infrastructure
🇹🇼 Taiwan’s energy, connectivity and the material foundations of capability
Resource InfrastructureBack to top ↑
21,680 bbl/day (2012 est.)
0 bbl/day (2011 est.)
885,900 bbl/day (2010 est.)
2.38 million bbl (1 January 2013 est.)
920,200 bbl/day (2011 est.)
786,100 bbl/day (2011 est.)
255,000 bbl/day (2011 est.)
304,700 bbl/day (2011 est.)
330.2 million cu m (2011 est.)
16.37 billion cu m (2011 est.)
0 cu m (2011 est.)
15.9 billion cu m (2011 est.)
6.229 billion cu m (1 January 2013 est.)
condensate 25 km; gas 802 km; oil 241 km (2013)
Agriculture & Food InfrastructureBack to top ↑
- Irrigation & Agricultural Water
- Livestock & Veterinary
- Fisheries & Aquaculture
- Storage, Cold Chain & Markets
Energy InfrastructureBack to top ↑
- Thermal Generation
- Nuclear Generation
- Nuclear Fuel Cycle & Radioactive Waste
- Hydropower
- Renewable Generation
- Transmission & Distribution
- System Control & Dispatch
- Storage & Fuel Supply
48.75 million kW (2011 est.)
252.2 billion kWh (2011 est.)
242.2 billion kWh (2011 est.)
0 kWh (2011 est.)
0 kWh (2011 est.)
77.2% of total installed capacity (2011 est.)
10.6% of total installed capacity (2011 est.)
5.3% of total installed capacity (2011 est.)
6.9% of total installed capacity (2011 est.)
293.3 million Mt (2011 est.)
Water, Sanitation & Waste InfrastructureBack to top ↑
- Dams, Reservoirs & Flood Defence
- Water Supply & Treatment
- Bulk Water Transfer & Desalination
- Wastewater & Sanitation
- Solid Waste & Recycling
Advanced ManufacturingBack to top ↑
- Materials & Inputs
- Chemicals & Hazardous Process Industry
- Production Systems
- Supply Chain & Ecosystem
- Workforce & Innovation
Transport InfrastructureBack to top ↑
- Seaports & Terminals
- Air Infrastructure
- Air Navigation & Traffic Management
- Inland Waterways & Ferries
- Rail Infrastructure
- Roads & Bridges
- Logistics, Multimodal & Border Infrastructure
- Postal & Parcel
37 (2013)
31 (2013)
Communications & Digital InfrastructureBack to top ↑
- Subsea Cables & International Gateways
- Core & Backbone Networks
- Mobile & Wireless Networks
- Spectrum & Broadcasting
- Data Centres, Compute & Cloud
- Data Resources
- AI Tools & Applications
15.998 million (2012)
29.455 million (2012)
16.147 million (2009)
6.272 million (2012)
.tw
Financial InfrastructureBack to top ↑
- Currency & Reserves
- Payments & Settlement Systems
- Markets, Exchanges & Depositories
- Banks, Insurers & Systemic Institutions
Social InfrastructureBack to top ↑
- Health Infrastructure
- Public Health & Laboratories
- Medical Supply & Stockpiles
- Education & Skills Infrastructure
- Research & Scientific Facilities
- Housing, Community & Social Services
- Government & Public Administration
- Cultural, Community & Recreational Infrastructure
- Justice & Corrections
- Emergency Services & Civil Protection
- Hydrometeorology & Early Warning
Space, Aerospace & Defence InfrastructureBack to top ↑
GINC Capability Domains · Chapter 06
National Security
🇹🇼 Taiwan’s force, intelligence and the defence of the nation
Disputes and terrorismBack to top ↑
involved in complex dispute with Brunei, China, Malaysia, the Philippines, and Vietnam over the Spratly Islands, and with China and the Philippines over Scarborough Reef; the 2002 "Declaration on the Conduct of Parties in the South China Sea" has eased tensions but falls short of a legally binding "code of conduct" desired by several of the disputants; Paracel Islands are occupied by China, but claimed by Taiwan and Vietnam; in 2003, China and Taiwan became more vocal in rejecting both Japan's claims to the uninhabited islands of the Senkaku-shoto (Diaoyu Tai) and Japan's unilaterally declared exclusive economic zone in the East China Sea where all parties engage in hydrocarbon prospecting
Force Generation & MobilisationBack to top ↑
Army, Navy (includes Marine Corps), Air Force, Coast Guard Administration, Armed Forces Reserve Command, Combined Service Forces Command, Armed Forces Police Command
18-35 years of age for compulsory and voluntary military service; service obligation is 2 years; women may enlist; women in Air Force service are restricted to noncombat roles; reserve obligation to age 30 (Army); the Ministry of Defense is in the process of implementing a voluntary enlistment system over the period 2010-2015, although nonvolunteers will still be required to perform alternative service or go through 4 months of military training (2012)
Forces under arms
Active-duty strength on the Correlates of War series, which reaches back to 1816 and so carries a nation’s whole record of mobilisation rather than its present establishment. The card opens the full cross-country comparison.
Intelligence & AssessmentBack to top ↑
- Imagery & Geospatial Intelligence
- Signals & Cyber Intelligence
- Technical & Measurement Intelligence
- Open-Source & Financial Intelligence
- Human Intelligence & Counterintelligence
- All-Source Analysis & Warning
Joint Command, Projection & SustainmentBack to top ↑
- Command, Control & Communications
- Strategic Lift & Mobility
- Expeditionary & Peace Operations
- Operational Sustainment & War Reserves
- Defence Industrial Mobilisation
- CBRN Defence
Land PowerBack to top ↑
- Combined Arms Manoeuvre
- Land Fires
- Battlefield Aviation & Uncrewed Systems
- Special Operations & Irregular Warfare
Maritime PowerBack to top ↑
- Maritime Security & Constabulary
- Sea Denial & Undersea Warfare
- Sea Control
- Amphibious & Expeditionary Operations
Air PowerBack to top ↑
- Air Sovereignty & Policing
- Control of the Air
- Air Strike & Interdiction
- Airborne ISR, Early Warning & Battle Management
Strategic Strike & Missile DefenceBack to top ↑
Space OperationsBack to top ↑
Cyber & Electromagnetic OperationsBack to top ↑
Nuclear DeterrenceBack to top ↑
GINC Capability Domains · Chapter 07
Human Capital
🇹🇼 Taiwan’s population, health and the skills that sustain capability
DemographyBack to top ↑
23,359,928 (July 2014 est.)
0.25% (2014 est.)
8.55 births/1,000 population (2014 est.)
6.97 deaths/1,000 population (2014 est.)
1.11 children born/woman (2014 est.)
Migration and urbanisationBack to top ↑
0.9 migrant(s)/1,000 population (2014 est.)
Welfare and equityBack to top ↑
1.5% (2012 est.)
34.2 (2011)//32.6 (2000)
Early Childhood DevelopmentBack to top ↑
Foundational EducationBack to top ↑
Advanced EducationBack to top ↑
Technical & Vocational SkillsBack to top ↑
Digital & AI CompetenceBack to top ↑
Generative AI adoption
Modelled share of working-age adults using generative AI, from Microsoft telemetry scaled to each country’s 15–64 population. A measure of how fast a workforce is absorbing the technology rather than of how much of it a nation builds. The card opens the full cross-country comparison.
Lifelong Learning & ReskillingBack to top ↑
Research Talent & Knowledge CreationBack to top ↑
Population HealthBack to top ↑
NA
NA
NA
Health System CapabilityBack to top ↑
GINC Capability Domains · Chapter 08
Governance and Integrity
🇹🇼 Taiwan’s institutions, law and the integrity of the state
State structureBack to top ↑
multiparty democracy
includes main island of Taiwan plus smaller islands nearby and off coast of China's Fujian Province; Taiwan is divided into 14 counties (hsien, singular and plural), 3 municipalities (shih, singular and plural), and 5 special municipalities (chih-hsia-shih, singular and plural)
previous 1912, 1931; latest adopted 25 December 1946, promulgated 1 January 1947, effective 25 December 1947; revised several times, last in 2005 (2013)
20 years of age; universal
Political Institutions & Civic ParticipationBack to top ↑
- Electoral Management & Integrity
- Legislature & Deliberative Institutions
- Citizen Participation & Civic Space
unicameral Legislative Yuan (113 seats - 73 district members elected by popular vote, 34 at-large members elected on basis of proportion of islandwide votes received by participating political parties, 6 elected by popular vote among aboriginal populations; members to serve four-year terms); parties must receive 5% of vote to qualify for at-large seats
Democratic Progressive Party or DPP [SU Tseng-chang]//Kuomintang or KMT (Nationalist Party) [MA Ying-jeou]//New Party [YOK Mu-ming]//Non-Partisan Solidarity Union or NPSU [LIN Pin-kuan]//People First Party or PFP [James SOONG Chu-ye]//Taiwan Solidarity Union or TSU [HUANG Kun-huei]
environmental groups//independence movement//various business groups//
Justice System & Fundamental RightsBack to top ↑
- Judicial Independence & Court Capability
- Access to Justice & Legal Services
- Fundamental Rights Protection
- Human Rights Institutions & Equality Bodies
civil law system
has not submitted an ICJ jurisdiction declaration; non-party state to the ICCt
Internal Security & OrderBack to top ↑
regional transit point for heroin, methamphetamine, and precursor chemicals; transshipment point for drugs to Japan; major problem with domestic consumption of methamphetamine and heroin; rising problems with use of ketamine and club drugs
Regulatory Governance & Strategic ControlsBack to top ↑
- Regulatory Quality & Better Regulation
- Regulatory Delivery & Independent Regulators
- Strategic Controls & Economic Security Administration
Government Effectiveness & Public AdministrationBack to top ↑
- Centre of Government & Policy Coordination
- Civil Service & Public Workforce
- Digital Government & Service Delivery
- Legal Identity & Civil Registration
- Statistical & Data Capability
Public Integrity & Anti-CorruptionBack to top ↑
Transparency, Oversight & AccountabilityBack to top ↑
- Right to Information & Open Government
- Independent Oversight & Supreme Audit
- Independent Media & Journalist Safety
National Resilience & Crisis ManagementBack to top ↑
GINC Capability Domains · Chapter 09
Information and Influence
🇹🇼 Taiwan’s identity, media and the projection of influence
Identity and cultureBack to top ↑
Mandarin Chinese (official), Taiwanese (Min), Hakka dialects
mixture of Buddhist and Taoist 93%, Christian 4.5%, other 2.5%
Taiwanese (including Hakka) 84%, mainland Chinese 14%, indigenous 2%
white, 12-rayed sun on blue field
red field with a dark blue rectangle in the upper hoist-side corner bearing a white sun with 12 triangular rays; the blue and white design of the canton (symbolizing the sun of progress) dates to 1895; it was later adopted as the flag of the Kuomintang Party; blue signifies liberty, justice, and democracy; red stands for fraternity, sacrifice, and nationalism, white represents equality, frankness, and the people's livelihood; the 12 rays of the sun are those of the months and the twelve traditional Chinese hours (each ray equals two hours)
Diplomatic Statecraft & Global NetworksBack to top ↑
- Diplomatic Network & Consular Reach
- Multilateral Leadership & Norm Setting
- Agenda-Setting & Convening
- Mediation & Crisis Diplomacy
ADB, APEC, BCIE, ICC (national committees), IOC, ITUC (NGOs), WTO
none; commercial and cultural relations with the people in the United States are maintained through an unofficial instrumentality, the Taipei Economic and Cultural Representative Office in the United States (TECRO), a private nonprofit corporation that performs citizen and consular services similar to those at diplomatic posts
none; commercial and cultural relations with the people on Taiwan are maintained through an unofficial instrumentality, the American Institute in Taiwan (AIT), a private nonprofit corporation that performs citizen and consular services similar to those at diplomatic posts
Alliances & Security CooperationBack to top ↑
Development Cooperation & Global AssistanceBack to top ↑
Culture, Language & Education DiplomacyBack to top ↑
- Cultural & Language Institutes
- Creative Industries & Cultural Export Reach
- Heritage & Cultural Institutions
- Education Diplomacy & Alumni Networks
- Sports & Major Events
Diaspora & Global CommunitiesBack to top ↑
Information Environment & Strategic CommunicationBack to top ↑
- Strategic Communications & Public Diplomacy
- International Media & Broadcasting
- Information Defence & Counter-Interference
5 nationwide television networks operating roughly 75 TV stations; about 85% of households utilize multi-channel cable TV; national and regional radio networks with about 170 radio stations (2008)
GINC Capability Domains · Chapter 10
Financial Strength
🇹🇼 Taiwan’s fiscal depth, reserves and the capacity to act
Monetary & Currency CapabilityBack to top ↑
- Monetary Policy & Price Stability
- Exchange Rate & External Account Management
- Currency Issuance & Digital Money
1.1% (2013 est.)//1.9% (2012 est.)
New Taiwan dollars (TWD) per US dollar -//29.77 (2013 est.)//29.616 (2012 est.)//31.648 (2010 est.)//33.061 (2009)//31.53 (2008)
1.88% (31 December 2012)//1.88% (31 December 2011)
2.9% (31 December 2013 est.)//2.88% (31 December 2012 est.)
$450.1 billion (31 December 2013 est.)//$426.2 billion (31 December 2012 est.)
$1.189 trillion (31 December 2013 est.)//$1.152 trillion (31 December 2012 est.)
Fiscal Capacity & Public FinanceBack to top ↑
- Revenue Mobilisation & Tax Administration
- Public Expenditure & Budget Management
- Sovereign Debt & Treasury Management
- Public Investment Management
16.1% of GDP (2013 est.)
-2.5% of GDP (2013 est.)
38.9% of GDP (2013 est.)//35.8% of GDP (2012 est.)
calendar year
Financial System Depth & AccessBack to top ↑
- Banking System Capacity
- Capital Markets Depth & Development
- Long-Term & Institutional Capital
- Financial Inclusion & Household Access
- Development & Policy Finance
$753.5 billion (31 December 2013 est.)//$743.1 billion (31 December 2012 est.)
$831.9 billion (31 December 2012)//$784.1 billion (31 December 2011)//$738.3 billion (31 December 2010)
31.3% of GDP (2013 est.)//30.3% of GDP (2012 est.)//29.6% of GDP (2011 est.)
Financial Regulation & IntegrityBack to top ↑
- Prudential Regulation & Supervision
- Financial Integrity & Illicit Finance Control
- Market Conduct & Consumer Protection
- Payment & Market Infrastructure Oversight
Financial Stability & Crisis ManagementBack to top ↑
- Macroprudential & Systemic Oversight
- Crisis Management, Resolution & Deposit Insurance
- External Liquidity & Financial Safety Nets
Sovereign Capital & External Financial PowerBack to top ↑
- Official Reserves Management
- Sovereign Wealth & Public Asset Management
- Currency Internationalisation & Reserve Status
- Capital Account & Flow Management
- International Financial Centre Capability
$414.5 billion (31 December 2013 est.)//$408.5 billion (31 December 2012 est.)
$146.8 billion (31 December 2013 est.)//$130.8 billion (31 December 2012 est.)
GINC Capability Domains · Chapter 11
Production and Innovation
🇹🇼 Taiwan’s output, industry and the engine of prosperity
Economic Output & ProductivityBack to top ↑
Taiwan has a dynamic capitalist economy with gradually decreasing government guidance of investment and foreign trade. Exports, led by electronics, machinery, and petrochemicals have provided the primary impetus for economic development. This heavy dependence on exports exposes the economy to fluctuations in world demand. Taiwan's diplomatic isolation, low birth rate, and rapidly aging population are other major long-term challenges. Free trade agreements have proliferated in East Asia over the past several years, and following the landmark Economic Cooperation Framework Agreement (ECFA) signed with China in June 2010, Taiwan in July 2013 signed a free trade deal with New Zealand—Taipei’s first-ever with a country with which it does not maintain diplomatic relations—and in November inked a trade pact with Singapore. Negotiations continue on follow-on components of ECFA regarding trade in goods and a dispute resolution mechanism; a trade in services agreement is under review in the legislature. Taiwan's Total Fertility rate of just over one child per woman is among the lowest in the world, raising the prospect of future labor shortages, falling domestic demand, and declining tax revenues. Taiwan's population is aging quickly, with the number of people over 65 accounting for 11.2% of the island's total population as of 2012. The island runs a large overall trade surplus largely because of its surplus with China, and its foreign reserves are the world's sixth largest, behind China, Japan, Saudi Arabia, Russia, and Switzerland. In 2006 China overtook the US to become Taiwan's second-largest source of imports after Japan. China is also the island's number one destination for foreign direct investment. Taiwan since 2009 has gradually loosened rules governing Chinese investment on the island, and has also secured greater market access for its investors in the mainland. In August 2012, Taiwan Central Bank signed a memorandum of understanding on cross-Strait currency settlement with its Chinese counterpart. The MOU allows for the direct settlement of Chinese RMB and the New Taiwan dollar across the Strait, which could help develop Taiwan into a local RMB hub. Closer economic links with the mainland bring greater opportunities for the Taiwan economy, but also poses new challenges as the island becomes more economically dependent on China while political differences remain unresolved.
$926.4 billion (2013 est.)//$906.6 billion (2012 est.)//$894.7 billion (2011 est.)
2.2% (2013 est.)//1.3% (2012 est.)//4.1% (2011 est.)
$39,600 (2013 est.)//$38,900 (2012 est.)//$38,500 (2011 est.)
$484.7 billion (2013 est.)
Labour & EmploymentBack to top ↑
- Employment & Labour Force Participation
- Labour Market Institutions & Wage Setting
- Employment Services & Skills Matching
- Labour Adjustment, Transition & Formalisation
11.55 million (2013 est.)
4.1% (2013 est.)//4.2% (2012 est.)
Industrial & Sectoral BaseBack to top ↑
- Manufacturing & Advanced Industry
- Foundational & Process Industries
- Agrifood & Primary Production
- Services Economy
rice, vegetables, fruit, tea, flowers; pigs, poultry; fish
electronics, communications and information technology products, petroleum refining, chemicals, textiles, iron and steel, machinery, cement, food processing, vehicles, consumer products, pharmaceuticals
1.8% (2013 est.)
Structural Transformation & ComplexityBack to top ↑
Business Dynamism & EntrepreneurshipBack to top ↑
- Entrepreneurship & Firm Creation
- Risk Capital & Scale-Up Finance
- Firm Growth, Exit & Renewal
- Competition & Market Contestability
Innovation & CommercialisationBack to top ↑
- Business Innovation Capability
- Research Commercialisation & Knowledge Transfer
- Intellectual Property & Intangible Assets
- Innovation Ecosystems & Clusters
Technology Adoption & DiffusionBack to top ↑
GINC Capability Domains · Chapter 12
Trade and Investment
🇹🇼 Taiwan’s markets, capital and the terms of global exchange
Overall tradeBack to top ↑
$577B of exports to 210 partners and $359B of imports from 211 in 2024, a surplus of $218B.
- Exports
- $577B210 partners
- Imports
- $359B211 partners
- Balance
- +$218Bsurplus
- Total trade
- $936B2024
ExportsBack to top ↑
Where its exports go
The largest partners in 2024, with each one's share of the nation's exports.
| Partner | Value | Share | |
|---|---|---|---|
| United States | $113B | 20% | |
| China | $105B | 18% | |
| Hong Kong | $69.6B | 12% | |
| Singapore | $59.4B | 10% | |
| South Korea | $29.8B | 5.2% | |
| Japan | $28.1B | 4.9% | |
| Thailand | $19.9B | 3.5% | |
| Malaysia | $19.3B | 3.3% | |
| Mexico | $15.6B | 2.7% | |
| Vietnam | $14.2B | 2.5% | |
| Germany | $13.1B | 2.3% | |
| India | $11.3B | 2.0% | |
| Netherlands | $8.40B | 1.5% | |
| Australia | $6.27B | 1.1% | |
| United Kingdom | $5.38B | 0.9% | |
| Canada | $4.94B | 0.9% | |
| France | $4.33B | 0.8% | |
| Philippines | $4.27B | 0.7% | |
| Indonesia | $3.92B | 0.7% | |
| Brazil | $2.72B | 0.5% |
What it exports
The largest categories in 2024.
| Category | Value | Share | |
|---|---|---|---|
| Electrical, electronic equipment | $309B | 54% | |
| Machinery, nuclear reactors, boilers | $135B | 23% | |
| Plastics | $19.1B | 3.3% | |
| Optical, photo, technical, medical apparatus | $13.5B | 2.3% | |
| Vehicles other than railway, tramway | $10.8B | 1.9% | |
| Mineral fuels, oils, distillation products | $9.51B | 1.6% | |
| Organic chemicals | $8.61B | 1.5% | |
| Iron and steel | $8.55B | 1.5% | |
| Articles of iron or steel | $8.00B | 1.4% | |
| Copper | $4.31B | 0.7% | |
| Miscellaneous chemical products | $3.38B | 0.6% | |
| Tools, implements, cutlery of base metal | $3.32B | 0.6% | |
| Rubbers | $2.81B | 0.5% | |
| Pearls, precious stones, metals, coins | $2.70B | 0.5% | |
| Toys, games, sports requisites | $2.69B | 0.5% |
ImportsBack to top ↑
Where its imports come from
The largest partners in 2024, with each one's share of the nation's imports.
| Partner | Value | Share | |
|---|---|---|---|
| China | $77.3B | 22% | |
| Japan | $45.3B | 13% | |
| South Korea | $41.9B | 12% | |
| United States | $38.3B | 11% | |
| Australia | $14.5B | 4.0% | |
| Malaysia | $14.4B | 4.0% | |
| Germany | $12.5B | 3.5% | |
| Singapore | $9.96B | 2.8% | |
| Saudi Arabia | $8.44B | 2.3% | |
| Vietnam | $7.89B | 2.2% | |
| Indonesia | $7.85B | 2.2% | |
| Mexico | $7.09B | 2.0% | |
| Thailand | $6.28B | 1.7% | |
| Netherlands | $5.17B | 1.4% | |
| Russia | $4.56B | 1.3% | |
| France | $4.34B | 1.2% | |
| Qatar | $4.30B | 1.2% | |
| United Arab Emirates | $3.99B | 1.1% | |
| Kuwait | $3.37B | 0.9% | |
| Italy | $3.20B | 0.9% |
What it imports
The largest categories in 2024.
| Category | Value | Share | |
|---|---|---|---|
| Electrical, electronic equipment | $113B | 31% | |
| Mineral fuels, oils, distillation products | $57.5B | 16% | |
| Machinery, nuclear reactors, boilers | $51.0B | 14% | |
| Optical, photo, technical, medical apparatus | $14.2B | 4.0% | |
| Vehicles other than railway, tramway | $11.6B | 3.2% | |
| Iron and steel | $9.56B | 2.7% | |
| Plastics | $8.10B | 2.3% | |
| Organic chemicals | $7.86B | 2.2% | |
| Copper | $7.57B | 2.1% | |
| Pharmaceutical products | $5.67B | 1.6% | |
| Miscellaneous chemical products | $5.63B | 1.6% | |
| Pearls, precious stones, metals, coins | $5.12B | 1.4% | |
| Ores slag and ash | $3.72B | 1.0% | |
| Aircraft, spacecraft | $3.55B | 1.0% | |
| Inorganic chemicals, precious metal compound, isotope | $2.87B | 0.8% |
In a list, the bar runs to the largest in that list. The line is each figure’s history from 2000, drawn to its own peak: it shows the shape of the years, and the value shows the size.
External balanceBack to top ↑
$56.66 billion (2013 est.)//$49.92 billion (2012 est.)
Trade Facilitation & LogisticsBack to top ↑
Trade Policy & Market AccessBack to top ↑
- Trade Policy & Negotiation Capability
- Market Access & Agreements Network
- Trade Law & Enforcement
- Standards, Conformity & Quality Infrastructure
Digital & Services TradeBack to top ↑
- Services Trade Capability
- Digital Trade & E-Commerce
- Data Flows & Digital Trade Governance
- Tourism & Visitor Economy
Investment Attraction & ProjectionBack to top ↑
- Investment Attraction & Facilitation
- Investment Absorption & Linkages
- Outward Investment & Global Corporate Presence
$62.94 billion (31 December 2013 est.)//$59.36 billion (31 December 2012 est.)
$240.3 billion (31 December 2013 est.)//$226.1 billion (31 December 2012 est.)
Export Capability & SophisticationBack to top ↑
$305.8 billion (2013 est.)//$299.8 billion (2012 est.)
China 27.1%, Hong Kong 13.2%, US 10.3%, Japan 6.4%, Singapore 4.4% (2012 est.)
electronics, flat panels, machinery; metals; textiles, plastics, chemicals; optical, photographic, measuring, and medical instruments
Global Value Chain PositionBack to top ↑
- Value Chain Participation & Integration
- Value Chain Position & Upgrading
- Regional Integration & Hub Anchoring
Economic Leverage & DependenceBack to top ↑
- Strategic Supply Security
- Concentration Risk & Revenue Stabilisation
- Economic Leverage & Coercion Resistance
$268.5 billion (2013 est.)//$268.8 billion (2012 est.)
Japan 17.6%, China 16.1%, US 9.5% (2012 est.)
electronics, machinery, crude petroleum, precision instruments, organic chemicals, metals
Taiwan · you are in
Historical Context
Foundations
GINC Capability Domains
Find in this brief · Taiwan