
Indonesia
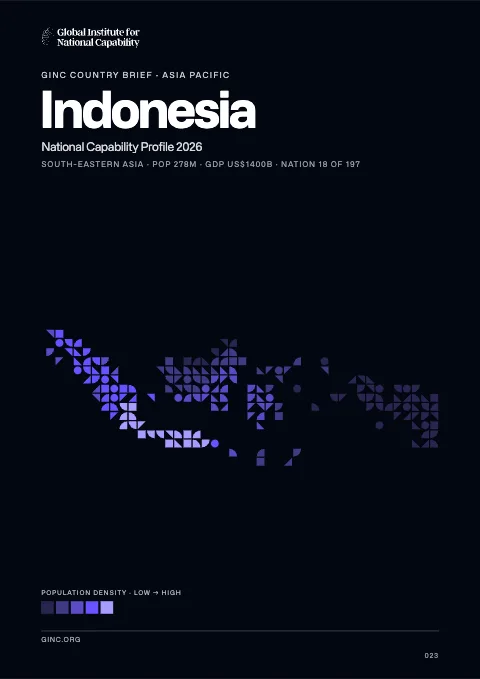
Indonesia is a republic in East and Southeast Asia, home to 254 million people, with its capital at Jakarta, and the world’s 15th-largest country by area.
Contents
12 chapters
Foundations
01–03
At a glance
- Area
- 1.9Mkm²#15 World#1 E & SE Asia
- Population
- 253.6M#4 World#1 E & SE Asia
- GDP (market)
- $868B
- GDP (PPP)
- $1.3T#15 World#3 E & SE Asia
- GDP per capita
- $5.2K#159 World#12 E & SE Asia
The whole brief
Indonesia National Capability Profile 2026
Foundations · Chapter 01
Historical Context
🇮🇩 Indonesia’s understanding the origins and evolution of the modern nation
BackgroundBack to top ↑
The Dutch began to colonize Indonesia in the early 17th century; Japan occupied the islands from 1942 to 1945. Indonesia declared its independence shortly before Japan's surrender, but it required four years of sometimes brutal fighting, intermittent negotiations, and UN mediation before the Netherlands agreed to transfer sovereignty in 1949. A period of sometimes unruly parliamentary democracy ended in 1957 when President SOEKARNO declared martial law and instituted "Guided Democracy." After an abortive coup in 1965 by alleged communist sympathizers, SOEKARNO was gradually eased from power. From 1967 until 1988, President SUHARTO ruled Indonesia with his "New Order" government. After rioting toppled Suharto in 1998, free and fair legislative elections took place in 1999. Indonesia is now the world's third most populous democracy, the world's largest archipelagic state, and the world's largest Muslim-majority nation. Current issues include: alleviating poverty, improving education, preventing terrorism, consolidating democracy after four decades of authoritarianism, implementing economic and financial reforms, stemming corruption, reforming the criminal justice system, holding the military and police accountable for human rights violations, addressing climate change, and controlling infectious diseases, particularly those of global and regional importance. In 2005, Indonesia reached a historic peace agreement with armed separatists in Aceh, which led to democratic elections in Aceh in December 2006. Indonesia continues to face low intensity armed resistance in Papua by the separatist Free Papua Movement.
IndependenceBack to top ↑
17 August 1945 (declared)
National holidayBack to top ↑
Independence Day, 17 August (1945)
Foundations · Chapter 02
Geography
🇮🇩 Indonesia’s territory, resources and strategic position
Location and areaBack to top ↑
Southeastern Asia, archipelago between the Indian Ocean and the Pacific Ocean
5 00 S, 120 00 E
Southeast Asia
slightly less than three times the size of Texas
54,716 km
measured from claimed archipelagic straight baselines
Terrain and resourcesBack to top ↑
mostly coastal lowlands; larger islands have interior mountains
petroleum, tin, natural gas, nickel, timber, bauxite, copper, fertile soils, coal, gold, silver
67,220 sq km (2005)
Settlement and hazardsBack to top ↑
occasional floods; severe droughts; tsunamis; earthquakes; volcanoes; forest fires
archipelago of 17,508 islands, some 6,000 of which are inhabited (Indonesia is the world's largest country comprised solely of islands); straddles equator; strategic location astride or along major sea lanes from Indian Ocean to Pacific Ocean
OtherBack to top ↑
2,019 cu km (2011)
deforestation; water pollution from industrial wastes, sewage; air pollution in urban areas; smoke and haze from forest fires
Foundations · Chapter 03
Environment
🇮🇩 Indonesia’s environmental conditions, resources and national resilience
ClimateBack to top ↑
tropical; hot, humid; more moderate in highlands
Emissions and pollutionBack to top ↑
Water, waste and foodBack to top ↑
Resources and agreementsBack to top ↑
GINC Capability Domains · Chapter 04
Critical Technology
🇮🇩 Indonesia’s technology frontiers and the pursuit of national advantage
Two counts are set side by side for 2015–2024: on the left, the papers researchers in Indonesia published; on the right, the patent families that began there and were filed in more than one country. First by capability group, then group by group with each group’s capabilities. The badge on a card is the nation’s place among all nations. Papers are from GINC Research Analytics, patent families from GINC Patents.
Research by capability group
#21 WorldPapers published, 2015–2024
11,075
1,888
1,721
1,558
1,537
1,403
1,015
165
162
24
Patents by capability group
#63 WorldInternational patent families, 2015–2024
Advanced Materials & ManufacturingBack to top ↑
Research
#34 WorldPapers published, 2015–2024
Patents
#60 WorldInternational patent families, 2015–2024
Energy TechnologiesBack to top ↑
Research
#28 WorldPapers published, 2015–2024
Patents
#45 WorldInternational patent families, 2015–2024
Semiconductors & Advanced ComputingBack to top ↑
Research
#46 WorldPapers published, 2015–2024
No research topic: Semiconductor Design & EDA · Advanced Semiconductor Fabrication · Semiconductor Equipment & Materials · Advanced Packaging & Heterogeneous Integration
Patents
International patent families, 2015–2024
No international patent families on record for 2015–2024.
Artificial IntelligenceBack to top ↑
Research
#11 WorldPapers published, 2015–2024
Patents
#68 WorldInternational patent families, 2015–2024
Quantum TechnologiesBack to top ↑
Research
#49 WorldPapers published, 2015–2024
Patents
International patent families, 2015–2024
No international patent families on record for 2015–2024.
Connectivity, Cyber & Trust TechnologiesBack to top ↑
Research
#18 WorldPapers published, 2015–2024
Patents
#79 WorldInternational patent families, 2015–2024
Sensing, Timing & NavigationBack to top ↑
Research
#19 WorldPapers published, 2015–2024
Patents
International patent families, 2015–2024
No international patent families on record for 2015–2024.
Robotics & Autonomous SystemsBack to top ↑
Research
#28 WorldPapers published, 2015–2024
No research topic: Human-Machine Interfaces
Patents
#71 WorldInternational patent families, 2015–2024
Biotechnology & Health TechnologiesBack to top ↑
Research
#24 WorldPapers published, 2015–2024
Patents
#64 WorldInternational patent families, 2015–2024
Medicine and BioTech
Clinical research and life-science invention, drawn from the same series that drive the metric pages. Each card opens the full cross-country comparison.
Space TechnologiesBack to top ↑
Research
#35 WorldPapers published, 2015–2024
Patents
International patent families, 2015–2024
No international patent families on record for 2015–2024.
GINC Capability Domains · Chapter 05
Strategic Infrastructure
🇮🇩 Indonesia’s energy, connectivity and the material foundations of capability
Resource InfrastructureBack to top ↑
974,300 bbl/day (2012 est.)
338,100 bbl/day (2010 est.)
388,400 bbl/day (2010 est.)
4.03 billion bbl (1 January 2013 est.)
935,300 bbl/day (2011 est.)
1.322 million bbl/day (2011 est.)
142,400 bbl/day (2010 est.)
473,400 bbl/day (2011 est.)
76.25 billion cu m (2011 est.)
39.56 billion cu m (2010 est.)
38.67 billion cu m (2011 est.)
0 cu m (2011 est.)
3.069 trillion cu m (1 January 2013 est.)
condensate 1,064 km; condensate/gas 150 km; gas 11,702 km; liquid petroleum gas 119 km; oil 7,767 km; oil/gas/water 77 km; refined products 728 km; unknown 53 km; water 44 km (2013)
Agriculture & Food InfrastructureBack to top ↑
- Irrigation & Agricultural Water
- Livestock & Veterinary
- Fisheries & Aquaculture
- Storage, Cold Chain & Markets
Energy InfrastructureBack to top ↑
- Thermal Generation
- Nuclear Generation
- Nuclear Fuel Cycle & Radioactive Waste
- Hydropower
- Renewable Generation
- Transmission & Distribution
- System Control & Dispatch
- Storage & Fuel Supply
39.9 million kW (2011 est.)
173.8 billion kWh (2011 est.)
158 billion kWh (2011 est.)
0 kWh (2012 est.)
2.542 billion kWh (2011 est.)
87% of total installed capacity (2011 est.)
0% of total installed capacity (2011 est.)
9.9% of total installed capacity (2011 est.)
3.1% of total installed capacity (2011 est.)
426.8 million Mt (2011 est.)
Water, Sanitation & Waste InfrastructureBack to top ↑
- Dams, Reservoirs & Flood Defence
- Water Supply & Treatment
- Bulk Water Transfer & Desalination
- Wastewater & Sanitation
- Solid Waste & Recycling
Advanced ManufacturingBack to top ↑
- Materials & Inputs
- Chemicals & Hazardous Process Industry
- Production Systems
- Supply Chain & Ecosystem
- Workforce & Innovation
Transport InfrastructureBack to top ↑
- Seaports & Terminals
- Air Infrastructure
- Air Navigation & Traffic Management
- Inland Waterways & Ferries
- Rail Infrastructure
- Roads & Bridges
- Logistics, Multimodal & Border Infrastructure
- Postal & Parcel
673 (2013)
76 (2013)
21,579 km (2011)
the International Maritime Bureau continues to report the territorial and offshore waters in the Strait of Malacca and South China Sea as high risk for piracy and armed robbery against ships; attacks have increased yearly since 2009; in 2012, 73 commercial vessels were boarded and 47 crew members taken hostage; hijacked vessels are often disguised and cargo diverted to ports in East Asia; crews have been murdered or cast adrift
Communications & Digital InfrastructureBack to top ↑
- Subsea Cables & International Gateways
- Core & Backbone Networks
- Mobile & Wireless Networks
- Spectrum & Broadcasting
- Data Centres, Compute & Cloud
- Data Resources
- AI Tools & Applications
37.983 million (2012)
281.96 million (2012)
20 million (2009)
1.344 million (2012)
.id
Financial InfrastructureBack to top ↑
- Currency & Reserves
- Payments & Settlement Systems
- Markets, Exchanges & Depositories
- Banks, Insurers & Systemic Institutions
Social InfrastructureBack to top ↑
- Health Infrastructure
- Public Health & Laboratories
- Medical Supply & Stockpiles
- Education & Skills Infrastructure
- Research & Scientific Facilities
- Housing, Community & Social Services
- Government & Public Administration
- Cultural, Community & Recreational Infrastructure
- Justice & Corrections
- Emergency Services & Civil Protection
- Hydrometeorology & Early Warning
Space, Aerospace & Defence InfrastructureBack to top ↑
GINC Capability Domains · Chapter 06
National Security
🇮🇩 Indonesia’s force, intelligence and the defence of the nation
Disputes and terrorismBack to top ↑
Indonesia has a stated foreign policy objective of establishing stable fixed land and maritime boundaries with all of its neighbors; three stretches of land borders with Timor-Leste have yet to be delimited, two of which are in the Oecussi exclave area, and no maritime or Exclusive Economic Zone (EEZ) boundaries have been established between the countries; many refugees from Timor-Leste who left in 2003 still reside in Indonesia and refuse repatriation; all borders between Indonesia and Australia have been agreed upon bilaterally, but a 1997 treaty that would settle the last of their maritime and EEZ boundary has yet to be ratified by Indonesia's legislature; Indonesian groups challenge Australia's claim to Ashmore Reef; Australia has closed parts of the Ashmore and Cartier Reserve to Indonesian traditional fishing and placed restrictions on certain catches; land and maritime negotiations with Malaysia are ongoing, and disputed areas include the controversial Tanjung Datu and Camar Wulan border area in Borneo and the maritime boundary in the Ambalat oil block in the Celebes Sea; Indonesia and Singapore continue to work on finalizing their 1973 maritime boundary agreement by defining unresolved areas north of Indonesia's Batam Island; Indonesian secessionists, squatters, and illegal migrants create repatriation problems for Papua New Guinea; maritime delimitation talks continue with Palau; EEZ negotiations with Vietnam are ongoing, and the two countries in Fall 2011 agreed to work together to reduce illegal fishing along their maritime boundary
Force Generation & MobilisationBack to top ↑
Indonesian Armed Forces (Tentara Nasional Indonesia, TNI): Army (TNI-Angkatan Darat (TNI-AD)), Navy (TNI-Angkatan Laut (TNI-AL); includes marines (Korps Marinir, KorMar), naval air arm), Air Force (TNI-Angkatan Udara (TNI-AU)), National Air Defense Command (Kommando Pertahanan Udara Nasional (Kohanudnas)) (2013)
18-45 years of age for voluntary military service, with selective conscription authorized; 2-year service obligation, with reserve obligation to age 45 (officers); Indonesian citizens only (2012)
0.78% of GDP (2012)//0.67% of GDP (2011)//0.78% of GDP (2010)
Forces under arms
Active-duty strength on the Correlates of War series, which reaches back to 1816 and so carries a nation’s whole record of mobilisation rather than its present establishment. The card opens the full cross-country comparison.
Intelligence & AssessmentBack to top ↑
- Imagery & Geospatial Intelligence
- Signals & Cyber Intelligence
- Technical & Measurement Intelligence
- Open-Source & Financial Intelligence
- Human Intelligence & Counterintelligence
- All-Source Analysis & Warning
Joint Command, Projection & SustainmentBack to top ↑
- Command, Control & Communications
- Strategic Lift & Mobility
- Expeditionary & Peace Operations
- Operational Sustainment & War Reserves
- Defence Industrial Mobilisation
- CBRN Defence
Land PowerBack to top ↑
- Combined Arms Manoeuvre
- Land Fires
- Battlefield Aviation & Uncrewed Systems
- Special Operations & Irregular Warfare
Maritime PowerBack to top ↑
- Maritime Security & Constabulary
- Sea Denial & Undersea Warfare
- Sea Control
- Amphibious & Expeditionary Operations
Air PowerBack to top ↑
- Air Sovereignty & Policing
- Control of the Air
- Air Strike & Interdiction
- Airborne ISR, Early Warning & Battle Management
Strategic Strike & Missile DefenceBack to top ↑
Space OperationsBack to top ↑
Cyber & Electromagnetic OperationsBack to top ↑
Nuclear DeterrenceBack to top ↑
GINC Capability Domains · Chapter 07
Human Capital
🇮🇩 Indonesia’s population, health and the skills that sustain capability
DemographyBack to top ↑
253,609,643 (July 2014 est.)
0.95% (2014 est.)
17.04 births/1,000 population (2014 est.)
6.34 deaths/1,000 population (2014 est.)
2.18 children born/woman (2014 est.)
22.8
61.9% (2012)
Migration and urbanisationBack to top ↑
-1.18 migrant(s)/1,000 population (2014 est.)
JAKARTA (capital) 9.769 million; Surabaya 2.787 million; Bandung 2.429 million; Medan 2.118 million; Semarang 1.573 million; Palembang 1.455 million (2011)
Welfare and equityBack to top ↑
11.7% (2012 est.)
36.8 (2009)//39.4 (2005)
DisplacementBack to top ↑
Early Childhood DevelopmentBack to top ↑
18.6% (2010)
Foundational EducationBack to top ↑
2.8% of GDP (2011)
Advanced EducationBack to top ↑
Technical & Vocational SkillsBack to top ↑
Digital & AI CompetenceBack to top ↑
Generative AI adoption
Modelled share of working-age adults using generative AI, from Microsoft telemetry scaled to each country’s 15–64 population. A measure of how fast a workforce is absorbing the technology rather than of how much of it a nation builds. The card opens the full cross-country comparison.
Lifelong Learning & ReskillingBack to top ↑
Research Talent & Knowledge CreationBack to top ↑
Population HealthBack to top ↑
220 deaths/100,000 live births (2010)
4.8% (2008)
0.4% (2012 est.)
605,500 (2012 est.)
26,800 (2012 est.)
Health System CapabilityBack to top ↑
2.7% of GDP (2011)
0.2 physicians/1,000 population (2012)
0.6 beds/1,000 population (2010)
GINC Capability Domains · Chapter 08
Governance and Integrity
🇮🇩 Indonesia’s institutions, law and the integrity of the state
State structureBack to top ↑
republic
31 provinces (provinsi-provinsi, singular - provinsi), 1 autonomous province*, 1 special region** (daerah-daerah istimewa, singular - daerah istimewa), and 1 national capital district*** (daerah khusus ibukota); Aceh*, Bali, Banten, Bengkulu, Gorontalo, Jakarta Raya***, Jambi, Jawa Barat (West Java), Jawa Tengah (Central Java), Jawa Timur (East Java), Kalimantan Barat (West Kalimantan), Kalimantan Selatan (South Kalimantan), Kalimantan Utara (North Kalimantan), Kalimantan Tengah (Central Kalimantan), Kalimantan Timur (East Kalimantan), Kepulauan Bangka Belitung (Bangka Belitung Islands), Kepulauan Riau (Riau Islands), Lampung, Maluku, Maluku Utara (North Maluku), Nusa Tenggara Barat (West Nusa Tenggara), Nusa Tenggara Timur (East Nusa Tenggara), Papua, Papua Barat (West Papua), Riau, Sulawesi Barat (West Sulawesi), Sulawesi Selatan (South Sulawesi), Sulawesi Tengah (Central Sulawesi), Sulawesi Tenggara (Southeast Sulawesi), Sulawesi Utara (North Sulawesi), Sumatera Barat (West Sumatra), Sumatera Selatan (South Sumatra), Sumatera Utara (North Sumatra), Yogyakarta**
drafted July to August 1945, effective 17 August 1945, abrogated by 1949 and 1950 constitutions, 1945 constitution restored 5 July 1959; amended several times, last in 2002 (2013)
17 years of age; universal and married persons regardless of age
Political Institutions & Civic ParticipationBack to top ↑
- Electoral Management & Integrity
- Legislature & Deliberative Institutions
- Citizen Participation & Civic Space
People's Consultative Assembly (Majelis Permusyawaratan Rakyat or MPR) is the upper house; it consists of members of the DPR and DPD and has role in inaugurating and impeaching the president and in amending the constitution but does not formulate national policy; House of Representatives or Dewan Perwakilan Rakyat (DPR) (560 seats, members elected to serve five-year terms), formulates and passes legislation at the national level; House of Regional Representatives (Dewan Perwakilan Daerah or DPD), constitutionally mandated role includes providing legislative input to DPR on issues affecting regions (132 members, four from each of Indonesia's origianal 30 provinces, two special regions, and one special capital city district)
Democrat Party or PD [Susilo Bambang YUDHOYONO]//Functional Groups Party or GOLKAR [Aburizal BAKRIE]//Great Indonesia Movement Party or GERINDRA [SUHARDI]//Indonesia Democratic Party-Struggle or PDI-P [MEGAWATI Sukarnoputri]//National Awakening Party or PKB [Muhaiman ISKANDAR]//National Mandate Party or PAN [Hatta RAJASA]//People's Conscience Party or HANURA [WIRANTO]//Prosperous Justice Party or PKS [Anis MATTA]//United Development Party or PPP [Suryadharma ALI]
Commission for the "Disappeared" and Victims of Violence or KontraS//Indonesia Corruption Watch or ICW//Indonesian Forum for the Environment or WALHI
Justice System & Fundamental RightsBack to top ↑
- Judicial Independence & Court Capability
- Access to Justice & Legal Services
- Fundamental Rights Protection
- Human Rights Institutions & Equality Bodies
civil law system based on the Roman-Dutch model and influenced by customary law
has not submitted an ICJ jurisdiction declaration; non-party state to the ICCt
Internal Security & OrderBack to top ↑
illicit producer of cannabis largely for domestic use; producer of methamphetamine and ecstasy
Regulatory Governance & Strategic ControlsBack to top ↑
- Regulatory Quality & Better Regulation
- Regulatory Delivery & Independent Regulators
- Strategic Controls & Economic Security Administration
Government Effectiveness & Public AdministrationBack to top ↑
- Centre of Government & Policy Coordination
- Civil Service & Public Workforce
- Digital Government & Service Delivery
- Legal Identity & Civil Registration
- Statistical & Data Capability
Public Integrity & Anti-CorruptionBack to top ↑
Transparency, Oversight & AccountabilityBack to top ↑
- Right to Information & Open Government
- Independent Oversight & Supreme Audit
- Independent Media & Journalist Safety
National Resilience & Crisis ManagementBack to top ↑
GINC Capability Domains · Chapter 09
Information and Influence
🇮🇩 Indonesia’s identity, media and the projection of influence
Identity and cultureBack to top ↑
Bahasa Indonesia (official, modified form of Malay), English, Dutch, local dialects (of which the most widely spoken is Javanese)
Muslim 87.2%, Christian 7%, Roman Catholic 2.9%, Hindu 1.7%, other 0.9% (includes Buddhist and Confucian), unspecified 0.4% (2010 est.)
Javanese 40.1%, Sundanese 15.5%, Malay 3.7%, Batak 3.6%, Madurese 3%, Betawi 2.9%, Minangkabau 2.7%, Buginese 2.7%, Bantenese 2%, Banjarese 1.7%, Balinese 1.7%, Acehnese 1.4%, Dayak 1.4%, Sasak 1.3%, Chinese 1.2%, other 15% (2010 est.)
garuda (mythical bird)
two equal horizontal bands of red (top) and white; the colors derive from the banner of the Majapahit Empire of the 13th-15th centuries; red symbolizes courage, white represents purity
Diplomatic Statecraft & Global NetworksBack to top ↑
- Diplomatic Network & Consular Reach
- Multilateral Leadership & Norm Setting
- Agenda-Setting & Convening
- Mediation & Crisis Diplomacy
ADB, APEC, ARF, ASEAN, BIS, CD, CICA (observer), CP, D-8, EAS, EITI (candidate country), FAO, G-11, G-15, G-20, G-77, IAEA, IBRD, ICAO, ICC (national committees), ICRM, IDA, IDB, IFAD, IFC, IFRCS, IHO, ILO, IMF, IMO, IMSO, Interpol, IOC, IOM (observer), IPU, ISO, ITSO, ITU, ITUC (NGOs), MIGA, MONUSCO, NAM, OECD (Enhanced Engagement, OIC, OPCW, PIF (partner), UN, UNAMID, UNCTAD, UNESCO, UNIDO, UNIFIL, UNISFA, UNMIL, UNMISS, UNWTO, UPU, WCO, WFTU (NGOs), WHO, WIPO, WMO, WTO
Alliances & Security CooperationBack to top ↑
Development Cooperation & Global AssistanceBack to top ↑
Culture, Language & Education DiplomacyBack to top ↑
- Cultural & Language Institutes
- Creative Industries & Cultural Export Reach
- Heritage & Cultural Institutions
- Education Diplomacy & Alumni Networks
- Sports & Major Events
Diaspora & Global CommunitiesBack to top ↑
Information Environment & Strategic CommunicationBack to top ↑
- Strategic Communications & Public Diplomacy
- International Media & Broadcasting
- Information Defence & Counter-Interference
mixture of about a dozen national TV networks - 2 public broadcasters, the remainder private broadcasters - each with multiple transmitters; more than 100 local TV stations; widespread use of satellite and cable TV systems; public radio broadcaster operates 6 national networks as well as regional and local stations; overall, more than 700 radio stations with more than 650 privately operated (2008)
GINC Capability Domains · Chapter 10
Financial Strength
🇮🇩 Indonesia’s fiscal depth, reserves and the capacity to act
Monetary & Currency CapabilityBack to top ↑
- Monetary Policy & Price Stability
- Exchange Rate & External Account Management
- Currency Issuance & Digital Money
7.7% (2013 est.)//4.3% (2012 est.)
Indonesian rupiah (IDR) per US dollar -//10,341.6 (2013 est.)//9,386.63 (2012 est.)//9,090.4 (2010 est.)//10,389.9 (2009)//9,698.9 (2008)
6.37% (31 December 2010)//6.46% (31 December 2009)
12.1% (31 December 2013 est.)//11.8% (31 December 2012 est.)
$82.99 billion (31 December 2013 est.)//$87.04 billion (31 December 2012 est.)
$325 billion (31 December 2013 est.)//$342 billion (31 December 2012 est.)
Fiscal Capacity & Public FinanceBack to top ↑
- Revenue Mobilisation & Tax Administration
- Public Expenditure & Budget Management
- Sovereign Debt & Treasury Management
- Public Investment Management
15.8% of GDP (2013 est.)
-3.3% of GDP (2013 est.)
24.2% of GDP (2013 est.)//23% of GDP (2012 est.)
calendar year
Financial System Depth & AccessBack to top ↑
- Banking System Capacity
- Capital Markets Depth & Development
- Long-Term & Institutional Capital
- Financial Inclusion & Household Access
- Development & Policy Finance
$336.2 billion (31 December 2013 est.)//$350 billion (31 December 2012 est.)
$396.8 billion (31 December 2012 est.)//$390.1 billion (31 December 2011)//$360.4 billion (31 December 2010 est.)
31.5% of GDP (2013 est.)//32.6% of GDP (2012 est.)//33.1% of GDP (2011 est.)
Financial Regulation & IntegrityBack to top ↑
- Prudential Regulation & Supervision
- Financial Integrity & Illicit Finance Control
- Market Conduct & Consumer Protection
- Payment & Market Infrastructure Oversight
Financial Stability & Crisis ManagementBack to top ↑
- Macroprudential & Systemic Oversight
- Crisis Management, Resolution & Deposit Insurance
- External Liquidity & Financial Safety Nets
Sovereign Capital & External Financial PowerBack to top ↑
- Official Reserves Management
- Sovereign Wealth & Public Asset Management
- Currency Internationalisation & Reserve Status
- Capital Account & Flow Management
- International Financial Centre Capability
$83.45 billion (31 December 2013 est.)//$112.8 billion (31 December 2012 est.)
$223.8 billion (31 December 2013 est.)//$224.1 billion (31 December 2012 est.)
GINC Capability Domains · Chapter 11
Production and Innovation
🇮🇩 Indonesia’s output, industry and the engine of prosperity
Economic Output & ProductivityBack to top ↑
Indonesia, a vast polyglot nation, has grown strongly since 2010. During the global financial crisis, Indonesia outperformed its regional neighbors and joined China and India as the only G20 members posting growth. The government has promoted fiscally conservative policies, resulting in a debt-to-GDP ratio of less than 25% and historically low rates of inflation. Fitch and Moody's upgraded Indonesia's credit rating to investment grade in December 2011. Indonesia still struggles with poverty and unemployment, inadequate infrastructure, corruption, a complex regulatory environment, and unequal resource distribution among regions. The government also faces the challenges of quelling labor unrest and reducing fuel subsidies in the face of high oil prices.
$1.285 trillion (2013 est.)//$1.22 trillion (2012 est.)//$1.149 trillion (2011 est.)
5.3% (2013 est.)//6.2% (2012 est.)//6.5% (2011 est.)
$5,200 (2013 est.)//$5,000 (2012 est.)//$4,800 (2011 est.)
$867.5 billion (2013 est.)
Labour & EmploymentBack to top ↑
- Employment & Labour Force Participation
- Labour Market Institutions & Wage Setting
- Employment Services & Skills Matching
- Labour Adjustment, Transition & Formalisation
120 million (2013 est.)
6.6% (2013 est.)//6.1% (2012 est.)
Industrial & Sectoral BaseBack to top ↑
- Manufacturing & Advanced Industry
- Foundational & Process Industries
- Agrifood & Primary Production
- Services Economy
rubber and similar products, palm oil, poultry, beef, forest products, shrimp, cocoa, coffee, medicinal herbs, essential oil, fish and its similar products, and spices
petroleum and natural gas, textiles, automotive, electrical appliances, apparel, footwear, mining, cement, medical instuments and appliances, handicrafts, chemical fertilizers, plywood, rubber, processed food, jewelry, and tourism
4.3% (2013 est.)
Structural Transformation & ComplexityBack to top ↑
Business Dynamism & EntrepreneurshipBack to top ↑
- Entrepreneurship & Firm Creation
- Risk Capital & Scale-Up Finance
- Firm Growth, Exit & Renewal
- Competition & Market Contestability
Innovation & CommercialisationBack to top ↑
- Business Innovation Capability
- Research Commercialisation & Knowledge Transfer
- Intellectual Property & Intangible Assets
- Innovation Ecosystems & Clusters
Technology Adoption & DiffusionBack to top ↑
GINC Capability Domains · Chapter 12
Trade and Investment
🇮🇩 Indonesia’s markets, capital and the terms of global exchange
Overall tradeBack to top ↑
$303B of exports to 216 partners and $231B of imports from 222 in 2024, a surplus of $71.1B.
- Exports
- $303B216 partners
- Imports
- $231B222 partners
- Balance
- +$71.1Bsurplus
- Total trade
- $534B2024
ExportsBack to top ↑
Where its exports go
The largest partners in 2024, with each one's share of the nation's exports.
| Partner | Value | Share | |
|---|---|---|---|
| China | $68.0B | 22% | |
| United States | $29.7B | 9.8% | |
| India | $24.4B | 8.1% | |
| Japan | $22.4B | 7.4% | |
| Singapore | $15.1B | 5.0% | |
| Malaysia | $13.6B | 4.5% | |
| South Korea | $12.6B | 4.2% | |
| Philippines | $11.6B | 3.8% | |
| Vietnam | $9.51B | 3.1% | |
| Thailand | $8.57B | 2.8% | |
| Taiwan | $7.85B | 2.6% | |
| Australia | $5.40B | 1.8% | |
| Germany | $4.44B | 1.5% | |
| Netherlands | $3.87B | 1.3% | |
| Saudi Arabia | $3.66B | 1.2% | |
| Hong Kong | $3.25B | 1.1% | |
| Pakistan | $3.19B | 1.1% | |
| United Arab Emirates | $3.07B | 1.0% | |
| Bangladesh | $3.04B | 1.0% | |
| Mexico | $2.94B | 1.0% |
What it exports
The largest categories in 2024.
| Category | Value | Share | |
|---|---|---|---|
| Mineral fuels, oils, distillation products | $63.0B | 21% | |
| Animal, vegetable fats and oils, cleavage products | $35.4B | 12% | |
| Iron and steel | $25.9B | 8.6% | |
| Electrical, electronic equipment | $21.0B | 6.9% | |
| Vehicles other than railway, tramway | $12.0B | 4.0% | |
| Footwear, gaiters and the like | $10.4B | 3.4% | |
| Machinery, nuclear reactors, boilers | $9.66B | 3.2% | |
| Ores slag and ash | $9.64B | 3.2% | |
| Pearls, precious stones, metals, coins | $9.13B | 3.0% | |
| Nickel | $8.72B | 2.9% | |
| Rubbers | $6.34B | 2.1% | |
| Articles of apparel, not knit or crocheted | $5.09B | 1.7% | |
| Paper and paperboard, articles of pulp, paper and board | $5.03B | 1.7% | |
| Articles of apparel, knit or crocheted | $4.68B | 1.5% | |
| Wood and articles of wood, wood charcoal | $4.48B | 1.5% |
ImportsBack to top ↑
Where its imports come from
The largest partners in 2024, with each one's share of the nation's imports.
| Partner | Value | Share | |
|---|---|---|---|
| China | $75.0B | 32% | |
| Singapore | $20.9B | 9.0% | |
| Japan | $14.2B | 6.2% | |
| United States | $11.7B | 5.0% | |
| Malaysia | $10.8B | 4.6% | |
| Australia | $10.1B | 4.4% | |
| Thailand | $9.74B | 4.2% | |
| South Korea | $8.89B | 3.8% | |
| Vietnam | $6.48B | 2.8% | |
| India | $6.04B | 2.6% | |
| Brazil | $5.10B | 2.2% | |
| Saudi Arabia | $4.21B | 1.8% | |
| Taiwan | $3.92B | 1.7% | |
| Germany | $3.53B | 1.5% | |
| Hong Kong | $3.15B | 1.4% | |
| Nigeria | $2.62B | 1.1% | |
| Russia | $2.24B | 1.0% | |
| United Arab Emirates | $1.99B | 0.9% | |
| Canada | $1.98B | 0.9% | |
| Philippines | $1.77B | 0.8% |
What it imports
The largest categories in 2024.
| Category | Value | Share | |
|---|---|---|---|
| Mineral fuels, oils, distillation products | $38.9B | 17% | |
| Machinery, nuclear reactors, boilers | $32.8B | 14% | |
| Electrical, electronic equipment | $27.0B | 12% | |
| Plastics | $10.9B | 4.7% | |
| Iron and steel | $10.3B | 4.5% | |
| Vehicles other than railway, tramway | $9.99B | 4.3% | |
| Organic chemicals | $7.07B | 3.1% | |
| Cereals | $6.43B | 2.8% | |
| Articles of iron or steel | $5.28B | 2.3% | |
| Pearls, precious stones, metals, coins | $4.65B | 2.0% | |
| Optical, photo, technical, medical apparatus | $4.24B | 1.8% | |
| Miscellaneous chemical products | $3.50B | 1.5% | |
| Residues, wastes of food industry, animal fodder | $3.44B | 1.5% | |
| Sugars and sugar confectionery | $3.39B | 1.5% | |
| Inorganic chemicals, precious metal compound, isotope | $3.22B | 1.4% |
In a list, the bar runs to the largest in that list. The line is each figure’s history from 2000, drawn to its own peak: it shows the shape of the years, and the value shows the size.
External balanceBack to top ↑
-$28.72 billion (2013 est.)//-$24.07 billion (2012 est.)
Trade Facilitation & LogisticsBack to top ↑
Trade Policy & Market AccessBack to top ↑
- Trade Policy & Negotiation Capability
- Market Access & Agreements Network
- Trade Law & Enforcement
- Standards, Conformity & Quality Infrastructure
Digital & Services TradeBack to top ↑
- Services Trade Capability
- Digital Trade & E-Commerce
- Data Flows & Digital Trade Governance
- Tourism & Visitor Economy
Investment Attraction & ProjectionBack to top ↑
- Investment Attraction & Facilitation
- Investment Absorption & Linkages
- Outward Investment & Global Corporate Presence
$207.2 billion (31 December 2013 est.)//$192.7 billion (31 December 2012 est.)
$17.41 billion (31 December 2013 est.)//$14.81 billion (31 December 2012 est.)
Export Capability & SophisticationBack to top ↑
$178.9 billion (2013 est.)//$187.3 billion (2012 est.)
Japan 15.9%, China 11.4%, Singapore 9%, South Korea 7.9%, US 7.8%, India 6.6%, Malaysia 5.9% (2012)
oil and gas, electrical appliances, plywood, textiles, rubber
Global Value Chain PositionBack to top ↑
- Value Chain Participation & Integration
- Value Chain Position & Upgrading
- Regional Integration & Hub Anchoring
Economic Leverage & DependenceBack to top ↑
- Strategic Supply Security
- Concentration Risk & Revenue Stabilisation
- Economic Leverage & Coercion Resistance
$178.6 billion (2013 est.)//$178.7 billion (2012 est.)
China 15.3%, Singapore 13.6%, Japan 11.9%, Malaysia 6.4%, South Korea 6.2%, US 6.1%, Thailand 6% (2012)
machinery and equipment, chemicals, fuels, foodstuffs
Indonesia · you are in
Historical Context
Foundations
GINC Capability Domains
Find in this brief · Indonesia