
Nigeria
Nigeria is a federal republic in Africa, home to 177 million people, with its capital at Abuja.
Contents
12 chapters
Foundations
01–03
At a glance
- Area
- 923.8Kkm²#32 World#14 Africa
- Population
- 177.2M#7 World#1 Africa
- GDP (market)
- $502B
- GDP (PPP)
- $478.5B#30 World#3 Africa
- GDP per capita
- $2.8K#180 World#19 Africa
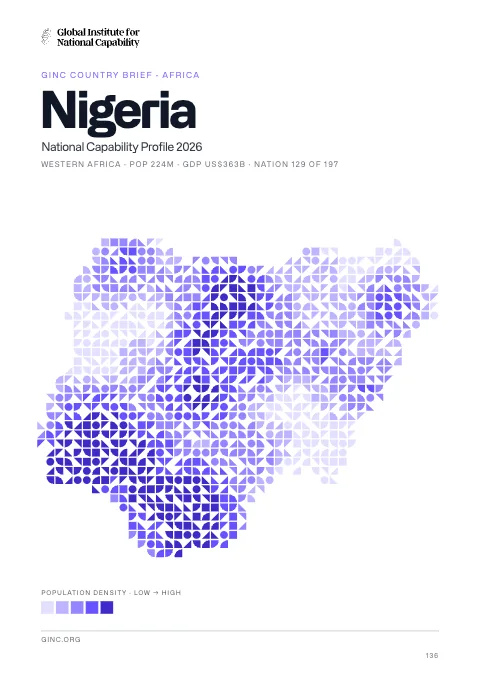
The whole brief
Nigeria National Capability Profile 2026
Foundations · Chapter 01
Historical Context
🇳🇬 Nigeria’s understanding the origins and evolution of the modern nation
BackgroundBack to top ↑
British influence and control over what would become Nigeria and Africa's most populous country grew through the 19th century. A series of constitutions after World War II granted Nigeria greater autonomy; independence came in 1960. Following nearly 16 years of military rule, a new constitution was adopted in 1999, and a peaceful transition to civilian government was completed. The government continues to face the daunting task of reforming a petroleum-based economy, whose revenues have been squandered through corruption and mismanagement, and institutionalizing democracy. In addition, Nigeria continues to experience longstanding ethnic and religious tensions. Although both the 2003 and 2007 presidential elections were marred by significant irregularities and violence, Nigeria is currently experiencing its longest period of civilian rule since independence. The general elections of April 2007 marked the first civilian-to-civilian transfer of power in the country's history and the elections of 2011 were generally regarded as credible. In January 2014, Nigeria assumed a nonpermanent seat on the UN Security Council for the 2014-15 term.
IndependenceBack to top ↑
1 October 1960 (from the UK)
National holidayBack to top ↑
Independence Day (National Day), 1 October (1960)
Foundations · Chapter 02
Geography
🇳🇬 Nigeria’s territory, resources and strategic position
Location and areaBack to top ↑
Western Africa, bordering the Gulf of Guinea, between Benin and Cameroon
10 00 N, 8 00 E
Africa
slightly more than twice the size of California
853 km
Terrain and resourcesBack to top ↑
southern lowlands merge into central hills and plateaus; mountains in southeast, plains in north
natural gas, petroleum, tin, iron ore, coal, limestone, niobium, lead, zinc, arable land
2,932 sq km (2004)
Settlement and hazardsBack to top ↑
periodic droughts; flooding
the Niger enters the country in the northwest and flows southward through tropical rain forests and swamps to its delta in the Gulf of Guinea
OtherBack to top ↑
286.2 cu km (2011)
soil degradation; rapid deforestation; urban air and water pollution; desertification; oil pollution - water, air, and soil; has suffered serious damage from oil spills; loss of arable land; rapid urbanization
Foundations · Chapter 03
Environment
🇳🇬 Nigeria’s environmental conditions, resources and national resilience
ClimateBack to top ↑
varies; equatorial in south, tropical in center, arid in north
Emissions and pollutionBack to top ↑
Water, waste and foodBack to top ↑
Resources and agreementsBack to top ↑
GINC Capability Domains · Chapter 04
Critical Technology
🇳🇬 Nigeria’s technology frontiers and the pursuit of national advantage
Two counts are set side by side for 2015–2024: on the left, the papers researchers in Nigeria published; on the right, the patent families that began there and were filed in more than one country. First by capability group, then group by group with each group’s capabilities. The badge on a card is the nation’s place among all nations. Papers are from GINC Research Analytics, patent families from GINC Patents.
Research by capability group
#50 WorldPapers published, 2015–2024
2,143
1,301
728
530
479
347
118
96
85
8
Patents by capability group
#97 WorldInternational patent families, 2015–2024
Advanced Materials & ManufacturingBack to top ↑
Research
#57 WorldPapers published, 2015–2024
Patents
International patent families, 2015–2024
No international patent families on record for 2015–2024.
Energy TechnologiesBack to top ↑
Research
#48 WorldPapers published, 2015–2024
Patents
#98 WorldInternational patent families, 2015–2024
Semiconductors & Advanced ComputingBack to top ↑
Research
#54 WorldPapers published, 2015–2024
No research topic: Semiconductor Design & EDA · Advanced Semiconductor Fabrication · Semiconductor Equipment & Materials · Advanced Packaging & Heterogeneous Integration
Patents
International patent families, 2015–2024
No international patent families on record for 2015–2024.
Artificial IntelligenceBack to top ↑
Research
#43 WorldPapers published, 2015–2024
Patents
#89 WorldInternational patent families, 2015–2024
Quantum TechnologiesBack to top ↑
Research
#58 WorldPapers published, 2015–2024
Patents
International patent families, 2015–2024
No international patent families on record for 2015–2024.
Connectivity, Cyber & Trust TechnologiesBack to top ↑
Research
#49 WorldPapers published, 2015–2024
Patents
#74 WorldInternational patent families, 2015–2024
Sensing, Timing & NavigationBack to top ↑
Research
#62 WorldPapers published, 2015–2024
Patents
International patent families, 2015–2024
No international patent families on record for 2015–2024.
Robotics & Autonomous SystemsBack to top ↑
Research
#58 WorldPapers published, 2015–2024
No research topic: Human-Machine Interfaces
Patents
International patent families, 2015–2024
No international patent families on record for 2015–2024.
Biotechnology & Health TechnologiesBack to top ↑
Research
#32 WorldPapers published, 2015–2024
Patents
#94 WorldInternational patent families, 2015–2024
Medicine and BioTech
Clinical research and life-science invention, drawn from the same series that drive the metric pages. Each card opens the full cross-country comparison.
Space TechnologiesBack to top ↑
Research
#53 WorldPapers published, 2015–2024
Patents
International patent families, 2015–2024
No international patent families on record for 2015–2024.
GINC Capability Domains · Chapter 05
Strategic Infrastructure
🇳🇬 Nigeria’s energy, connectivity and the material foundations of capability
Resource InfrastructureBack to top ↑
2.524 million bbl/day (2012 est.)
2.341 million bbl/day (2010 est.)
0 bbl/day (2010 est.)
37.2 billion bbl (1 January 2013 est.)
101,300 bbl/day (2010 est.)
271,600 bbl/day (2011 est.)
18,750 bbl/day (2010 est.)
151,700 bbl/day (2010 est.)
31.36 billion cu m (2011 est.)
5.03 billion cu m (2010 est.)
25.96 billion cu m (2011 est.)
0 cu m (2011 est.)
5.153 trillion cu m (1 January 2013 est.)
condensate 124 km; gas 4,045 km; liquid petroleum gas 164 km; oil 4,441 km; refined products 3,940 km (2013)
Agriculture & Food InfrastructureBack to top ↑
- Irrigation & Agricultural Water
- Livestock & Veterinary
- Fisheries & Aquaculture
- Storage, Cold Chain & Markets
Energy InfrastructureBack to top ↑
- Thermal Generation
- Nuclear Generation
- Nuclear Fuel Cycle & Radioactive Waste
- Hydropower
- Renewable Generation
- Transmission & Distribution
- System Control & Dispatch
- Storage & Fuel Supply
5.9 million kW (2010 est.)
24.87 billion kWh (2010 est.)
20.38 billion kWh (2010 est.)
0 kWh (2012 est.)
0 kWh (2012 est.)
67.1% of total installed capacity (2010 est.)
0% of total installed capacity (2010 est.)
32.8% of total installed capacity (2010 est.)
0% of total installed capacity (2010 est.)
75.96 million Mt (2011 est.)
Water, Sanitation & Waste InfrastructureBack to top ↑
- Dams, Reservoirs & Flood Defence
- Water Supply & Treatment
- Bulk Water Transfer & Desalination
- Wastewater & Sanitation
- Solid Waste & Recycling
Advanced ManufacturingBack to top ↑
- Materials & Inputs
- Chemicals & Hazardous Process Industry
- Production Systems
- Supply Chain & Ecosystem
- Workforce & Innovation
Transport InfrastructureBack to top ↑
- Seaports & Terminals
- Air Infrastructure
- Air Navigation & Traffic Management
- Inland Waterways & Ferries
- Rail Infrastructure
- Roads & Bridges
- Logistics, Multimodal & Border Infrastructure
- Postal & Parcel
54 (2013)
5 (2013)
8,600 km (Niger and Benue rivers and smaller rivers and creeks) (2011)
the International Maritime Bureau reports the territorial and offshore waters in the Niger Delta and Gulf of Guinea as high risk for piracy and armed robbery against ships; in 2012, 27 commercial vessels were boarded or attacked compared with 10 attacks in 2011; crews were robbed and stores or cargoes stolen; Nigerian pirates have extended the range of their attacks to as far away as Cote d'Ivoire
Communications & Digital InfrastructureBack to top ↑
- Subsea Cables & International Gateways
- Core & Backbone Networks
- Mobile & Wireless Networks
- Spectrum & Broadcasting
- Data Centres, Compute & Cloud
- Data Resources
- AI Tools & Applications
418,200 (2012)
112.78 million (2012)
43.989 million (2009)
1,234 (2012)
.ng
Financial InfrastructureBack to top ↑
- Currency & Reserves
- Payments & Settlement Systems
- Markets, Exchanges & Depositories
- Banks, Insurers & Systemic Institutions
Social InfrastructureBack to top ↑
- Health Infrastructure
- Public Health & Laboratories
- Medical Supply & Stockpiles
- Education & Skills Infrastructure
- Research & Scientific Facilities
- Housing, Community & Social Services
- Government & Public Administration
- Cultural, Community & Recreational Infrastructure
- Justice & Corrections
- Emergency Services & Civil Protection
- Hydrometeorology & Early Warning
Space, Aerospace & Defence InfrastructureBack to top ↑
GINC Capability Domains · Chapter 06
National Security
🇳🇬 Nigeria’s force, intelligence and the defence of the nation
Disputes and terrorismBack to top ↑
Joint Border Commission with Cameroon reviewed 2002 ICJ ruling on the entire boundary and bilaterally resolved differences, including June 2006 Greentree Agreement that immediately cedes sovereignty of the Bakassi Peninsula to Cameroon with a phase-out of Nigerian control within two years while resolving patriation issues; the ICJ ruled on an equidistance settlement of Cameroon-Equatorial Guinea-Nigeria maritime boundary in the Gulf of Guinea, but imprecisely defined coordinates in the ICJ decision and a sovereignty dispute between Equatorial Guinea and Cameroon over an island at the mouth of the Ntem River all contribute to the delay in implementation; only Nigeria and Cameroon have heeded the Lake Chad Commission's admonition to ratify the delimitation treaty which also includes the Chad-Niger and Niger-Nigeria boundaries; location of Benin-Niger-Nigeria tripoint is unresolved
Force Generation & MobilisationBack to top ↑
Nigerian Armed Forces: Army, Navy, Air Force (2013)
18 years of age for voluntary military service; no conscription (2012)
0.89% of GDP (2012)//0.98% of GDP (2011)//0.89% of GDP (2010)
Forces under arms
Active-duty strength on the Correlates of War series, which reaches back to 1816 and so carries a nation’s whole record of mobilisation rather than its present establishment. The card opens the full cross-country comparison.
Intelligence & AssessmentBack to top ↑
- Imagery & Geospatial Intelligence
- Signals & Cyber Intelligence
- Technical & Measurement Intelligence
- Open-Source & Financial Intelligence
- Human Intelligence & Counterintelligence
- All-Source Analysis & Warning
Joint Command, Projection & SustainmentBack to top ↑
- Command, Control & Communications
- Strategic Lift & Mobility
- Expeditionary & Peace Operations
- Operational Sustainment & War Reserves
- Defence Industrial Mobilisation
- CBRN Defence
Land PowerBack to top ↑
- Combined Arms Manoeuvre
- Land Fires
- Battlefield Aviation & Uncrewed Systems
- Special Operations & Irregular Warfare
Maritime PowerBack to top ↑
- Maritime Security & Constabulary
- Sea Denial & Undersea Warfare
- Sea Control
- Amphibious & Expeditionary Operations
Air PowerBack to top ↑
- Air Sovereignty & Policing
- Control of the Air
- Air Strike & Interdiction
- Airborne ISR, Early Warning & Battle Management
Strategic Strike & Missile DefenceBack to top ↑
Space OperationsBack to top ↑
Cyber & Electromagnetic OperationsBack to top ↑
Nuclear DeterrenceBack to top ↑
GINC Capability Domains · Chapter 07
Human Capital
🇳🇬 Nigeria’s population, health and the skills that sustain capability
DemographyBack to top ↑
177,155,754
2.47% (2014 est.)
38.03 births/1,000 population (2014 est.)
13.16 deaths/1,000 population (2014 est.)
5.25 children born/woman (2014 est.)
20.3
14.1% (2011)
Migration and urbanisationBack to top ↑
-0.22 migrant(s)/1,000 population (2014 est.)
Lagos 11.223 million; Kano 3.375 million; Ibadan 2.949 million; ABUJA (capital) 2.153 million; Port Harcourt 1.894 million; Kaduna 1.524 million (2011)
Welfare and equityBack to top ↑
70% (2010 est.)
43.7 (2003)//50.6 (1997)
DisplacementBack to top ↑
Early Childhood DevelopmentBack to top ↑
24.4% (2011)
Foundational EducationBack to top ↑
NA
Advanced EducationBack to top ↑
Technical & Vocational SkillsBack to top ↑
Digital & AI CompetenceBack to top ↑
Generative AI adoption
Modelled share of working-age adults using generative AI, from Microsoft telemetry scaled to each country’s 15–64 population. A measure of how fast a workforce is absorbing the technology rather than of how much of it a nation builds. The card opens the full cross-country comparison.
Lifelong Learning & ReskillingBack to top ↑
Research Talent & Knowledge CreationBack to top ↑
Population HealthBack to top ↑
630 deaths/100,000 live births (2010)
6.5% (2008)
3.1% (2012 est.)
3,426,600 (2012 est.)
239,700 (2012 est.)
Health System CapabilityBack to top ↑
5.3% of GDP (2011)
0.4 physicians/1,000 population (2008)
0.53 beds/1,000 population (2004)
GINC Capability Domains · Chapter 08
Governance and Integrity
🇳🇬 Nigeria’s institutions, law and the integrity of the state
State structureBack to top ↑
federal republic
36 states and 1 territory*; Abia, Adamawa, Akwa Ibom, Anambra, Bauchi, Bayelsa, Benue, Borno, Cross River, Delta, Ebonyi, Edo, Ekiti, Enugu, Federal Capital Territory*, Gombe, Imo, Jigawa, Kaduna, Kano, Katsina, Kebbi, Kogi, Kwara, Lagos, Nasarawa, Niger, Ogun, Ondo, Osun, Oyo, Plateau, Rivers, Sokoto, Taraba, Yobe, Zamfara
several previous; latest adopted 5 May 1999, effective 29 May 1999; amended 2010 (2010)
18 years of age; universal
Political Institutions & Civic ParticipationBack to top ↑
- Electoral Management & Integrity
- Legislature & Deliberative Institutions
- Citizen Participation & Civic Space
bicameral National Assembly consists of the Senate (109 seats, 3 from each state plus 1 from Abuja; members elected by popular vote to serve four-year terms) and House of Representatives (360 seats; members elected by popular vote to serve four-year terms)
Accord Party or ACC [Mohammad Lawal MALADO]//Action Congress of Nigeria or ACN [Adebisi Bamidele AKANDE]//All Nigeria Peoples Party or ANPP [Ogbonnaya C. ONU]//All Progressives Congress [Adebisi Bamidele AKANDE, acting]//All Progressives Grand Alliance or APGA [Victor C. UMEH]//Congress for Progressive Change or CPC [Tony MOMOH]//Democratic Peoples Party or DPP [Biodun OGUNBIYI]//Labor Party [Chief Dan NWANYANWU]//Peoples Democratic Party or PDP [Adamu MU'AZU]
Academic Staff Union for Universities or ASUU//Campaign for Democracy or CD//Civil Liberties Organization or CLO//Committee for the Defense of Human Rights or CDHR//Constitutional Right Project or CRP//Human Right Africa//National Association of Democratic Lawyers or NADL//National Association of Nigerian Students or NANS//Nigerian Bar Association or NBA//Nigerian Labor Congress or NLC//Nigerian Medical Association or NMA//the press//Universal Defenders of Democracy or UDD
Justice System & Fundamental RightsBack to top ↑
- Judicial Independence & Court Capability
- Access to Justice & Legal Services
- Fundamental Rights Protection
- Human Rights Institutions & Equality Bodies
mixed legal system of English common law, Islamic law (in 12 northern states), and traditional law
accepts compulsory ICJ jurisdiction with reservations; accepts ICCt jurisdiction
Internal Security & OrderBack to top ↑
a transit point for heroin and cocaine intended for European, East Asian, and North American markets; consumer of amphetamines; safe haven for Nigerian narcotraffickers operating worldwide; major money-laundering center; massive corruption and criminal activity; Nigeria has improved some anti-money-laundering controls, resulting in its removal from the Financial Action Task Force's (FATF's) Noncooperative Countries and Territories List in June 2006; Nigeria's anti-money-laundering regime continues to be monitored by FATF
Regulatory Governance & Strategic ControlsBack to top ↑
- Regulatory Quality & Better Regulation
- Regulatory Delivery & Independent Regulators
- Strategic Controls & Economic Security Administration
Government Effectiveness & Public AdministrationBack to top ↑
- Centre of Government & Policy Coordination
- Civil Service & Public Workforce
- Digital Government & Service Delivery
- Legal Identity & Civil Registration
- Statistical & Data Capability
Public Integrity & Anti-CorruptionBack to top ↑
Transparency, Oversight & AccountabilityBack to top ↑
- Right to Information & Open Government
- Independent Oversight & Supreme Audit
- Independent Media & Journalist Safety
National Resilience & Crisis ManagementBack to top ↑
GINC Capability Domains · Chapter 09
Information and Influence
🇳🇬 Nigeria’s identity, media and the projection of influence
Identity and cultureBack to top ↑
English (official), Hausa, Yoruba, Igbo (Ibo), Fulani, over 500 additional indigenous languages
Muslim 50%, Christian 40%, indigenous beliefs 10%
Nigeria, Africa's most populous country, is composed of more than 250 ethnic groups; the following are the most populous and politically influential: Hausa and Fulani 29%, Yoruba 21%, Igbo (Ibo) 18%, Ijaw 10%, Kanuri 4%, Ibibio 3.5%, Tiv 2.5%
eagle
three equal vertical bands of green (hoist side), white, and green; the color green represents the forests and abundant natural wealth of the country, white stands for peace and unity
Diplomatic Statecraft & Global NetworksBack to top ↑
- Diplomatic Network & Consular Reach
- Multilateral Leadership & Norm Setting
- Agenda-Setting & Convening
- Mediation & Crisis Diplomacy
ACP, AfDB, AU, C, CD, D-8, ECOWAS, EITI (compliant country), FAO, G-15, G-24, G-77, IAEA, IBRD, ICAO, ICC (national committees), ICRM, IDA, IDB, IFAD, IFC, IFRCS, IHO, ILO, IMF, IMO, IMSO, Interpol, IOC, IOM, IPU, ISO, ITSO, ITU, ITUC (NGOs), MIGA, MINURSO, MINUSMA, MONUSCO, NAM, OAS (observer), OIC, OPCW, OPEC, PCA, UN, UN Security Council (temporary), UNAMID, UNCTAD, UNESCO, UNHCR, UNIDO, UNIFIL, UNISFA, UNITAR, UNMIL, UNMISS, UNOCI, UNWTO, UPU, WCO, WFTU (NGOs), WHO, WIPO, WMO, WTO
Alliances & Security CooperationBack to top ↑
Development Cooperation & Global AssistanceBack to top ↑
Culture, Language & Education DiplomacyBack to top ↑
- Cultural & Language Institutes
- Creative Industries & Cultural Export Reach
- Heritage & Cultural Institutions
- Education Diplomacy & Alumni Networks
- Sports & Major Events
Diaspora & Global CommunitiesBack to top ↑
Information Environment & Strategic CommunicationBack to top ↑
- Strategic Communications & Public Diplomacy
- International Media & Broadcasting
- Information Defence & Counter-Interference
nearly 70 federal government-controlled national and regional TV stations; all 36 states operate TV stations; several private TV stations operational; cable and satellite TV subscription services are available; network of federal government-controlled national, regional, and state radio stations; roughly 40 state government-owned radio stations typically carry their own programs except for news broadcasts; about 20 private radio stations; transmissions of international broadcasters are available (2007)
GINC Capability Domains · Chapter 10
Financial Strength
🇳🇬 Nigeria’s fiscal depth, reserves and the capacity to act
Monetary & Currency CapabilityBack to top ↑
- Monetary Policy & Price Stability
- Exchange Rate & External Account Management
- Currency Issuance & Digital Money
8.7% (2013 est.)//12.2% (2012 est.)
nairas (NGN) per US dollar -//156.8 (2013 est.)//156.81 (2012 est.)//150.3 (2010 est.)//148.9 (2009)//117.8 (2008)
4.25% (31 December 2010 est.)//6% (31 December 2009 est.)
15.5% (31 December 2013 est.)//16.79% (31 December 2012 est.)
$46.48 billion (31 December 2013 est.)//$44.41 billion (31 December 2012 est.)
$98.75 billion (31 December 2013 est.)//$96.34 billion (31 December 2012 est.)
Fiscal Capacity & Public FinanceBack to top ↑
- Revenue Mobilisation & Tax Administration
- Public Expenditure & Budget Management
- Sovereign Debt & Treasury Management
- Public Investment Management
4.8% of GDP (2013 est.)
-1.5% of GDP (2013 est.)
19.3% of GDP (2013 est.)//17.9% of GDP (2012 est.)
calendar year
Financial System Depth & AccessBack to top ↑
- Banking System Capacity
- Capital Markets Depth & Development
- Long-Term & Institutional Capital
- Financial Inclusion & Household Access
- Development & Policy Finance
$93.46 billion (31 December 2013 est.)//$93.5 billion (31 December 2012 est.)
$56.39 billion (31 December 2012 est.)//$39.27 billion (31 December 2011)//$50.88 billion (31 December 2010 est.)
15.5% of GDP (2013 est.)//15.9% of GDP (2012 est.)//15.4% of GDP (2011 est.)
Financial Regulation & IntegrityBack to top ↑
- Prudential Regulation & Supervision
- Financial Integrity & Illicit Finance Control
- Market Conduct & Consumer Protection
- Payment & Market Infrastructure Oversight
Financial Stability & Crisis ManagementBack to top ↑
- Macroprudential & Systemic Oversight
- Crisis Management, Resolution & Deposit Insurance
- External Liquidity & Financial Safety Nets
Sovereign Capital & External Financial PowerBack to top ↑
- Official Reserves Management
- Sovereign Wealth & Public Asset Management
- Currency Internationalisation & Reserve Status
- Capital Account & Flow Management
- International Financial Centre Capability
$47.7 billion (31 December 2013 est.)//$46.41 billion (31 December 2012 est.)
$15.73 billion (31 December 2013 est.)//$13.4 billion (31 December 2012 est.)
GINC Capability Domains · Chapter 11
Production and Innovation
🇳🇬 Nigeria’s output, industry and the engine of prosperity
Economic Output & ProductivityBack to top ↑
Following an April 2014 statistical "rebasing" exercise, Nigeria has emerged as Africa's largest economy, with 2013 GDP estimated at US$ 502 billion. Oil has been a dominant source of government revenues since the 1970s. Regulatory constraints and security risks have limited new investment in oil and natural gas, and Nigeria's oil production contracted in 2012 and 2013. Nevertheless, the Nigerian economy has continued to grow at a rapid 6-8% per annum (pre-rebasing), driven by growth in agriculture, telecommunications, and services, and the medium-term outlook for Nigeria is good, assuming oil output stabilizes and oil prices remain strong. Fiscal authorities pursued countercyclical policies in 2011-2013, significantly reducing the budget deficit. Monetary policy has also been responsive and effective. Following the 2008-9 global financial crises, the banking sector was effectively recapitalized and regulation enhanced. Despite its strong fundamentals, oil-rich Nigeria has been hobbled by inadequate power supply, lack of infrastructure, delays in the passage of legislative reforms, an inefficient property registration system, restrictive trade policies, an inconsistent regulatory environment, a slow and ineffective judicial system, unreliable dispute resolution mechanisms, insecurity, and pervasive corruption. Economic diversification and strong growth have not translated into a significant decline in poverty levels - over 62% of Nigeria's 170 million people live in extreme poverty. President JONATHAN has established an economic team that includes experienced and reputable members and has announced plans to increase transparency, continue to diversify production, and further improve fiscal management. The government is working to develop stronger public-private partnerships for roads, agriculture, and power.
$478.5 billion (2013 est.)//$450.4 billion (2012 est.)//$422.6 billion (2011 est.)
6.2% (2013 est.)//6.6% (2012 est.)//7.4% (2011 est.)
$2,800 (2013 est.)//$2,700 (2012 est.)//$2,600 (2011 est.)
$502 billion (2013 est.)
Labour & EmploymentBack to top ↑
- Employment & Labour Force Participation
- Labour Market Institutions & Wage Setting
- Employment Services & Skills Matching
- Labour Adjustment, Transition & Formalisation
51.53 million (2011 est.)
23.9% (2011 est.)//4.9% (2007 est.)
Industrial & Sectoral BaseBack to top ↑
- Manufacturing & Advanced Industry
- Foundational & Process Industries
- Agrifood & Primary Production
- Services Economy
cocoa, peanuts, cotton, palm oil, corn, rice, sorghum, millet, cassava (manioc, tapioca), yams, rubber; cattle, sheep, goats, pigs; timber; fish
crude oil, coal, tin, columbite; rubber products, wood; hides and skins, textiles, cement and other construction materials, food products, footwear, chemicals, fertilizer, printing, ceramics, steel
0.9% (2013 est.)
Structural Transformation & ComplexityBack to top ↑
Business Dynamism & EntrepreneurshipBack to top ↑
- Entrepreneurship & Firm Creation
- Risk Capital & Scale-Up Finance
- Firm Growth, Exit & Renewal
- Competition & Market Contestability
Innovation & CommercialisationBack to top ↑
- Business Innovation Capability
- Research Commercialisation & Knowledge Transfer
- Intellectual Property & Intangible Assets
- Innovation Ecosystems & Clusters
Technology Adoption & DiffusionBack to top ↑
GINC Capability Domains · Chapter 12
Trade and Investment
🇳🇬 Nigeria’s markets, capital and the terms of global exchange
Overall tradeBack to top ↑
$64.0B of exports to 162 partners and $48.1B of imports from 194 in 2024, a surplus of $15.9B.
- Exports
- $64.0B162 partners
- Imports
- $48.1B194 partners
- Balance
- +$15.9Bsurplus
- Total trade
- $112B2024
ExportsBack to top ↑
Where its exports go
The largest partners in 2024, with each one's share of the nation's exports.
| Partner | Value | Share | |
|---|---|---|---|
| Spain | $6.53B | 10% | |
| India | $6.25B | 9.8% | |
| United States | $6.01B | 9.4% | |
| France | $4.82B | 7.5% | |
| China | $3.56B | 5.6% | |
| Netherlands | $3.27B | 5.1% | |
| Indonesia | $2.62B | 4.1% | |
| South Africa | $2.55B | 4.0% | |
| Ivory Coast | $2.36B | 3.7% | |
| Italy | $2.03B | 3.2% | |
| Germany | $2.02B | 3.2% | |
| South Korea | $1.82B | 2.8% | |
| United Kingdom | $1.56B | 2.4% | |
| Canada | $1.43B | 2.2% | |
| Brazil | $1.33B | 2.1% | |
| Portugal | $1.23B | 1.9% | |
| Malaysia | $1.13B | 1.8% | |
| Thailand | $1.08B | 1.7% | |
| Switzerland | $928M | 1.5% | |
| Japan | $848M | 1.3% |
What it exports
The largest categories in 2024.
| Category | Value | Share | |
|---|---|---|---|
| Mineral fuels, oils, distillation products | $54.8B | 86% | |
| Cocoa and cocoa preparations | $2.49B | 3.9% | |
| Fertilizers | $1.01B | 1.6% | |
| Oil seed, oleaginous fruits, grain, seed, fruits | $849M | 1.3% | |
| Ores slag and ash | $722M | 1.1% | |
| Ships, boats, and other floating structures | $679M | 1.1% | |
| Copper | $458M | 0.7% | |
| Pearls, precious stones, metals, coins | $394M | 0.6% | |
| Aluminum | $355M | 0.6% | |
| Edible fruits, nuts, peel of citrus fruit, melons | $322M | 0.5% | |
| Salt, sulphur, earth, stone, plaster, lime and cement | $299M | 0.5% | |
| Residues, wastes of food industry, animal fodder | $267M | 0.4% | |
| Lead | $116M | 0.2% | |
| Plastics | $98.0M | 0.2% | |
| Rubbers | $85.2M | 0.1% |
ImportsBack to top ↑
Where its imports come from
The largest partners in 2024, with each one's share of the nation's imports.
| Partner | Value | Share | |
|---|---|---|---|
| China | $14.3B | 30% | |
| Belgium | $4.52B | 9.4% | |
| United States | $4.33B | 9.0% | |
| India | $2.69B | 5.6% | |
| Netherlands | $1.66B | 3.4% | |
| United Kingdom | $1.54B | 3.2% | |
| United Arab Emirates | $1.49B | 3.1% | |
| Saudi Arabia | $1.09B | 2.3% | |
| Brazil | $1.04B | 2.2% | |
| Norway | $979M | 2.0% | |
| Germany | $961M | 2.0% | |
| Malta | $818M | 1.7% | |
| France | $776M | 1.6% | |
| Turkey | $700M | 1.5% | |
| South Korea | $698M | 1.5% | |
| Russia | $671M | 1.4% | |
| Italy | $623M | 1.3% | |
| Lithuania | $565M | 1.2% | |
| Malaysia | $550M | 1.1% | |
| Spain | $546M | 1.1% |
What it imports
The largest categories in 2024.
| Category | Value | Share | |
|---|---|---|---|
| Mineral fuels, oils, distillation products | $13.5B | 28% | |
| Machinery, nuclear reactors, boilers | $4.78B | 9.9% | |
| Electrical, electronic equipment | $3.08B | 6.4% | |
| Vehicles other than railway, tramway | $3.03B | 6.3% | |
| Cereals | $2.38B | 5.0% | |
| Plastics | $2.36B | 4.9% | |
| Articles of iron or steel | $1.16B | 2.4% | |
| Organic chemicals | $863M | 1.8% | |
| Pharmaceutical products | $852M | 1.8% | |
| Sugars and sugar confectionery | $796M | 1.7% | |
| Fish, crustaceans, molluscs, aquatics invertebrates | $750M | 1.6% | |
| Iron and steel | $603M | 1.3% | |
| Furniture, lighting signs, prefabricated buildings | $598M | 1.2% | |
| Aluminum | $573M | 1.2% | |
| Miscellaneous chemical products | $550M | 1.1% |
In a list, the bar runs to the largest in that list. The line is each figure’s history from 2000, drawn to its own peak: it shows the shape of the years, and the value shows the size.
External balanceBack to top ↑
$16.16 billion (2013 est.)//$20.35 billion (2012 est.)
Trade Facilitation & LogisticsBack to top ↑
Trade Policy & Market AccessBack to top ↑
- Trade Policy & Negotiation Capability
- Market Access & Agreements Network
- Trade Law & Enforcement
- Standards, Conformity & Quality Infrastructure
Digital & Services TradeBack to top ↑
- Services Trade Capability
- Digital Trade & E-Commerce
- Data Flows & Digital Trade Governance
- Tourism & Visitor Economy
Investment Attraction & ProjectionBack to top ↑
- Investment Attraction & Facilitation
- Investment Absorption & Linkages
- Outward Investment & Global Corporate Presence
$84.56 billion (31 December 2013 est.)//$76.75 billion (31 December 2012 est.)
$9.212 billion (31 December 2013 est.)//$7.444 billion (31 December 2012 est.)
Export Capability & SophisticationBack to top ↑
$93.55 billion (2013 est.)//$95.68 billion (2012 est.)
US 16.8%, India 11.5%, Netherlands 8.6%, Spain 7.8%, Brazil 7.6%, UK 5.1%, Germany 4.9%, Japan 4.1%, France 4.1% (2012)
petroleum and petroleum products 95%, cocoa, rubber
Global Value Chain PositionBack to top ↑
- Value Chain Participation & Integration
- Value Chain Position & Upgrading
- Regional Integration & Hub Anchoring
Economic Leverage & DependenceBack to top ↑
- Strategic Supply Security
- Concentration Risk & Revenue Stabilisation
- Economic Leverage & Coercion Resistance
$55.98 billion (2013 est.)//$53.36 billion (2012 est.)
China 18.3%, US 10.1%, India 5.5% (2012)
machinery, chemicals, transport equipment, manufactured goods, food and live animals
Nigeria · you are in
Historical Context
Foundations
GINC Capability Domains
Find in this brief · Nigeria