
South Africa
South Africa is a republic in Africa, home to 48 million people, with its capital at Pretoria.
Contents
12 chapters
Foundations
01–03
At a glance
- Area
- 1.2Mkm²#25 World#9 Africa
- Population
- 48.4M#27 World#6 Africa
- GDP (market)
- $354B
- GDP (PPP)
- $595.7B#25 World#1 Africa
- GDP per capita
- $11.5K#109 World#6 Africa
The whole brief
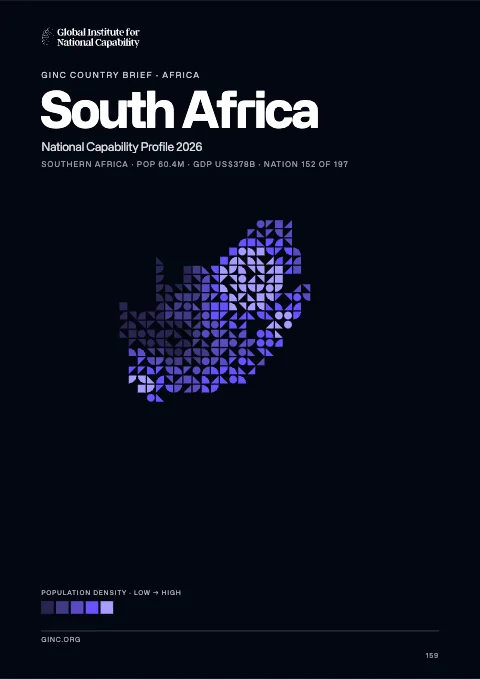
South Africa National Capability Profile 2026
Foundations · Chapter 01
Historical Context
🇿🇦 South Africa’s understanding the origins and evolution of the modern nation
BackgroundBack to top ↑
Dutch traders landed at the southern tip of modern day South Africa in 1652 and established a stopover point on the spice route between the Netherlands and the Far East, founding the city of Cape Town. After the British seized the Cape of Good Hope area in 1806, many of the Dutch settlers (the Boers) trekked north to found their own republics. The discovery of diamonds (1867) and gold (1886) spurred wealth and immigration and intensified the subjugation of the native inhabitants. The Boers resisted British encroachments but were defeated in the Second Anglo Boer War (1899-1902); however, the British and the Afrikaners, as the Boers became known, ruled together beginning in 1910 under the Union of South Africa, which became a republic in 1961 after a whites-only referendum. In 1948, the National Party was voted into power and instituted a policy of apartheid - the separate development of the races - which favored the white minority at the expense of the black majority. The African National Congress (ANC) led the opposition to apartheid and many top ANC leaders, such as Nelson MANDELA, spent decades in South Africa's prisons. Internal protests and insurgency, as well as boycotts by some Western nations and institutions, led to the regime's eventual willingness to negotiate a peaceful transition to majority rule. The first multi-racial elections in 1994 brought an end to apartheid and ushered in majority rule under an ANC-led government. South Africa since then has struggled to address apartheid-era imbalances in decent housing, education, and health care. ANC infighting, which has grown in recent years, came to a head in September 2008 when President Thabo MBEKI resigned, and Kgalema MOTLANTHE, the party's General-Secretary, succeeded him as interim president. Jacob ZUMA became president after the ANC won general elections in April 2009. National presidential and parliamentary elections are scheduled for May 2014.
IndependenceBack to top ↑
31 May 1910 (Union of South Africa formed from four British colonies: Cape Colony, Natal, Transvaal, and Orange Free State); 31 May 1961 (republic declared); 27 April 1994 (majority rule)
National holidayBack to top ↑
Freedom Day, 27 April (1994)
Foundations · Chapter 02
Geography
🇿🇦 South Africa’s territory, resources and strategic position
Location and areaBack to top ↑
Southern Africa, at the southern tip of the continent of Africa
29 00 S, 24 00 E
Africa
slightly less than twice the size of Texas
2,798 km
Terrain and resourcesBack to top ↑
vast interior plateau rimmed by rugged hills and narrow coastal plain
gold, chromium, antimony, coal, iron ore, manganese, nickel, phosphates, tin, rare earth elements, uranium, gem diamonds, platinum, copper, vanadium, salt, natural gas
16,700 sq km (2012)
Settlement and hazardsBack to top ↑
prolonged droughts
South Africa completely surrounds Lesotho and almost completely surrounds Swaziland
OtherBack to top ↑
51.4 cu km (2011)
lack of important arterial rivers or lakes requires extensive water conservation and control measures; growth in water usage outpacing supply; pollution of rivers from agricultural runoff and urban discharge; air pollution resulting in acid rain; soil erosion; desertification
Foundations · Chapter 03
Environment
🇿🇦 South Africa’s environmental conditions, resources and national resilience
ClimateBack to top ↑
mostly semiarid; subtropical along east coast; sunny days, cool nights
Emissions and pollutionBack to top ↑
Water, waste and foodBack to top ↑
Resources and agreementsBack to top ↑
GINC Capability Domains · Chapter 04
Critical Technology
🇿🇦 South Africa’s technology frontiers and the pursuit of national advantage
Two counts are set side by side for 2015–2024: on the left, the papers researchers in South Africa published; on the right, the patent families that began there and were filed in more than one country. First by capability group, then group by group with each group’s capabilities. The badge on a card is the nation’s place among all nations. Papers are from GINC Research Analytics, patent families from GINC Patents.
Research by capability group
#44 WorldPapers published, 2015–2024
1,988
1,724
1,375
872
613
397
344
241
144
32
Patents by capability group
#38 WorldInternational patent families, 2015–2024
110
96
72
69
64
37
18
14
7
3
Advanced Materials & ManufacturingBack to top ↑
Research
#41 WorldPapers published, 2015–2024
Patents
#40 WorldInternational patent families, 2015–2024
Energy TechnologiesBack to top ↑
Research
#39 WorldPapers published, 2015–2024
Patents
#37 WorldInternational patent families, 2015–2024
Semiconductors & Advanced ComputingBack to top ↑
Research
#49 WorldPapers published, 2015–2024
No research topic: Semiconductor Design & EDA · Advanced Semiconductor Fabrication · Semiconductor Equipment & Materials · Advanced Packaging & Heterogeneous Integration
Patents
#46 WorldInternational patent families, 2015–2024
Artificial IntelligenceBack to top ↑
Research
#50 WorldPapers published, 2015–2024
Patents
#38 WorldInternational patent families, 2015–2024
Quantum TechnologiesBack to top ↑
Research
#41 WorldPapers published, 2015–2024
Patents
#31 WorldInternational patent families, 2015–2024
Connectivity, Cyber & Trust TechnologiesBack to top ↑
Research
#41 WorldPapers published, 2015–2024
Patents
#36 WorldInternational patent families, 2015–2024
Sensing, Timing & NavigationBack to top ↑
Research
#40 WorldPapers published, 2015–2024
Patents
#42 WorldInternational patent families, 2015–2024
Robotics & Autonomous SystemsBack to top ↑
Research
#56 WorldPapers published, 2015–2024
No research topic: Human-Machine Interfaces
Patents
#42 WorldInternational patent families, 2015–2024
Biotechnology & Health TechnologiesBack to top ↑
Research
#22 WorldPapers published, 2015–2024
Patents
#37 WorldInternational patent families, 2015–2024
Medicine and BioTech
Clinical research and life-science invention, drawn from the same series that drive the metric pages. Each card opens the full cross-country comparison.
Space TechnologiesBack to top ↑
Research
#27 WorldPapers published, 2015–2024
Patents
#33 WorldInternational patent families, 2015–2024
GINC Capability Domains · Chapter 05
Strategic Infrastructure
🇿🇦 South Africa’s energy, connectivity and the material foundations of capability
Resource InfrastructureBack to top ↑
181,000 bbl/day (2012 est.)
0 bbl/day (2010 est.)
385,100 bbl/day (2010 est.)
15 million bbl (1 January 2013 est.)
437,600 bbl/day (2010 est.)
590,900 bbl/day (2011 est.)
80,460 bbl/day (2010 est.)
79,010 bbl/day (2010 est.)
1.28 billion cu m (2011 est.)
4.01 billion cu m (2010 est.)
0 cu m (2011 est.)
3.3 billion cu m (2011 est.)
16 billion cu m (1 January 2012 est.)
condensate 94 km; gas 1,293 km; oil 992 km; refined products 1,460 km (2013)
Agriculture & Food InfrastructureBack to top ↑
- Irrigation & Agricultural Water
- Livestock & Veterinary
- Fisheries & Aquaculture
- Storage, Cold Chain & Markets
Energy InfrastructureBack to top ↑
- Thermal Generation
- Nuclear Generation
- Nuclear Fuel Cycle & Radioactive Waste
- Hydropower
- Renewable Generation
- Transmission & Distribution
- System Control & Dispatch
- Storage & Fuel Supply
44.26 million kW (2010 est.)
257.9 billion kWh (2012 est.)
234.2 billion kWh (2012 est.)
15.04 billion kWh (2012 est.)
11.89 billion kWh (2011 est.)
90.8% of total installed capacity (2010 est.)
4.1% of total installed capacity (2010 est.)
1.5% of total installed capacity (2010 est.)
0.5% of total installed capacity (2010 est.)
461.6 million Mt (2011 est.)
Water, Sanitation & Waste InfrastructureBack to top ↑
- Dams, Reservoirs & Flood Defence
- Water Supply & Treatment
- Bulk Water Transfer & Desalination
- Wastewater & Sanitation
- Solid Waste & Recycling
Advanced ManufacturingBack to top ↑
- Materials & Inputs
- Chemicals & Hazardous Process Industry
- Production Systems
- Supply Chain & Ecosystem
- Workforce & Innovation
Transport InfrastructureBack to top ↑
- Seaports & Terminals
- Air Infrastructure
- Air Navigation & Traffic Management
- Inland Waterways & Ferries
- Rail Infrastructure
- Roads & Bridges
- Logistics, Multimodal & Border Infrastructure
- Postal & Parcel
566 (2013)
1 (2013)
Communications & Digital InfrastructureBack to top ↑
- Subsea Cables & International Gateways
- Core & Backbone Networks
- Mobile & Wireless Networks
- Spectrum & Broadcasting
- Data Centres, Compute & Cloud
- Data Resources
- AI Tools & Applications
4.03 million (2012)
68.4 million (2012)
4.42 million (2009)
4.761 million (2012)
.za
Financial InfrastructureBack to top ↑
- Currency & Reserves
- Payments & Settlement Systems
- Markets, Exchanges & Depositories
- Banks, Insurers & Systemic Institutions
Social InfrastructureBack to top ↑
- Health Infrastructure
- Public Health & Laboratories
- Medical Supply & Stockpiles
- Education & Skills Infrastructure
- Research & Scientific Facilities
- Housing, Community & Social Services
- Government & Public Administration
- Cultural, Community & Recreational Infrastructure
- Justice & Corrections
- Emergency Services & Civil Protection
- Hydrometeorology & Early Warning
Space, Aerospace & Defence InfrastructureBack to top ↑
GINC Capability Domains · Chapter 06
National Security
🇿🇦 South Africa’s force, intelligence and the defence of the nation
Disputes and terrorismBack to top ↑
South Africa has placed military units to assist police operations along the border of Lesotho, Zimbabwe, and Mozambique to control smuggling, poaching, and illegal migration; the governments of South Africa and Namibia have not signed or ratified the text of the 1994 Surveyor's General agreement placing the boundary in the middle of the Orange River
Force Generation & MobilisationBack to top ↑
South African National Defense Force (SANDF): South African Army, South African Navy (SAN), South African Air Force (SAAF), South African Military Health Services (2013)
18 years of age for voluntary military service; women are eligible to serve in noncombat roles; 2-year service obligation (2012)
1% of GDP (2013)//1.16% of GDP (2012)//1.14% of GDP (2011)//1.16% of GDP (2010)
with the end of apartheid and the establishment of majority rule, former military, black homelands forces, and ex-opposition forces were integrated into the South African National Defense Force (SANDF); as of 2003 the integration process was considered complete
Forces under arms
Active-duty strength on the Correlates of War series, which reaches back to 1816 and so carries a nation’s whole record of mobilisation rather than its present establishment. The card opens the full cross-country comparison.
Intelligence & AssessmentBack to top ↑
- Imagery & Geospatial Intelligence
- Signals & Cyber Intelligence
- Technical & Measurement Intelligence
- Open-Source & Financial Intelligence
- Human Intelligence & Counterintelligence
- All-Source Analysis & Warning
Joint Command, Projection & SustainmentBack to top ↑
- Command, Control & Communications
- Strategic Lift & Mobility
- Expeditionary & Peace Operations
- Operational Sustainment & War Reserves
- Defence Industrial Mobilisation
- CBRN Defence
Land PowerBack to top ↑
- Combined Arms Manoeuvre
- Land Fires
- Battlefield Aviation & Uncrewed Systems
- Special Operations & Irregular Warfare
Maritime PowerBack to top ↑
- Maritime Security & Constabulary
- Sea Denial & Undersea Warfare
- Sea Control
- Amphibious & Expeditionary Operations
Air PowerBack to top ↑
- Air Sovereignty & Policing
- Control of the Air
- Air Strike & Interdiction
- Airborne ISR, Early Warning & Battle Management
Strategic Strike & Missile DefenceBack to top ↑
Space OperationsBack to top ↑
Cyber & Electromagnetic OperationsBack to top ↑
Nuclear DeterrenceBack to top ↑
GINC Capability Domains · Chapter 07
Human Capital
🇿🇦 South Africa’s population, health and the skills that sustain capability
DemographyBack to top ↑
48,375,645
-0.48% (2014 est.)
18.94 births/1,000 population (2014 est.)
17.49 deaths/1,000 population (2014 est.)
2.23 children born/woman (2014 est.)
22.5
59.9% (2003/04)
Migration and urbanisationBack to top ↑
-6.27 migrant(s)/1,000 population
Johannesburg 3.844 million; Cape Town (legislative capital) 3.562 million; Ekurhuleni (East Rand) 3.357 million; Durban 3.012 million; PRETORIA (capital) 1.501 million; Vereeniging 1.2 million; Bloemfontein (judicial capital) 468,000 (2011)
Welfare and equityBack to top ↑
31.3% (2009 est.)
63.1 (2005)//59.3 (1994)
DisplacementBack to top ↑
Early Childhood DevelopmentBack to top ↑
8.7% (2008)
Foundational EducationBack to top ↑
6% of GDP (2010)
Advanced EducationBack to top ↑
Technical & Vocational SkillsBack to top ↑
Digital & AI CompetenceBack to top ↑
Generative AI adoption
Modelled share of working-age adults using generative AI, from Microsoft telemetry scaled to each country’s 15–64 population. A measure of how fast a workforce is absorbing the technology rather than of how much of it a nation builds. The card opens the full cross-country comparison.
Lifelong Learning & ReskillingBack to top ↑
Research Talent & Knowledge CreationBack to top ↑
Population HealthBack to top ↑
300 deaths/100,000 live births (2010)
31.3% (2008)
17.9% (2012 est.)
6,070,800 (2012 est.)
235,100 (2012 est.)
Health System CapabilityBack to top ↑
8.5% of GDP (2011)
0.76 physicians/1,000 population (2011)
2.8 beds/1,000 population (2005)
GINC Capability Domains · Chapter 08
Governance and Integrity
🇿🇦 South Africa’s institutions, law and the integrity of the state
State structureBack to top ↑
republic
9 provinces; Eastern Cape, Free State, Gauteng, KwaZulu-Natal, Limpopo, Mpumalanga, Northern Cape, North West, Western Cape
several previous; latest drafted 8 May 1996, approved 4 December 1997, effective 4 February 1997; amended many times, last in 2013 (2013)
18 years of age; universal
Political Institutions & Civic ParticipationBack to top ↑
- Electoral Management & Integrity
- Legislature & Deliberative Institutions
- Citizen Participation & Civic Space
bicameral Parliament consisting of the National Council of Provinces (90 seats; 10 members elected by each of the nine provincial legislatures for five-year terms; has special powers to protect regional interests, including the safeguarding of cultural and linguistic traditions among ethnic minorities) and the National Assembly (400 seats; members elected by popular vote under a system of proportional representation to serve five-year terms)
African Christian Democratic Party or ACDP [Kenneth MESHOE]//African National Congress or ANC [Jacob ZUMA]//Congress of the People or COPE [Mosiuoa LEKOTA]//Democratic Alliance or DA [Helen ZILLE]//Economic Freedom Fighters or EFF [Julius MALEMA]//Freedom Front Plus or FF+ [Pieter MULDER]//Inkatha Freedom Party or IFP [Mangosuthu BUTHELEZI]//National Freedom Party or NFP [Zanele kaMAGWAZA-MSIBI]//Pan-Africanist Congress of Azania or PAC [Alton MPHETHI]//United Christian Democratic Party or UCDP [Isaac Sipho MFUNDISI]//United Democratic Movement or UDM [Bantu HOLOMISA]
Congress of South African Trade Unions or COSATU [Zwelinzima VAVI, general secretary]//South African Communist Party or SACP [Blade NZIMANDE, general secretary]//South African National Civics Organization or SANCO [Richard MDAKANE, national president]//
Justice System & Fundamental RightsBack to top ↑
- Judicial Independence & Court Capability
- Access to Justice & Legal Services
- Fundamental Rights Protection
- Human Rights Institutions & Equality Bodies
mixed legal system of Roman-Dutch civil law, English common law, and customary law
has not submitted an ICJ jurisdiction declaration; accepts ICCt jurisdiction
Internal Security & OrderBack to top ↑
transshipment center for heroin, hashish, and cocaine, as well as a major cultivator of marijuana in its own right; cocaine and heroin consumption on the rise; world's largest market for illicit methaqualone, usually imported illegally from India through various east African countries, but increasingly producing its own synthetic drugs for domestic consumption; attractive venue for money launderers given the increasing level of organized criminal and narcotics activity in the region and the size of the South African economy
Regulatory Governance & Strategic ControlsBack to top ↑
- Regulatory Quality & Better Regulation
- Regulatory Delivery & Independent Regulators
- Strategic Controls & Economic Security Administration
Government Effectiveness & Public AdministrationBack to top ↑
- Centre of Government & Policy Coordination
- Civil Service & Public Workforce
- Digital Government & Service Delivery
- Legal Identity & Civil Registration
- Statistical & Data Capability
Public Integrity & Anti-CorruptionBack to top ↑
Transparency, Oversight & AccountabilityBack to top ↑
- Right to Information & Open Government
- Independent Oversight & Supreme Audit
- Independent Media & Journalist Safety
National Resilience & Crisis ManagementBack to top ↑
GINC Capability Domains · Chapter 09
Information and Influence
🇿🇦 South Africa’s identity, media and the projection of influence
Identity and cultureBack to top ↑
IsiZulu (official) 22.7%, IsiXhosa (official) 16%, Afrikaans (official) 13.5%, English (official) 9.6%, Sepedi (official) 9.1%, Setswana (official) 8%, Sesotho (official) 7.6%, Xitsonga (official) 4.5%, siSwati (official) 2.5%, Tshivenda (official) 2.4%, isiNdebele (official) 2.1%, sign language 0.5%, other 1.6% (2011 est.)
Protestant 36.6% (Zionist Christian 11.1%, Pentecostal/Charismatic 8.2%, Methodist 6.8%, Dutch Reformed 6.7%, Anglican 3.8%), Catholic 7.1%, Muslim 1.5%, other Christian 36%, other 2.3%, unspecified 1.4%, none 15.1% (2001 census)
black African 79.2%, white 8.9%, colored 8.9%, Indian/Asian 2.5%, other 0.5% (2011 est.)
springbok antelope
two equal width horizontal bands of red (top) and blue separated by a central green band that splits into a horizontal Y, the arms of which end at the corners of the hoist side; the Y embraces a black isosceles triangle from which the arms are separated by narrow yellow bands; the red and blue bands are separated from the green band and its arms by narrow white stripes; the flag colors do not have any official symbolism, but the Y stands for the "convergence of diverse elements within South African society, taking the road ahead in unity"; black, yellow, and green are found on the flag of the African National Congress, while red, white, and blue are the colors in the flags of the Netherlands and the UK, whose settlers ruled South Africa during the colonial era
Diplomatic Statecraft & Global NetworksBack to top ↑
- Diplomatic Network & Consular Reach
- Multilateral Leadership & Norm Setting
- Agenda-Setting & Convening
- Mediation & Crisis Diplomacy
ACP, AfDB, AU, BIS, BRICS, C, CD, FAO, FATF, G-20, G-24, G-77, IAEA, IBRD, ICAO, ICC (national committees), ICRM, IDA, IFAD, IFC, IFRCS, IHO, ILO, IMF, IMO, IMSO, Interpol, IOC, IOM, IPU, ISO, ITSO, ITU, ITUC (NGOs), MIGA, MONUSCO, NAM, NSG, OECD (Enhanced Engagement, OPCW, Paris Club (associate), PCA, SACU, SADC, UN, UNAMID, UNCTAD, UNESCO, UNHCR, UNIDO, UNITAR, UNSC (temporary), UNWTO, UPU, WCO, WFTU (NGOs), WHO, WIPO, WMO, WTO, ZC
Alliances & Security CooperationBack to top ↑
Development Cooperation & Global AssistanceBack to top ↑
Culture, Language & Education DiplomacyBack to top ↑
- Cultural & Language Institutes
- Creative Industries & Cultural Export Reach
- Heritage & Cultural Institutions
- Education Diplomacy & Alumni Networks
- Sports & Major Events
Diaspora & Global CommunitiesBack to top ↑
Information Environment & Strategic CommunicationBack to top ↑
- Strategic Communications & Public Diplomacy
- International Media & Broadcasting
- Information Defence & Counter-Interference
the South African Broadcasting Corporation (SABC) operates 4 TV stations, 3 are free-to-air and 1 is pay TV; e.tv, a private station, is accessible to more than half the population; multiple subscription TV services provide a mix of local and international channels; well developed mix of public and private radio stations at the national, regional, and local levels; the SABC radio network, state-owned and controlled but nominally independent, operates 18 stations, one for each of the 11 official languages, 4 community stations, and 3 commercial stations; more than 100 community-based stations extend coverage to rural areas (2007)
GINC Capability Domains · Chapter 10
Financial Strength
🇿🇦 South Africa’s fiscal depth, reserves and the capacity to act
Monetary & Currency CapabilityBack to top ↑
- Monetary Policy & Price Stability
- Exchange Rate & External Account Management
- Currency Issuance & Digital Money
5.8% (2013 est.)//5.7% (2012 est.)
rand (ZAR) per US dollar -//9.576 (2013 est.)//8.2031 (2012 est.)//7.3212 (2010 est.)//8.42 (2009)//7.9576 (2008)
5% (31 December 2012)//7% (31 December 2009)
8.5% (31 December 2013 est.)//8.75% (31 December 2012 est.)
$110.2 billion (31 December 2013 est.)//$122 billion (31 December 2012 est.)
$198 billion (31 December 2013 est.)//$220.1 billion (31 December 2012 est.)
Fiscal Capacity & Public FinanceBack to top ↑
- Revenue Mobilisation & Tax Administration
- Public Expenditure & Budget Management
- Sovereign Debt & Treasury Management
- Public Investment Management
25% of GDP (2013 est.)
-4.8% of GDP (2013 est.)
45.4% of GDP (2013 est.)//42.3% of GDP (2012 est.)
1 April - 31 March
Financial System Depth & AccessBack to top ↑
- Banking System Capacity
- Capital Markets Depth & Development
- Long-Term & Institutional Capital
- Financial Inclusion & Household Access
- Development & Policy Finance
$252.6 billion (31 December 2013 est.)//$298.8 billion (31 December 2012 est.)
$1.038 trillion (31 December 2012)//$855.7 billion (31 December 2011)//$1.013 trillion (31 December 2010)
15.1% of GDP (2013 est.)//13.2% of GDP (2012 est.)//16.1% of GDP (2011 est.)
Financial Regulation & IntegrityBack to top ↑
- Prudential Regulation & Supervision
- Financial Integrity & Illicit Finance Control
- Market Conduct & Consumer Protection
- Payment & Market Infrastructure Oversight
Financial Stability & Crisis ManagementBack to top ↑
- Macroprudential & Systemic Oversight
- Crisis Management, Resolution & Deposit Insurance
- External Liquidity & Financial Safety Nets
Sovereign Capital & External Financial PowerBack to top ↑
- Official Reserves Management
- Sovereign Wealth & Public Asset Management
- Currency Internationalisation & Reserve Status
- Capital Account & Flow Management
- International Financial Centre Capability
$48.46 billion (31 December 2013 est.)//$50.7 billion (31 December 2012 est.)
$139 billion (31 December 2013 est.)//$130.4 billion (31 December 2012 est.)
GINC Capability Domains · Chapter 11
Production and Innovation
🇿🇦 South Africa’s output, industry and the engine of prosperity
Economic Output & ProductivityBack to top ↑
South Africa is a middle-income, emerging market with an abundant supply of natural resources; well-developed financial, legal, communications, energy, and transport sectors and a stock exchange that is the 16th largest in the world. Even though the country's modern infrastructure supports a relatively efficient distribution of goods to major urban centers throughout the region, unstable electricity supplies retard growth. The global financial crisis reduced commodity prices and world demand. GDP fell nearly 2% in 2009 but has recovered since then, albeit slowly with 2014 growth projected at about 2%. Unemployment, poverty, and inequality - among the highest in the world - remain a challenge. Official unemployment is at nearly 25% of the work force, and runs significantly higher among black youth. Eskom, the state-run power company, has built two new power stations and installed new power demand management programs to improve power grid reliability. Construction delays at two additional plants, however, mean South Africa is operating on a razor thin margin; economists judge that growth cannot exceed 3% until those plants come on line. South Africa's economic policy has focused on controlling inflation, however, the country has had significant budget deficits that restrict its ability to deal with pressing economic problems. The current government faces growing pressure from special interest groups to use state-owned enterprises to deliver basic services to low-income areas and to increase job growth.
$595.7 billion (2013 est.)//$584 billion (2012 est.)//$569.5 billion (2011 est.)
2% (2013 est.)//2.5% (2012 est.)//3.5% (2011 est.)
$11,500 (2013 est.)//$11,400 (2012 est.)//$11,300 (2011 est.)
$353.9 billion (2013 est.)
Labour & EmploymentBack to top ↑
- Employment & Labour Force Participation
- Labour Market Institutions & Wage Setting
- Employment Services & Skills Matching
- Labour Adjustment, Transition & Formalisation
18.54 million (2013 est.)
24.9% (2013 est.)//25.1% (2012 est.)
Industrial & Sectoral BaseBack to top ↑
- Manufacturing & Advanced Industry
- Foundational & Process Industries
- Agrifood & Primary Production
- Services Economy
corn, wheat, sugarcane, fruits, vegetables; beef, poultry, mutton, wool, dairy products
mining (world's largest producer of platinum, gold, chromium), automobile assembly, metalworking, machinery, textiles, iron and steel, chemicals, fertilizer, foodstuffs, commercial ship repair
0.9% (2013 est.)
Structural Transformation & ComplexityBack to top ↑
Business Dynamism & EntrepreneurshipBack to top ↑
- Entrepreneurship & Firm Creation
- Risk Capital & Scale-Up Finance
- Firm Growth, Exit & Renewal
- Competition & Market Contestability
Innovation & CommercialisationBack to top ↑
- Business Innovation Capability
- Research Commercialisation & Knowledge Transfer
- Intellectual Property & Intangible Assets
- Innovation Ecosystems & Clusters
Technology Adoption & DiffusionBack to top ↑
GINC Capability Domains · Chapter 12
Trade and Investment
🇿🇦 South Africa’s markets, capital and the terms of global exchange
Overall tradeBack to top ↑
$156B of exports to 214 partners and $99.7B of imports from 223 in 2024, a surplus of $56.4B.
- Exports
- $156B214 partners
- Imports
- $99.7B223 partners
- Balance
- +$56.4Bsurplus
- Total trade
- $256B2024
ExportsBack to top ↑
Where its exports go
The largest partners in 2024, with each one's share of the nation's exports.
| Partner | Value | Share | |
|---|---|---|---|
| China | $28.7B | 18% | |
| United States | $14.4B | 9.2% | |
| United Kingdom | $12.8B | 8.2% | |
| India | $12.1B | 7.7% | |
| Germany | $9.27B | 5.9% | |
| Mozambique | $6.45B | 4.1% | |
| Japan | $6.21B | 4.0% | |
| Botswana | $4.33B | 2.8% | |
| Zimbabwe | $3.76B | 2.4% | |
| Namibia | $3.40B | 2.2% | |
| Switzerland | $3.37B | 2.2% | |
| Netherlands | $3.11B | 2.0% | |
| Zambia | $2.95B | 1.9% | |
| United Arab Emirates | $2.67B | 1.7% | |
| Belgium | $2.62B | 1.7% | |
| South Korea | $2.54B | 1.6% | |
| Hong Kong | $2.18B | 1.4% | |
| Italy | $2.16B | 1.4% | |
| Eswatini | $1.69B | 1.1% | |
| Indonesia | $1.65B | 1.1% |
What it exports
The largest categories in 2024.
| Category | Value | Share | |
|---|---|---|---|
| Pearls, precious stones, metals, coins | $54.3B | 35% | |
| Ores slag and ash | $21.8B | 14% | |
| Vehicles other than railway, tramway | $15.7B | 10% | |
| Mineral fuels, oils, distillation products | $10.9B | 7.0% | |
| Iron and steel | $7.10B | 4.5% | |
| Edible fruits, nuts, peel of citrus fruit, melons | $5.95B | 3.8% | |
| Machinery, nuclear reactors, boilers | $5.52B | 3.5% | |
| Aluminum | $2.80B | 1.8% | |
| Electrical, electronic equipment | $2.16B | 1.4% | |
| Plastics | $1.57B | 1.0% | |
| Beverages, spirits and vinegar | $1.51B | 1.0% | |
| Organic chemicals | $1.42B | 0.9% | |
| Copper | $1.32B | 0.8% | |
| Cereals | $1.31B | 0.8% | |
| Inorganic chemicals, precious metal compound, isotope | $1.28B | 0.8% |
ImportsBack to top ↑
Where its imports come from
The largest partners in 2024, with each one's share of the nation's imports.
| Partner | Value | Share | |
|---|---|---|---|
| China | $22.1B | 22% | |
| India | $7.34B | 7.4% | |
| Germany | $6.04B | 6.1% | |
| United States | $5.96B | 6.0% | |
| Oman | $2.97B | 3.0% | |
| United Arab Emirates | $2.97B | 3.0% | |
| Nigeria | $2.55B | 2.6% | |
| Saudi Arabia | $2.48B | 2.5% | |
| Thailand | $2.47B | 2.5% | |
| Italy | $2.42B | 2.4% | |
| Tanzania | $2.29B | 2.3% | |
| Japan | $1.94B | 2.0% | |
| France | $1.88B | 1.9% | |
| United Kingdom | $1.64B | 1.6% | |
| Eswatini | $1.49B | 1.5% | |
| Netherlands | $1.47B | 1.5% | |
| Zimbabwe | $1.38B | 1.4% | |
| Australia | $1.33B | 1.3% | |
| Spain | $1.33B | 1.3% | |
| Brazil | $1.29B | 1.3% |
What it imports
The largest categories in 2024.
| Category | Value | Share | |
|---|---|---|---|
| Mineral fuels, oils, distillation products | $19.7B | 20% | |
| Machinery, nuclear reactors, boilers | $13.9B | 14% | |
| Electrical, electronic equipment | $10.2B | 10% | |
| Vehicles other than railway, tramway | $7.96B | 8.0% | |
| Pearls, precious stones, metals, coins | $4.36B | 4.4% | |
| Plastics | $3.30B | 3.3% | |
| Pharmaceutical products | $2.49B | 2.5% | |
| Optical, photo, technical, medical apparatus | $2.47B | 2.5% | |
| Iron and steel | $1.74B | 1.7% | |
| Miscellaneous chemical products | $1.73B | 1.7% | |
| Inorganic chemicals, precious metal compound, isotope | $1.70B | 1.7% | |
| Organic chemicals | $1.49B | 1.5% | |
| Rubbers | $1.40B | 1.4% | |
| Cereals | $1.38B | 1.4% | |
| Articles of iron or steel | $1.25B | 1.3% |
In a list, the bar runs to the largest in that list. The line is each figure’s history from 2000, drawn to its own peak: it shows the shape of the years, and the value shows the size.
External balanceBack to top ↑
-$23.78 billion (2013 est.)//-$24.07 billion (2012 est.)
Trade Facilitation & LogisticsBack to top ↑
Trade Policy & Market AccessBack to top ↑
- Trade Policy & Negotiation Capability
- Market Access & Agreements Network
- Trade Law & Enforcement
- Standards, Conformity & Quality Infrastructure
Digital & Services TradeBack to top ↑
- Services Trade Capability
- Digital Trade & E-Commerce
- Data Flows & Digital Trade Governance
- Tourism & Visitor Economy
Investment Attraction & ProjectionBack to top ↑
- Investment Attraction & Facilitation
- Investment Absorption & Linkages
- Outward Investment & Global Corporate Presence
$143.3 billion (31 December 2013 est.)//$139 billion (31 December 2012 est.)
$87.67 billion (31 December 2013 est.)//$82.82 billion (31 December 2012 est.)
Export Capability & SophisticationBack to top ↑
$91.05 billion (2013 est.)//$93.48 billion (2012 est.)
China 11.8%, US 8.3%, Japan 6%, Germany 5.7%, India 4.2% (2012)
gold, diamonds, platinum, other metals and minerals, machinery and equipment
Global Value Chain PositionBack to top ↑
- Value Chain Participation & Integration
- Value Chain Position & Upgrading
- Regional Integration & Hub Anchoring
Economic Leverage & DependenceBack to top ↑
- Strategic Supply Security
- Concentration Risk & Revenue Stabilisation
- Economic Leverage & Coercion Resistance
$99.55 billion (2013 est.)//$102.6 billion (2012 est.)
China 14.4%, Germany 10.1%, Saudi Arabia 7.7%, US 7.4%, Japan 4.6%, India 4.5% (2012)
machinery and equipment, chemicals, petroleum products, scientific instruments, foodstuffs
South Africa · you are in
Historical Context
Foundations
GINC Capability Domains
Find in this brief · South Africa