
Oman
Oman is a monarchy in the Middle East, home to 3.2 million people, with its capital at Muscat.
Contents
12 chapters
Foundations
01–03
At a glance
- Area
- 309.5Kkm²#71 World#6 Middle East
- Population
- 3.2M#135 World#13 Middle East
- GDP (market)
- $82B
- GDP (PPP)
- $94.9B#76 World#11 Middle East
- GDP per capita
- $29.8K#49 World#7 Middle East
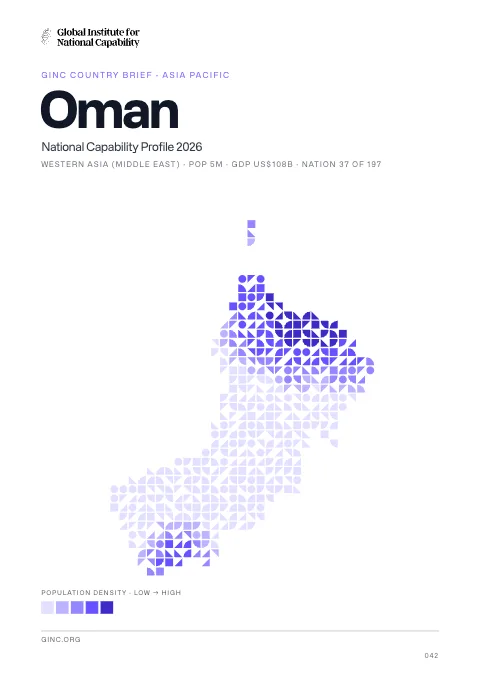
The whole brief
Oman National Capability Profile 2026
Foundations · Chapter 01
Historical Context
🇴🇲 Oman’s understanding the origins and evolution of the modern nation
BackgroundBack to top ↑
The inhabitants of the area of Oman have long prospered on Indian Ocean trade. In the late 18th century, a newly established sultanate in Muscat signed the first in a series of friendship treaties with Britain. Over time, Oman's dependence on British political and military advisors increased, but it never became a British colony. In 1970, QABOOS bin Said Al-Said overthrew his father, and he has since ruled as sultan. His extensive modernization program has opened the country to the outside world while preserving the longstanding close ties with the UK. Oman's moderate, independent foreign policy has sought to maintain good relations with all Middle Eastern countries. Inspired by the popular uprisings that swept the Middle East and North Africa beginning in January 2011, some Omanis began staging marches, demonstrations, and sit-ins calling mostly for more jobs and economic benefits and an end to corruption. In response to those protester demands, QABOOS in 2011 pledged to implement economic and political reforms, such as granting legislative and regulatory powers to the Majlis al-Shura and introducing unemployment benefits. Additionally, in August 2012, the Sultan announced a royal directive mandating the speedy implementation of a national job creation plan for thousands of public and private sector jobs. As part of the government's efforts to decentralize authority and allow greater citizen participation in local governance, Oman successfully conducted its first municipal council elections in December 2012. Announced by the Sultan in 2011, the municipal councils will have the power to advise the Royal Court on the needs of local districts across Oman's 11 governorates.
IndependenceBack to top ↑
1650 (expulsion of the Portuguese)
National holidayBack to top ↑
Birthday of Sultan QABOOS, 18 November (1940)
Foundations · Chapter 02
Geography
🇴🇲 Oman’s territory, resources and strategic position
Location and areaBack to top ↑
Middle East, bordering the Arabian Sea, Gulf of Oman, and Persian Gulf, between Yemen and UAE
21 00 N, 57 00 E
Middle East
slightly smaller than Kansas
2,092 km
Terrain and resourcesBack to top ↑
central desert plain, rugged mountains in north and south
petroleum, copper, asbestos, some marble, limestone, chromium, gypsum, natural gas
588.5 sq km (2004)
Settlement and hazardsBack to top ↑
summer winds often raise large sandstorms and dust storms in interior; periodic droughts
strategic location on Musandam Peninsula adjacent to Strait of Hormuz, a vital transit point for world crude oil
OtherBack to top ↑
1.4 cu km (2011)
rising soil salinity; beach pollution from oil spills; limited natural freshwater resources
Foundations · Chapter 03
Environment
🇴🇲 Oman’s environmental conditions, resources and national resilience
ClimateBack to top ↑
dry desert; hot, humid along coast; hot, dry interior; strong southwest summer monsoon (May to September) in far south
Emissions and pollutionBack to top ↑
Water, waste and foodBack to top ↑
Resources and agreementsBack to top ↑
GINC Capability Domains · Chapter 04
Critical Technology
🇴🇲 Oman’s technology frontiers and the pursuit of national advantage
Two counts are set side by side for 2015–2024: on the left, the papers researchers in Oman published; on the right, the patent families that began there and were filed in more than one country. First by capability group, then group by group with each group’s capabilities. The badge on a card is the nation’s place among all nations. Papers are from GINC Research Analytics, patent families from GINC Patents.
Research by capability group
#78 WorldPapers published, 2015–2024
616
184
152
116
109
98
39
27
25
2
Patents by capability group
#84 WorldInternational patent families, 2015–2024
Advanced Materials & ManufacturingBack to top ↑
Research
#84 WorldPapers published, 2015–2024
Patents
#71 WorldInternational patent families, 2015–2024
Energy TechnologiesBack to top ↑
Research
#81 WorldPapers published, 2015–2024
Patents
#76 WorldInternational patent families, 2015–2024
Semiconductors & Advanced ComputingBack to top ↑
Research
#86 WorldPapers published, 2015–2024
No research topic: Semiconductor Design & EDA · Advanced Semiconductor Fabrication · Semiconductor Equipment & Materials · Advanced Packaging & Heterogeneous Integration
Patents
International patent families, 2015–2024
No international patent families on record for 2015–2024.
Artificial IntelligenceBack to top ↑
Research
#70 WorldPapers published, 2015–2024
Patents
#78 WorldInternational patent families, 2015–2024
Quantum TechnologiesBack to top ↑
Research
#80 WorldPapers published, 2015–2024
Patents
International patent families, 2015–2024
No international patent families on record for 2015–2024.
Connectivity, Cyber & Trust TechnologiesBack to top ↑
Research
#67 WorldPapers published, 2015–2024
Patents
#79 WorldInternational patent families, 2015–2024
Sensing, Timing & NavigationBack to top ↑
Research
#79 WorldPapers published, 2015–2024
Patents
International patent families, 2015–2024
No international patent families on record for 2015–2024.
Robotics & Autonomous SystemsBack to top ↑
Research
#76 WorldPapers published, 2015–2024
No research topic: Human-Machine Interfaces
Patents
#85 WorldInternational patent families, 2015–2024
Biotechnology & Health TechnologiesBack to top ↑
Research
#98 WorldPapers published, 2015–2024
Patents
#78 WorldInternational patent families, 2015–2024
Medicine and BioTech
Clinical research and life-science invention, drawn from the same series that drive the metric pages. Each card opens the full cross-country comparison.
Space TechnologiesBack to top ↑
Research
#79 WorldPapers published, 2015–2024
Patents
International patent families, 2015–2024
No international patent families on record for 2015–2024.
GINC Capability Domains · Chapter 05
Strategic Infrastructure
🇴🇲 Oman’s energy, connectivity and the material foundations of capability
Resource InfrastructureBack to top ↑
923,800 bbl/day (2012 est.)
705,100 bbl/day (2010 est.)
0 bbl/day (2010 est.)
5.5 billion bbl (1 January 2013 est.)
164,600 bbl/day (2010 est.)
98,000 bbl/day (2011 est.)
47,710 bbl/day (2010 est.)
2,390 bbl/day (2010 est.)
35.94 billion cu m (2012 est.)
17.53 billion cu m (2011 est.)
10.93 billion cu m (2011 est.)
1.95 billion cu m (2011 est.)
849.5 billion cu m (1 January 2013 est.)
condensate 106 km; gas 4,224 km; oil 3,558 km; oil/gas/water 33 km; refined products 264 km (2013)
Agriculture & Food InfrastructureBack to top ↑
- Irrigation & Agricultural Water
- Livestock & Veterinary
- Fisheries & Aquaculture
- Storage, Cold Chain & Markets
Energy InfrastructureBack to top ↑
- Thermal Generation
- Nuclear Generation
- Nuclear Fuel Cycle & Radioactive Waste
- Hydropower
- Renewable Generation
- Transmission & Distribution
- System Control & Dispatch
- Storage & Fuel Supply
4.265 million kW (2010 est.)
18.63 billion kWh (2010 est.)
15.32 billion kWh (2010 est.)
0 kWh (2012 est.)
0 kWh (2012 est.)
100% of total installed capacity (2010 est.)
0% of total installed capacity (2010 est.)
0% of total installed capacity (2010 est.)
0% of total installed capacity (2010 est.)
52.67 million Mt (2011 est.)
Water, Sanitation & Waste InfrastructureBack to top ↑
- Dams, Reservoirs & Flood Defence
- Water Supply & Treatment
- Bulk Water Transfer & Desalination
- Wastewater & Sanitation
- Solid Waste & Recycling
Advanced ManufacturingBack to top ↑
- Materials & Inputs
- Chemicals & Hazardous Process Industry
- Production Systems
- Supply Chain & Ecosystem
- Workforce & Innovation
Transport InfrastructureBack to top ↑
- Seaports & Terminals
- Air Infrastructure
- Air Navigation & Traffic Management
- Inland Waterways & Ferries
- Rail Infrastructure
- Roads & Bridges
- Logistics, Multimodal & Border Infrastructure
- Postal & Parcel
132 (2013)
3 (2013)
Communications & Digital InfrastructureBack to top ↑
- Subsea Cables & International Gateways
- Core & Backbone Networks
- Mobile & Wireless Networks
- Spectrum & Broadcasting
- Data Centres, Compute & Cloud
- Data Resources
- AI Tools & Applications
305,000 (2012)
5.278 million (2012)
1.465 million (2009)
14,531 (2012)
.om
Financial InfrastructureBack to top ↑
- Currency & Reserves
- Payments & Settlement Systems
- Markets, Exchanges & Depositories
- Banks, Insurers & Systemic Institutions
Social InfrastructureBack to top ↑
- Health Infrastructure
- Public Health & Laboratories
- Medical Supply & Stockpiles
- Education & Skills Infrastructure
- Research & Scientific Facilities
- Housing, Community & Social Services
- Government & Public Administration
- Cultural, Community & Recreational Infrastructure
- Justice & Corrections
- Emergency Services & Civil Protection
- Hydrometeorology & Early Warning
Space, Aerospace & Defence InfrastructureBack to top ↑
GINC Capability Domains · Chapter 06
National Security
🇴🇲 Oman’s force, intelligence and the defence of the nation
Disputes and terrorismBack to top ↑
boundary agreement reportedly signed and ratified with UAE in 2003 for entire border, including Oman's Musandam Peninsula and Al Madhah exclave, but details of the alignment have not been made public
Force Generation & MobilisationBack to top ↑
Sultan's Armed Forces (SAF): Royal Army of Oman, Royal Navy of Oman, Royal Air Force of Oman (al-Quwwat al-Jawwiya al-Sultanat Oman) (2013)
18-30 years of age for voluntary military service; no conscription (2012)
8.61% of GDP (2012)//6.13% of GDP (2011)//8.61% of GDP (2010)
Forces under arms
Active-duty strength on the Correlates of War series, which reaches back to 1816 and so carries a nation’s whole record of mobilisation rather than its present establishment. The card opens the full cross-country comparison.
Intelligence & AssessmentBack to top ↑
- Imagery & Geospatial Intelligence
- Signals & Cyber Intelligence
- Technical & Measurement Intelligence
- Open-Source & Financial Intelligence
- Human Intelligence & Counterintelligence
- All-Source Analysis & Warning
Joint Command, Projection & SustainmentBack to top ↑
- Command, Control & Communications
- Strategic Lift & Mobility
- Expeditionary & Peace Operations
- Operational Sustainment & War Reserves
- Defence Industrial Mobilisation
- CBRN Defence
Land PowerBack to top ↑
- Combined Arms Manoeuvre
- Land Fires
- Battlefield Aviation & Uncrewed Systems
- Special Operations & Irregular Warfare
Maritime PowerBack to top ↑
- Maritime Security & Constabulary
- Sea Denial & Undersea Warfare
- Sea Control
- Amphibious & Expeditionary Operations
Air PowerBack to top ↑
- Air Sovereignty & Policing
- Control of the Air
- Air Strike & Interdiction
- Airborne ISR, Early Warning & Battle Management
Strategic Strike & Missile DefenceBack to top ↑
Space OperationsBack to top ↑
Cyber & Electromagnetic OperationsBack to top ↑
Nuclear DeterrenceBack to top ↑
GINC Capability Domains · Chapter 07
Human Capital
🇴🇲 Oman’s population, health and the skills that sustain capability
DemographyBack to top ↑
3,219,775
2.06% (2014 est.)
24.47 births/1,000 population (2014 est.)
3.38 deaths/1,000 population (2014 est.)
2.86 children born/woman (2014 est.)
31.7% (2000)
Migration and urbanisationBack to top ↑
-0.45 migrant(s)/1,000 population (2014 est.)
MUSCAT (capital) 743,000 (2011)
Welfare and equityBack to top ↑
NA%
Early Childhood DevelopmentBack to top ↑
8.6% (2009)
Foundational EducationBack to top ↑
4.3% of GDP (2009)
Advanced EducationBack to top ↑
Technical & Vocational SkillsBack to top ↑
Digital & AI CompetenceBack to top ↑
Generative AI adoption
Modelled share of working-age adults using generative AI, from Microsoft telemetry scaled to each country’s 15–64 population. A measure of how fast a workforce is absorbing the technology rather than of how much of it a nation builds. The card opens the full cross-country comparison.
Lifelong Learning & ReskillingBack to top ↑
Research Talent & Knowledge CreationBack to top ↑
Population HealthBack to top ↑
32 deaths/100,000 live births (2010)
20.9% (2008)
0.1% (2009 est.)
1,100 (2009 est.)
fewer than 100 (2009 est.)
Health System CapabilityBack to top ↑
2.3% of GDP (2011)
2.05 physicians/1,000 population (2010)
1.8 beds/1,000 population (2009)
GINC Capability Domains · Chapter 08
Governance and Integrity
🇴🇲 Oman’s institutions, law and the integrity of the state
State structureBack to top ↑
monarchy
11 governorates (muhafazat, singular - muhafazat); Ad Dakhiliyah, Al Buraymi, Al Wusta, Az Zahirah, Janub al Batinah (Al Batinah South), Janub ash Sharqiyah (Ash Sharqiyah South), Masqat (Muscat), Musandam, Shamal al Batinah (Al Batinah North), Shamal ash Sharqiyah (Ash Sharqiyah North), Zufar (Dhofar)
previous 1996 (The Basic Law of the Sultanate of Oman serves as the constitution); latest amended by royal decree in 2011 (2011)
21 years of age; universal; note - members of the military and security forces by law cannot vote
Political Institutions & Civic ParticipationBack to top ↑
- Electoral Management & Integrity
- Legislature & Deliberative Institutions
- Citizen Participation & Civic Space
bicameral - consists of Majlis al-Dawla or upper chamber (71 seats; members appointed by the sultan; has only advisory powers) and Majlis al-Shura or lower chamber (84 seats; members elected by popular vote to serve four-year terms; body has authority to draft legislation but is subordinate to the Sultan)
political parties are illegal
none
Justice System & Fundamental RightsBack to top ↑
- Judicial Independence & Court Capability
- Access to Justice & Legal Services
- Fundamental Rights Protection
- Human Rights Institutions & Equality Bodies
mixed legal system of Anglo-Saxon law and Islamic law
has not submitted an ICJ jurisdiction declaration; non-party state to the ICCt
Internal Security & OrderBack to top ↑
Regulatory Governance & Strategic ControlsBack to top ↑
- Regulatory Quality & Better Regulation
- Regulatory Delivery & Independent Regulators
- Strategic Controls & Economic Security Administration
Government Effectiveness & Public AdministrationBack to top ↑
- Centre of Government & Policy Coordination
- Civil Service & Public Workforce
- Digital Government & Service Delivery
- Legal Identity & Civil Registration
- Statistical & Data Capability
Public Integrity & Anti-CorruptionBack to top ↑
Transparency, Oversight & AccountabilityBack to top ↑
- Right to Information & Open Government
- Independent Oversight & Supreme Audit
- Independent Media & Journalist Safety
National Resilience & Crisis ManagementBack to top ↑
GINC Capability Domains · Chapter 09
Information and Influence
🇴🇲 Oman’s identity, media and the projection of influence
Identity and cultureBack to top ↑
Arabic (official), English, Baluchi, Urdu, Indian dialects
Muslim (official; majority are Ibadhi, lesser numbers of Sunni and Shia)) 85.9%, Christian 6.5%, Hindu 5.5%, Buddhist 0.8%, Jewish note: approximately 75% of Omani citizens, who compose almost 70% of the country's total population, are Ibadhi Muslims; the Omani government does not keep statistics on religious affiliation (2013) (2010 est.)
Arab, Baluchi, South Asian (Indian, Pakistani, Sri Lankan, Bangladeshi), African
Khanjar dagger superimposed on two crossed swords
three horizontal bands of white, red, and green of equal width with a broad, vertical, red band on the hoist side; the national emblem (a khanjar dagger in its sheath superimposed on two crossed swords in scabbards) in white is centered near the top of the vertical band; white represents peace and prosperity, red recalls battles against foreign invaders, and green symbolizes the Jebel Akhdar (Green Mountains) and fertility
Diplomatic Statecraft & Global NetworksBack to top ↑
- Diplomatic Network & Consular Reach
- Multilateral Leadership & Norm Setting
- Agenda-Setting & Convening
- Mediation & Crisis Diplomacy
ABEDA, AFESD, AMF, CAEU, FAO, G-77, GCC, IAEA, IBRD, ICAO, ICC (NGOs), IDA, IDB, IFAD, IFC, IHO, ILO, IMF, IMO, IMSO, Interpol, IOC, IPU, ISO, ITSO, ITU, LAS, MIGA, NAM, OIC, OPCW, UN, UNCTAD, UNESCO, UNIDO, UNWTO, UPU, WCO, WFTU (NGOs), WHO, WIPO, WMO, WTO
Alliances & Security CooperationBack to top ↑
Development Cooperation & Global AssistanceBack to top ↑
Culture, Language & Education DiplomacyBack to top ↑
- Cultural & Language Institutes
- Creative Industries & Cultural Export Reach
- Heritage & Cultural Institutions
- Education Diplomacy & Alumni Networks
- Sports & Major Events
Diaspora & Global CommunitiesBack to top ↑
Information Environment & Strategic CommunicationBack to top ↑
- Strategic Communications & Public Diplomacy
- International Media & Broadcasting
- Information Defence & Counter-Interference
1 state-run TV broadcaster; TV stations transmitting from Saudi Arabia, the UAE, and Yemen available via satellite TV; state-run radio operates multiple stations; first private radio station began operating in 2007 and 2 additional stations now operating (2007)
GINC Capability Domains · Chapter 10
Financial Strength
🇴🇲 Oman’s fiscal depth, reserves and the capacity to act
Monetary & Currency CapabilityBack to top ↑
- Monetary Policy & Price Stability
- Exchange Rate & External Account Management
- Currency Issuance & Digital Money
1.6% (2013 est.)//2.9% (2012 est.)
Omani rials (OMR) per US dollar -//0.3845 (2013 est.)//0.3845 (2012 est.)//0.3845 (2010 est.)//0.3845 (2009)//0.3845 (2008)
2% (31 December 2010 est.)//0.05% (31 December 2009 est.)
5.8% (31 December 2013 est.)//5.65% (31 December 2012 est.)
$9.537 billion (31 December 2013 est.)//$9.083 billion (31 December 2012 est.)
$71.42 billion (31 December 2010 est.)//$63.16 billion (31 December 2009 est.)
Fiscal Capacity & Public FinanceBack to top ↑
- Revenue Mobilisation & Tax Administration
- Public Expenditure & Budget Management
- Sovereign Debt & Treasury Management
- Public Investment Management
42% of GDP (2013 est.)
-1.3% of GDP (2013 est.)
4.4% of GDP (2013 est.)//4.3% of GDP (2012 est.)
calendar year
Financial System Depth & AccessBack to top ↑
- Banking System Capacity
- Capital Markets Depth & Development
- Long-Term & Institutional Capital
- Financial Inclusion & Household Access
- Development & Policy Finance
$29.97 billion (31 December 2013 est.)//$27.62 billion (31 December 2012 est.)
$20.11 billion (31 December 2012 est.)//$19.72 billion (31 December 2011)//$20.27 billion (31 December 2010 est.)
36.2% of GDP (2013 est.)//37.4% of GDP (2012 est.)//41% of GDP (2011 est.)
Financial Regulation & IntegrityBack to top ↑
- Prudential Regulation & Supervision
- Financial Integrity & Illicit Finance Control
- Market Conduct & Consumer Protection
- Payment & Market Infrastructure Oversight
Financial Stability & Crisis ManagementBack to top ↑
- Macroprudential & Systemic Oversight
- Crisis Management, Resolution & Deposit Insurance
- External Liquidity & Financial Safety Nets
Sovereign Capital & External Financial PowerBack to top ↑
- Official Reserves Management
- Sovereign Wealth & Public Asset Management
- Currency Internationalisation & Reserve Status
- Capital Account & Flow Management
- International Financial Centre Capability
$17.7 billion (31 December 2013 est.)//$14.4 billion (31 December 2012 est.)
$10.84 billion (31 December 2013 est.)//$9.99 billion (31 December 2012 est.)
GINC Capability Domains · Chapter 11
Production and Innovation
🇴🇲 Oman’s output, industry and the engine of prosperity
Economic Output & ProductivityBack to top ↑
Oman is a middle-income economy that is heavily dependent on dwindling oil resources. Because of declining reserves and a rapidly growing labor force, Muscat has actively pursued a development plan that focuses on diversification, industrialization, and privatization, with the objective of reducing the oil sector's contribution to GDP to 9% by 2020 and creating more jobs to employ the rising numbers of Omanis entering the workforce. Tourism and gas-based industries are key components of the government's diversification strategy. However, increases in social welfare benefits, particularly since the Arab Spring, will challenge the government's ability to effectively balance its budget if oil revenues decline. By using enhanced oil recovery techniques, Oman succeeded in increasing oil production, giving the country more time to diversify, and the increase in global oil prices through 2011 provided the government greater financial resources to invest in non-oil sectors. In 2012, continued surpluses resulting from sustained high oil prices and increased enhanced oil recovery allowed the government to maintain growth in social subsidies and public sector job creation. However, the Sultan made widely reported statements indicating this would not be sustainable, and called for expanded efforts to support SME development and entrepreneurship. Government agencies and large oligarchic group companies heeded his call, announcing new initiatives to spin off non-essential functions to entrepreneurs, incubate new businesses, train and mentor up and coming business people, and provide financing for start-ups. In response to fast growth in household indebtedness, the Central Bank reduced the ceiling on personal interest loans from 8 to 7%, lowered mortgage rates, capped the percentage of consumer loans at 50% of borrower's salaries for personal loans and 60% for housing loans, and limited maximum repayment terms to 10 and 25 years respectively.
$94.86 billion (2013 est.)//$90.28 billion (2012 est.)//$85.99 billion (2011 est.)
5.1% (2013 est.)//5% (2012 est.)//4.5% (2011 est.)
$29,800 (2013 est.)//$29,200 (2012 est.)//$28,700 (2011 est.)
$81.95 billion (2013 est.)
Labour & EmploymentBack to top ↑
- Employment & Labour Force Participation
- Labour Market Institutions & Wage Setting
- Employment Services & Skills Matching
- Labour Adjustment, Transition & Formalisation
968,800
15% (2004 est.)
Industrial & Sectoral BaseBack to top ↑
- Manufacturing & Advanced Industry
- Foundational & Process Industries
- Agrifood & Primary Production
- Services Economy
dates, limes, bananas, alfalfa, vegetables; camels, cattle; fish
crude oil production and refining, natural and liquefied natural gas (LNG) production; construction, cement, copper, steel, chemicals, optic fiber
3.5% (2013 est.)
Structural Transformation & ComplexityBack to top ↑
Business Dynamism & EntrepreneurshipBack to top ↑
- Entrepreneurship & Firm Creation
- Risk Capital & Scale-Up Finance
- Firm Growth, Exit & Renewal
- Competition & Market Contestability
Innovation & CommercialisationBack to top ↑
- Business Innovation Capability
- Research Commercialisation & Knowledge Transfer
- Intellectual Property & Intangible Assets
- Innovation Ecosystems & Clusters
Technology Adoption & DiffusionBack to top ↑
GINC Capability Domains · Chapter 12
Trade and Investment
🇴🇲 Oman’s markets, capital and the terms of global exchange
Overall tradeBack to top ↑
$69.7B of exports to 116 partners and $24.6B of imports from 107 in 2024, a surplus of $45.0B.
- Exports
- $69.7B116 partners
- Imports
- $24.6B107 partners
- Balance
- +$45.0Bsurplus
- Total trade
- $94.3B2024
ExportsBack to top ↑
Where its exports go
The largest partners in 2024, with each one's share of the nation's exports.
| Partner | Value | Share | |
|---|---|---|---|
| China | $30.9B | 44% | |
| South Korea | $5.66B | 8.1% | |
| India | $4.52B | 6.5% | |
| Saudi Arabia | $3.60B | 5.2% | |
| South Africa | $2.97B | 4.3% | |
| Japan | $2.55B | 3.7% | |
| Taiwan | $2.32B | 3.3% | |
| Indonesia | $1.32B | 1.9% | |
| United States | $1.29B | 1.8% | |
| Pakistan | $1.20B | 1.7% | |
| Thailand | $1.00B | 1.4% | |
| Turkey | $899M | 1.3% | |
| Qatar | $893M | 1.3% | |
| Brazil | $880M | 1.3% | |
| Singapore | $782M | 1.1% | |
| Egypt | $663M | 1.0% | |
| Malaysia | $656M | 0.9% | |
| Madagascar | $653M | 0.9% | |
| Kenya | $532M | 0.8% | |
| Mozambique | $509M | 0.7% |
What it exports
The largest categories in 2024.
| Category | Value | Share | |
|---|---|---|---|
| Mineral fuels, oils, distillation products | $51.9B | 74% | |
| Iron and steel | $3.03B | 4.3% | |
| Fertilizers | $2.83B | 4.1% | |
| Organic chemicals | $2.63B | 3.8% | |
| Ores slag and ash | $1.98B | 2.8% | |
| Plastics | $1.73B | 2.5% | |
| Aluminum | $1.14B | 1.6% | |
| Salt, sulphur, earth, stone, plaster, lime and cement | $635M | 0.9% | |
| Inorganic chemicals, precious metal compound, isotope | $589M | 0.8% | |
| Fish, crustaceans, molluscs, aquatics invertebrates | $355M | 0.5% | |
| Articles of iron or steel | $350M | 0.5% | |
| Electrical, electronic equipment | $318M | 0.5% | |
| Pearls, precious stones, metals, coins | $304M | 0.4% | |
| Machinery, nuclear reactors, boilers | $280M | 0.4% | |
| Aircraft, spacecraft | $204M | 0.3% |
ImportsBack to top ↑
Where its imports come from
The largest partners in 2024, with each one's share of the nation's imports.
| Partner | Value | Share | |
|---|---|---|---|
| China | $5.75B | 23% | |
| India | $3.96B | 16% | |
| United States | $1.67B | 6.8% | |
| Japan | $1.33B | 5.4% | |
| Saudi Arabia | $1.32B | 5.4% | |
| Brazil | $1.20B | 4.9% | |
| Germany | $897M | 3.6% | |
| South Korea | $625M | 2.5% | |
| United Kingdom | $561M | 2.3% | |
| Australia | $513M | 2.1% | |
| Italy | $470M | 1.9% | |
| Hong Kong | $442M | 1.8% | |
| Singapore | $426M | 1.7% | |
| Thailand | $420M | 1.7% | |
| Indonesia | $420M | 1.7% | |
| France | $414M | 1.7% | |
| Netherlands | $414M | 1.7% | |
| Turkey | $394M | 1.6% | |
| Malaysia | $348M | 1.4% | |
| Switzerland | $329M | 1.3% |
What it imports
The largest categories in 2024.
| Category | Value | Share | |
|---|---|---|---|
| Machinery, nuclear reactors, boilers | $3.54B | 14% | |
| Vehicles other than railway, tramway | $2.93B | 12% | |
| Mineral fuels, oils, distillation products | $2.75B | 11% | |
| Electrical, electronic equipment | $1.78B | 7.2% | |
| Articles of iron or steel | $1.19B | 4.8% | |
| Ores slag and ash | $1.05B | 4.3% | |
| Organic chemicals | $816M | 3.3% | |
| Inorganic chemicals, precious metal compound, isotope | $727M | 3.0% | |
| Plastics | $686M | 2.8% | |
| Iron and steel | $643M | 2.6% | |
| Pearls, precious stones, metals, coins | $633M | 2.6% | |
| Dairy products, eggs, honey, edible products | $581M | 2.4% | |
| Optical, photo, technical, medical apparatus | $481M | 2.0% | |
| Cereals | $444M | 1.8% | |
| Pharmaceutical products | $422M | 1.7% |
In a list, the bar runs to the largest in that list. The line is each figure’s history from 2000, drawn to its own peak: it shows the shape of the years, and the value shows the size.
External balanceBack to top ↑
$7.249 billion (2013 est.)//$8.312 billion (2012 est.)
Trade Facilitation & LogisticsBack to top ↑
Trade Policy & Market AccessBack to top ↑
- Trade Policy & Negotiation Capability
- Market Access & Agreements Network
- Trade Law & Enforcement
- Standards, Conformity & Quality Infrastructure
Digital & Services TradeBack to top ↑
- Services Trade Capability
- Digital Trade & E-Commerce
- Data Flows & Digital Trade Governance
- Tourism & Visitor Economy
Investment Attraction & ProjectionBack to top ↑
- Investment Attraction & Facilitation
- Investment Absorption & Linkages
- Outward Investment & Global Corporate Presence
$NA
$NA
Export Capability & SophisticationBack to top ↑
$56.22 billion (2013 est.)//$52.14 billion (2012 est.)
China 31.8%, Japan 12.9%, UAE 10.4%, South Korea 10%, Thailand 4.4%, Singapore 4.4% (2012)
petroleum, reexports, fish, metals, textiles
Global Value Chain PositionBack to top ↑
- Value Chain Participation & Integration
- Value Chain Position & Upgrading
- Regional Integration & Hub Anchoring
Economic Leverage & DependenceBack to top ↑
- Strategic Supply Security
- Concentration Risk & Revenue Stabilisation
- Economic Leverage & Coercion Resistance
$30.75 billion (2013 est.)//$25.63 billion (2012 est.)
UAE 24.1%, Japan 12.5%, India 8.5%, China 6.3%, US 6.1% (2012)
machinery and transport equipment, manufactured goods, food, livestock, lubricants
Oman · you are in
Historical Context
Foundations
GINC Capability Domains
Find in this brief · Oman