
Spain
Spain is a parliamentary monarchy in Europe, home to 48 million people, with its capital at Madrid.
Contents
12 chapters
Foundations
01–03
At a glance
- Area
- 505.4Kkm²#52 World#3 Europe
- Population
- 47.7M#28 World#4 Europe
- GDP (market)
- $1.4T
- GDP (PPP)
- $1.4T#14 World#4 Europe
- GDP per capita
- $30.1K#46 World#22 Europe
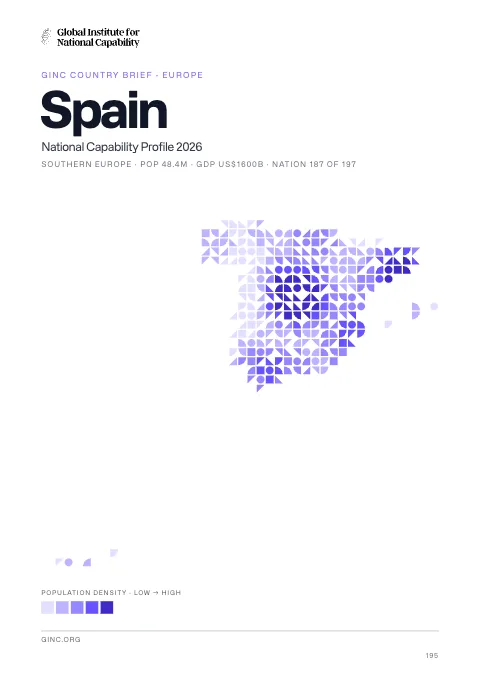
The whole brief
Spain National Capability Profile 2026
Foundations · Chapter 01
Historical Context
🇪🇸 Spain’s understanding the origins and evolution of the modern nation
BackgroundBack to top ↑
Spain's powerful world empire of the 16th and 17th centuries ultimately yielded command of the seas to England. Subsequent failure to embrace the mercantile and industrial revolutions caused the country to fall behind Britain, France, and Germany in economic and political power. Spain remained neutral in World War I and II but suffered through a devastating civil war (1936-39). A peaceful transition to democracy following the death of dictator Francisco FRANCO in 1975, and rapid economic modernization (Spain joined the EU in 1986) gave Spain a dynamic and rapidly growing economy and made it a global champion of freedom and human rights. More recently the government has had to focus on measures to reverse a severe economic recession that began in mid-2008. Austerity measures implemented to reduce a large budget deficit and reassure foreign investors have led to one of the highest unemployment rates in Europe.
IndependenceBack to top ↑
1492; the Iberian peninsula was characterized by a variety of independent kingdoms prior to the Muslim occupation that began in the early 8th century A.D. and lasted nearly seven centuries; the small Christian redoubts of the north began the reconquest almost immediately, culminating in the seizure of Granada in 1492; this event completed the unification of several kingdoms and is traditionally considered the forging of present-day Spain
National holidayBack to top ↑
National Day, 12 October (1492); year when Columbus first set foot in the Americas
Foundations · Chapter 02
Geography
🇪🇸 Spain’s territory, resources and strategic position
Location and areaBack to top ↑
Southwestern Europe, bordering the Mediterranean Sea, North Atlantic Ocean, Bay of Biscay, and Pyrenees Mountains; southwest of France
40 00 N, 4 00 W
Europe
almost five times the size of Kentucky; slightly more than twice the size of Oregon
4,964 km
Terrain and resourcesBack to top ↑
large, flat to dissected plateau surrounded by rugged hills; Pyrenees Mountains in north
coal, lignite, iron ore, copper, lead, zinc, uranium, tungsten, mercury, pyrites, magnesite, fluorspar, gypsum, sepiolite, kaolin, potash, hydropower, arable land
34,700 sq km (2011)
Settlement and hazardsBack to top ↑
periodic droughts, occasional flooding
strategic location along approaches to Strait of Gibraltar; Spain controls a number of territories in northern Morocco including the enclaves of Ceuta and Melilla, and the islands of Penon de Velez de la Gomera, Penon de Alhucemas, and Islas Chafarinas
OtherBack to top ↑
111.5 cu km (2011)
pollution of the Mediterranean Sea from raw sewage and effluents from the offshore production of oil and gas; water quality and quantity nationwide; air pollution; deforestation; desertification
Foundations · Chapter 03
Environment
🇪🇸 Spain’s environmental conditions, resources and national resilience
ClimateBack to top ↑
temperate; clear, hot summers in interior, more moderate and cloudy along coast; cloudy, cold winters in interior, partly cloudy and cool along coast
Emissions and pollutionBack to top ↑
Water, waste and foodBack to top ↑
Resources and agreementsBack to top ↑
GINC Capability Domains · Chapter 04
Critical Technology
🇪🇸 Spain’s technology frontiers and the pursuit of national advantage
Two counts are set side by side for 2015–2024: on the left, the papers researchers in Spain published; on the right, the patent families that began there and were filed in more than one country. First by capability group, then group by group with each group’s capabilities. The badge on a card is the nation’s place among all nations. Papers are from GINC Research Analytics, patent families from GINC Patents.
Research by capability group
#13 WorldPapers published, 2015–2024
8,235
7,402
4,453
4,217
4,126
2,464
2,126
2,039
1,693
120
Patents by capability group
#22 WorldInternational patent families, 2015–2024
1,488
1,259
935
578
543
394
256
154
101
55
Advanced Materials & ManufacturingBack to top ↑
Research
#12 WorldPapers published, 2015–2024
Patents
#14 WorldInternational patent families, 2015–2024
Energy TechnologiesBack to top ↑
Research
#12 WorldPapers published, 2015–2024
Patents
#15 WorldInternational patent families, 2015–2024
Semiconductors & Advanced ComputingBack to top ↑
Research
#11 WorldPapers published, 2015–2024
No research topic: Semiconductor Design & EDA · Advanced Semiconductor Fabrication · Semiconductor Equipment & Materials · Advanced Packaging & Heterogeneous Integration
Patents
#22 WorldInternational patent families, 2015–2024
Artificial IntelligenceBack to top ↑
Research
#14 WorldPapers published, 2015–2024
Patents
#22 WorldInternational patent families, 2015–2024
Quantum TechnologiesBack to top ↑
Research
#12 WorldPapers published, 2015–2024
Patents
#13 WorldInternational patent families, 2015–2024
Connectivity, Cyber & Trust TechnologiesBack to top ↑
Research
#13 WorldPapers published, 2015–2024
Patents
#23 WorldInternational patent families, 2015–2024
Sensing, Timing & NavigationBack to top ↑
Research
#13 WorldPapers published, 2015–2024
Patents
#22 WorldInternational patent families, 2015–2024
Robotics & Autonomous SystemsBack to top ↑
Research
#11 WorldPapers published, 2015–2024
No research topic: Human-Machine Interfaces
Patents
#22 WorldInternational patent families, 2015–2024
Biotechnology & Health TechnologiesBack to top ↑
Research
#12 WorldPapers published, 2015–2024
Patents
#16 WorldInternational patent families, 2015–2024
Medicine and BioTech
Clinical research and life-science invention, drawn from the same series that drive the metric pages. Each card opens the full cross-country comparison.
Space TechnologiesBack to top ↑
Research
#14 WorldPapers published, 2015–2024
Patents
#18 WorldInternational patent families, 2015–2024
GINC Capability Domains · Chapter 05
Strategic Infrastructure
🇪🇸 Spain’s energy, connectivity and the material foundations of capability
Resource InfrastructureBack to top ↑
29,290 bbl/day (2012 est.)
0 bbl/day (2010 est.)
1.061 million bbl/day (2010 est.)
150 million bbl (1 January 2013 est.)
1.189 million bbl/day (2010 est.)
1.384 million bbl/day (2011 est.)
249,500 bbl/day (2010 est.)
566,200 bbl/day (2010 est.)
61 million cu m (2012 est.)
35.82 billion cu m (2010 est.)
4.414 billion cu m (2012 est.)
36.75 billion cu m (2012 est.)
2.548 billion cu m (1 January 2013 est.)
gas 10,481 km; oil 616 km; refined products 3,461 km (2013)
Agriculture & Food InfrastructureBack to top ↑
- Irrigation & Agricultural Water
- Livestock & Veterinary
- Fisheries & Aquaculture
- Storage, Cold Chain & Markets
Energy InfrastructureBack to top ↑
- Thermal Generation
- Nuclear Generation
- Nuclear Fuel Cycle & Radioactive Waste
- Hydropower
- Renewable Generation
- Transmission & Distribution
- System Control & Dispatch
- Storage & Fuel Supply
101.7 million kW (2010 est.)
276.8 billion kWh (2011 est.)
249.7 billion kWh (2011 est.)
19.59 billion kWh (2012 est.)
8.209 billion kWh (2012 est.)
48.7% of total installed capacity (2010 est.)
7.3% of total installed capacity (2010 est.)
13% of total installed capacity (2010 est.)
25.8% of total installed capacity (2010 est.)
318.6 million Mt (2011 est.)
Water, Sanitation & Waste InfrastructureBack to top ↑
- Dams, Reservoirs & Flood Defence
- Water Supply & Treatment
- Bulk Water Transfer & Desalination
- Wastewater & Sanitation
- Solid Waste & Recycling
Advanced ManufacturingBack to top ↑
- Materials & Inputs
- Chemicals & Hazardous Process Industry
- Production Systems
- Supply Chain & Ecosystem
- Workforce & Innovation
Transport InfrastructureBack to top ↑
- Seaports & Terminals
- Air Infrastructure
- Air Navigation & Traffic Management
- Inland Waterways & Ferries
- Rail Infrastructure
- Roads & Bridges
- Logistics, Multimodal & Border Infrastructure
- Postal & Parcel
150 (2013)
10 (2013)
1,000 km (2012)
Communications & Digital InfrastructureBack to top ↑
- Subsea Cables & International Gateways
- Core & Backbone Networks
- Mobile & Wireless Networks
- Spectrum & Broadcasting
- Data Centres, Compute & Cloud
- Data Resources
- AI Tools & Applications
19.22 million (2012)
50.663 million (2012)
28.119 million (2009)
4.228 million (2012)
.es
Financial InfrastructureBack to top ↑
- Currency & Reserves
- Payments & Settlement Systems
- Markets, Exchanges & Depositories
- Banks, Insurers & Systemic Institutions
Social InfrastructureBack to top ↑
- Health Infrastructure
- Public Health & Laboratories
- Medical Supply & Stockpiles
- Education & Skills Infrastructure
- Research & Scientific Facilities
- Housing, Community & Social Services
- Government & Public Administration
- Cultural, Community & Recreational Infrastructure
- Justice & Corrections
- Emergency Services & Civil Protection
- Hydrometeorology & Early Warning
Space, Aerospace & Defence InfrastructureBack to top ↑
GINC Capability Domains · Chapter 06
National Security
🇪🇸 Spain’s force, intelligence and the defence of the nation
Disputes and terrorismBack to top ↑
in 2002, Gibraltar residents voted overwhelmingly by referendum to reject any "shared sovereignty" arrangement; the Government of Gibraltar insists on equal participation in talks between the UK and Spain; Spain disapproves of UK plans to grant Gibraltar greater autonomy; Morocco protests Spain's control over the coastal enclaves of Ceuta, Melilla, and the islands of Penon de Velez de la Gomera, Penon de Alhucemas, and Islas Chafarinas, and surrounding waters; both countries claim Isla Perejil (Leila Island); Morocco serves as the primary launching site of illegal migration into Spain from North Africa; Portugal does not recognize Spanish sovereignty over the territory of Olivenza based on a difference of interpretation of the 1815 Congress of Vienna and the 1801 Treaty of Badajoz
Force Generation & MobilisationBack to top ↑
Spanish Armed Forces: Army (Ejercito de Tierra), Spanish Navy (Armada Espanola, AE; includes Marine Corps), Spanish Air Force (Ejercito del Aire Espanola, EdA) (2013)
18-26 years of age for voluntary military service by a Spanish citizen or legal immigrant, 2-3 year obligation; women allowed to serve in all SAF branches, including combat units; no conscription, but Spanish Government retains right to mobilize citizens 19-25 years of age in a national emergency; mandatory retirement of non-NCO enlisted personnel at age 45 or 58, depending on service length (2013)
0.86% of GDP (2012)//0.95% of GDP (2011)//0.86% of GDP (2010)
Forces under arms
Active-duty strength on the Correlates of War series, which reaches back to 1816 and so carries a nation’s whole record of mobilisation rather than its present establishment. The card opens the full cross-country comparison.
Intelligence & AssessmentBack to top ↑
- Imagery & Geospatial Intelligence
- Signals & Cyber Intelligence
- Technical & Measurement Intelligence
- Open-Source & Financial Intelligence
- Human Intelligence & Counterintelligence
- All-Source Analysis & Warning
Joint Command, Projection & SustainmentBack to top ↑
- Command, Control & Communications
- Strategic Lift & Mobility
- Expeditionary & Peace Operations
- Operational Sustainment & War Reserves
- Defence Industrial Mobilisation
- CBRN Defence
Land PowerBack to top ↑
- Combined Arms Manoeuvre
- Land Fires
- Battlefield Aviation & Uncrewed Systems
- Special Operations & Irregular Warfare
Maritime PowerBack to top ↑
- Maritime Security & Constabulary
- Sea Denial & Undersea Warfare
- Sea Control
- Amphibious & Expeditionary Operations
Air PowerBack to top ↑
- Air Sovereignty & Policing
- Control of the Air
- Air Strike & Interdiction
- Airborne ISR, Early Warning & Battle Management
Strategic Strike & Missile DefenceBack to top ↑
Space OperationsBack to top ↑
Cyber & Electromagnetic OperationsBack to top ↑
Nuclear DeterrenceBack to top ↑
GINC Capability Domains · Chapter 07
Human Capital
🇪🇸 Spain’s population, health and the skills that sustain capability
DemographyBack to top ↑
47,737,941 (July 2014 est.)
0.81% (2014 est.)
9.88 births/1,000 population (2014 est.)
9 deaths/1,000 population (2014 est.)
1.48 children born/woman (2014 est.)
29.8 (2010 est.)
65.7% (2006)
Migration and urbanisationBack to top ↑
7.24 migrant(s)/1,000 population (2014 est.)
MADRID (capital) 6.574 million; Barcelona 5.57 million; Valencia 797,000 (2011)
Welfare and equityBack to top ↑
21.1% (2012)
32 (2005)//32.5 (1990)
DisplacementBack to top ↑
Early Childhood DevelopmentBack to top ↑
Foundational EducationBack to top ↑
5% of GDP (2010)
Advanced EducationBack to top ↑
Technical & Vocational SkillsBack to top ↑
Digital & AI CompetenceBack to top ↑
Generative AI adoption
Modelled share of working-age adults using generative AI, from Microsoft telemetry scaled to each country’s 15–64 population. A measure of how fast a workforce is absorbing the technology rather than of how much of it a nation builds. The card opens the full cross-country comparison.
Lifelong Learning & ReskillingBack to top ↑
Research Talent & Knowledge CreationBack to top ↑
Population HealthBack to top ↑
6 deaths/100,000 live births (2010)
26.6% (2008)
0.4% (2009 est.)
130,000 (2009 est.)
1,600 (2009 est.)
Health System CapabilityBack to top ↑
9.6% of GDP (2010)
3.96 physicians/1,000 population (2011)
3.2 beds/1,000 population (2010)
GINC Capability Domains · Chapter 08
Governance and Integrity
🇪🇸 Spain’s institutions, law and the integrity of the state
State structureBack to top ↑
parliamentary monarchy
17 autonomous communities (comunidades autonomas, singular - comunidad autonoma) and 2 autonomous cities* (ciudades autonomas, singular - ciudad autonoma); Andalucia; Aragon; Asturias; Canarias (Canary Islands); Cantabria; Castilla-La Mancha; Castilla-Leon; Cataluna (Castilian), Catalunya (Catalan), Catalonha (Aranese) [Catalonia]; Ceuta*; Comunidad Valenciana (Castilian), Comunitat Valenciana (Valencian) [Valencian Community]; Extremadura; Galicia; Illes Baleares (Balearic Islands); La Rioja; Madrid; Melilla*; Murcia; Navarra (Castilian), Nafarroa (Basque) [Navarre]; Pais Vasco (Castilian), Euskadi (Basque) [Basque Country]
previous 1812; latest approved by legislature 31 October 1978, passed by referendum 6 December 1978, signed by the king 27 December 1978, effective 29 December 1978; amended 1992, 2011 (2013)
18 years of age; universal
Political Institutions & Civic ParticipationBack to top ↑
- Electoral Management & Integrity
- Legislature & Deliberative Institutions
- Citizen Participation & Civic Space
bicameral; General Courts or Las Cortes Generales (National Assembly) consists of the Senate or Senado (257 seats as of 2013; 208 members directly elected by popular vote and the other 49 - as of 2013 - appointed by the regional legislatures and 265 seats as of 2014; 208 members directly elected by popular vote and the other 57 - as of 2014 - appointed by the regional legislatures; members to serve four-year terms) and the Congress of Deputies or Congreso de los Diputados (350 seats; each of the 50 electoral provinces fills a minimum of two seats and the North African enclaves of Ceuta and Melilla fill one seat each with members serving a four-year term; the other 248 members are determined by proportional representation based on popular vote on block lists who serve four-year terms)
Amaiur [collective leadership] (a separatist political coalition that advocates Basque independence from Spain)//Basque Nationalist Party or PNV or EAJ [Inigo URKULLU Renteria]//Canarian Coalition or CC [Claudina MORALES Rodriquez] (a coalition of five parties)//Ciutadans [Albert Rivera] (an anti-separatist Catalan party)//Convergence and Union or CiU [Artur MAS i Gavarro] (a coalition of the Democratic Convergence of Catalonia or CDC [Artur MAS i Gavarro] and the Democratic Union of Catalonia or UDC [Josep Antoni DURAN i LLEIDA])//Entesa Catalonia de Progress (a Senate coalition grouping four Catalan parties - PSC, ERC, ICV, EUA)//Galician Nationalist Bloc or BNG [Guillerme VAZQUEZ Vazquez]//Initiative for Catalonia Greens or ICV [Joan HERRERA i Torres]//Yes to the Future or Geroa Bai [collective leadership] (a coalition of four Navarran parties)//Popular Party or PP [Mariano RAJOY Brey]//Republican Left of Catalonia or ERC [Oriol JUNQUERAS i Vies]//Spanish Socialist Workers Party or PSOE [Alfredo Perez RUBALCABA]//Union of People of Navarra or UPN [Yolanda BARCINA Angulo]//Union, Progress and Democracy or UPyD [Rosa DIEZ Gonzalez]//United Left or IU [Cayo LARA Moya] (a coalition of parties including the Communist Party of Spain or PCE and other small parties)
Association for Victims of Terrorism or AVT (grassroots organization devoted primarily to supporting victims of the Basque Fatherland and Liberty (ETA) terrorist organization)//15-M or 15 May protest movement, which is also known as the Indignados, Spanish for the "indignant ones" (a loose association of grassroots organizations that advocate for greater accountability and transparency in Spanish politics, increased social justice and job creation)//Socialist General Union of Workers or UGT and the smaller independent Workers Syndical Union or USO//Trade Union Confederation of Workers' Commissions or CC.OO.//Spanish Confederation of Employers' Organizations or CEOE//
Justice System & Fundamental RightsBack to top ↑
- Judicial Independence & Court Capability
- Access to Justice & Legal Services
- Fundamental Rights Protection
- Human Rights Institutions & Equality Bodies
civil law system with regional variations
accepts compulsory ICJ jurisdiction with reservations; accepts ICCt jurisdiction
Internal Security & OrderBack to top ↑
despite rigorous law enforcement efforts, North African, Latin American, Galician, and other European traffickers take advantage of Spain's long coastline to land large shipments of cocaine and hashish for distribution to the European market; consumer for Latin American cocaine and North African hashish; destination and minor transshipment point for Southwest Asian heroin; money-laundering site for Colombian narcotics trafficking organizations and organized crime
Regulatory Governance & Strategic ControlsBack to top ↑
- Regulatory Quality & Better Regulation
- Regulatory Delivery & Independent Regulators
- Strategic Controls & Economic Security Administration
Government Effectiveness & Public AdministrationBack to top ↑
- Centre of Government & Policy Coordination
- Civil Service & Public Workforce
- Digital Government & Service Delivery
- Legal Identity & Civil Registration
- Statistical & Data Capability
Public Integrity & Anti-CorruptionBack to top ↑
Transparency, Oversight & AccountabilityBack to top ↑
- Right to Information & Open Government
- Independent Oversight & Supreme Audit
- Independent Media & Journalist Safety
National Resilience & Crisis ManagementBack to top ↑
GINC Capability Domains · Chapter 09
Information and Influence
🇪🇸 Spain’s identity, media and the projection of influence
Identity and cultureBack to top ↑
Castilian Spanish (official) 74%, Catalan 17%, Galician 7%, and Basque 2%
Roman Catholic 94%, other 6%
composite of Mediterranean and Nordic types
Pillars of Hercules
three horizontal bands of red (top), yellow (double width), and red with the national coat of arms on the hoist side of the yellow band; the coat of arms is quartered to display the emblems of the traditional kingdoms of Spain (clockwise from upper left, Castile, Leon, Navarre, and Aragon) while Granada is represented by the stylized pomegranate at the bottom of the shield; the arms are framed by two columns representing the Pillars of Hercules, which are the two promontories (Gibraltar and Ceuta) on either side of the eastern end of the Strait of Gibraltar; the red scroll across the two columns bears the imperial motto of "Plus Ultra" (further beyond) referring to Spanish lands beyond Europe; the triband arrangement with the center stripe twice the width of the outer dates to the 18th century
Diplomatic Statecraft & Global NetworksBack to top ↑
- Diplomatic Network & Consular Reach
- Multilateral Leadership & Norm Setting
- Agenda-Setting & Convening
- Mediation & Crisis Diplomacy
ADB (nonregional member), AfDB (nonregional member), Arctic Council (observer), Australia Group, BCIE, BIS, CAN (observer), CBSS (observer), CD, CE, CERN, EAPC, EBRD, ECB, EIB, EITI (implementing country), EMU, ESA, EU, FAO, FATF, IADB, IAEA, IBRD, ICAO, ICRM, IDA, IEA, IFAD, IFC, IFRCS, IHO, ILO, IMF, IMO, IMSO, Interpol, IOC, IOM, IPU, ISO, ITSO, ITU, ITUC (NGOs), LAIA (observer), MIGA, NATO, NEA, NSG, OAS (observer), OECD, OPCW, OSCE, Pacific Alliance (observer), Paris Club, PCA, Schengen Convention, SELEC (observer), SICA (observer), UN, UNCTAD, UNESCO, UNHCR, UNIDO, UNIFIL, Union Latina, UNRWA, UNWTO, UPU, WCO, WHO, WIPO, WMO, WTO, ZC
Alliances & Security CooperationBack to top ↑
Development Cooperation & Global AssistanceBack to top ↑
Culture, Language & Education DiplomacyBack to top ↑
- Cultural & Language Institutes
- Creative Industries & Cultural Export Reach
- Heritage & Cultural Institutions
- Education Diplomacy & Alumni Networks
- Sports & Major Events
Diaspora & Global CommunitiesBack to top ↑
Information Environment & Strategic CommunicationBack to top ↑
- Strategic Communications & Public Diplomacy
- International Media & Broadcasting
- Information Defence & Counter-Interference
a mixture of both publicly operated and privately owned TV and radio stations; overall, hundreds of TV channels are available including national, regional, local, public, and international channels; satellite and cable TV systems available; multiple national radio networks, a large number of regional radio networks, and a larger number of local radio stations; overall, hundreds of radio stations (2008)
GINC Capability Domains · Chapter 10
Financial Strength
🇪🇸 Spain’s fiscal depth, reserves and the capacity to act
Monetary & Currency CapabilityBack to top ↑
- Monetary Policy & Price Stability
- Exchange Rate & External Account Management
- Currency Issuance & Digital Money
1.8% (2013 est.)//2.4% (2012 est.)
euros (EUR) per US dollar -//0.7634 (2013 est.)//0.7752 (2012 est.)//0.755 (2010 est.)//0.7198 (2009 est.)//0.6827 (2008 est.)
0.75% (31 December 2013)//1.5% (31 December 2010)
8% (31 December 2013 est.)//NA% (31 December 2012 est.)
$777.3 billion (31 December 2013 est.)//$785.2 billion (31 December 2012 est.)
$2.003 trillion (31 December 2013 est.)//$2.096 trillion (31 December 2012 est.)
Fiscal Capacity & Public FinanceBack to top ↑
- Revenue Mobilisation & Tax Administration
- Public Expenditure & Budget Management
- Sovereign Debt & Treasury Management
- Public Investment Management
37.1% of GDP (2013 est.)
-6.8% of GDP (2013 est.)
93.7% of GDP (2013 est.)//85.9% of GDP (2012 est.)
calendar year
Financial System Depth & AccessBack to top ↑
- Banking System Capacity
- Capital Markets Depth & Development
- Long-Term & Institutional Capital
- Financial Inclusion & Household Access
- Development & Policy Finance
$2.936 trillion (31 December 2013 est.)//$3.045 trillion (31 December 2012 est.)
$995.1 billion (31 December 2012 est.)//$1.031 trillion (31 December 2011)//$1.172 trillion (31 December 2010 est.)
18.9% of GDP (2013 est.)//18.6% of GDP (2012 est.)//17.5% of GDP (2011 est.)
Financial Regulation & IntegrityBack to top ↑
- Prudential Regulation & Supervision
- Financial Integrity & Illicit Finance Control
- Market Conduct & Consumer Protection
- Payment & Market Infrastructure Oversight
Financial Stability & Crisis ManagementBack to top ↑
- Macroprudential & Systemic Oversight
- Crisis Management, Resolution & Deposit Insurance
- External Liquidity & Financial Safety Nets
Sovereign Capital & External Financial PowerBack to top ↑
- Official Reserves Management
- Sovereign Wealth & Public Asset Management
- Currency Internationalisation & Reserve Status
- Capital Account & Flow Management
- International Financial Centre Capability
$50.59 billion (31 December 2012 est.)//$47.1 billion (31 December 2011 est.)
$2.278 trillion (31 December 2012 est.)//$2.269 trillion (31 December 2011)
GINC Capability Domains · Chapter 11
Production and Innovation
🇪🇸 Spain’s output, industry and the engine of prosperity
Economic Output & ProductivityBack to top ↑
Spain experienced a prolonged recession in the wake of the global financial crisis. GDP contracted by 3.7% in 2009, ending a 16-year growth trend, and continued contracting through most of 2013. Economic growth resumed in late 2013, albeit only modestly, as credit contraction in the private sector, fiscal austerity, and high unemployment continued to weigh on domestic consumption and investment. Exports, however, have been resilient throughout the economic downturn, partially offsetting declines in domestic consumption and helped to bring Spain's current account into surplus in 2013 for the first time since 1986. The unemployment rate rose from a low of about 8% in 2007 to more than 26% in 2013, straining Spain's public finances as spending on social benefits increased while tax revenues fell. Spain’s budget deficit peaked at 11.4% of GDP in 2009. Spain gradually reduced the deficit to just under 7% of GDP in 2013, slightly above the 6.5% target negotiated between Spain and the EU. Public debt has increased substantially – from 60.1% of GDP in 2010 to 93.4% in 2013. Rising labor productivity, moderating labor costs, and lower inflation have helped to improve foreign investor interest in the economy and to reduce government borrowing costs. The government's ongoing efforts to implement reforms - labor, pension, health, tax, and education - are aimed at supporting investor sentiment. The government also has shored up struggling banks exposed to Spain's depressed domestic construction and real estate sectors by successfully completing an EU-funded restructuring and recapitalization program in December 2013.
$1.389 trillion (2013 est.)//$1.407 trillion (2012 est.)//$1.43 trillion (2011 est.)
-1.3% (2013 est.)//-1.6% (2012 est.)//0.1% (2011 est.)
$30,100 (2013 est.)//$30,500 (2012 est.)//$31,000 (2011 est.)
$1.356 trillion (2013 est.)
Labour & EmploymentBack to top ↑
- Employment & Labour Force Participation
- Labour Market Institutions & Wage Setting
- Employment Services & Skills Matching
- Labour Adjustment, Transition & Formalisation
23.2 million (2013 est.)
26.3% (2013 est.)//25.1% (2012 est.)
Industrial & Sectoral BaseBack to top ↑
- Manufacturing & Advanced Industry
- Foundational & Process Industries
- Agrifood & Primary Production
- Services Economy
grain, vegetables, olives, wine grapes, sugar beets, citrus; beef, pork, poultry, dairy products; fish
textiles and apparel (including footwear), food and beverages, metals and metal manufactures, chemicals, shipbuilding, automobiles, machine tools, tourism, clay and refractory products, footwear, pharmaceuticals, medical equipment
-1.2% (2013 est.)
Structural Transformation & ComplexityBack to top ↑
Business Dynamism & EntrepreneurshipBack to top ↑
- Entrepreneurship & Firm Creation
- Risk Capital & Scale-Up Finance
- Firm Growth, Exit & Renewal
- Competition & Market Contestability
Innovation & CommercialisationBack to top ↑
- Business Innovation Capability
- Research Commercialisation & Knowledge Transfer
- Intellectual Property & Intangible Assets
- Innovation Ecosystems & Clusters
Technology Adoption & DiffusionBack to top ↑
GINC Capability Domains · Chapter 12
Trade and Investment
🇪🇸 Spain’s markets, capital and the terms of global exchange
Overall tradeBack to top ↑
$395B of exports to 221 partners and $440B of imports from 225 in 2024, a deficit of $45.6B.
- Exports
- $395B221 partners
- Imports
- $440B225 partners
- Balance
- −$45.6Bdeficit
- Total trade
- $835B2024
ExportsBack to top ↑
Where its exports go
The largest partners in 2024, with each one's share of the nation's exports.
| Partner | Value | Share | |
|---|---|---|---|
| France | $53.6B | 14% | |
| Germany | $39.5B | 10.0% | |
| Portugal | $37.1B | 9.4% | |
| Italy | $34.3B | 8.7% | |
| United Kingdom | $26.3B | 6.7% | |
| United States | $21.2B | 5.4% | |
| Morocco | $15.9B | 4.0% | |
| Netherlands | $11.6B | 2.9% | |
| Belgium | $10.1B | 2.6% | |
| Turkey | $9.47B | 2.4% | |
| Poland | $8.82B | 2.2% | |
| China | $8.39B | 2.1% | |
| Switzerland | $8.06B | 2.0% | |
| Mexico | $6.12B | 1.6% | |
| Czech Republic | $4.46B | 1.1% | |
| Brazil | $4.17B | 1.1% | |
| Romania | $4.12B | 1.0% | |
| Japan | $3.42B | 0.9% | |
| Austria | $3.36B | 0.9% | |
| Sweden | $3.31B | 0.8% |
What it exports
The largest categories in 2024.
| Category | Value | Share | |
|---|---|---|---|
| Vehicles other than railway, tramway | $67.1B | 17% | |
| Machinery, nuclear reactors, boilers | $28.6B | 7.2% | |
| Electrical, electronic equipment | $22.2B | 5.6% | |
| Pharmaceutical products | $21.3B | 5.4% | |
| Mineral fuels, oils, distillation products | $20.2B | 5.1% | |
| Plastics | $15.2B | 3.9% | |
| Edible fruits, nuts, peel of citrus fruit, melons | $11.4B | 2.9% | |
| Meat and edible meat offal | $10.3B | 2.6% | |
| Edible vegetables and certain roots and tubers | $10.0B | 2.5% | |
| Animal, vegetable fats and oils, cleavage products | $9.87B | 2.5% | |
| Essential oils, perfumes, cosmetics, toiletries | $9.17B | 2.3% | |
| Articles of iron or steel | $8.83B | 2.2% | |
| Organic chemicals | $8.80B | 2.2% | |
| Iron and steel | $8.40B | 2.1% | |
| Pearls, precious stones, metals, coins | $6.41B | 1.6% |
ImportsBack to top ↑
Where its imports come from
The largest partners in 2024, with each one's share of the nation's imports.
| Partner | Value | Share | |
|---|---|---|---|
| Germany | $50.0B | 11% | |
| China | $46.1B | 10% | |
| France | $40.2B | 9.1% | |
| Italy | $30.2B | 6.8% | |
| United States | $28.8B | 6.5% | |
| Netherlands | $20.2B | 4.6% | |
| Portugal | $17.7B | 4.0% | |
| Morocco | $11.5B | 2.6% | |
| United Kingdom | $10.6B | 2.4% | |
| Belgium | $10.4B | 2.4% | |
| Turkey | $10.2B | 2.3% | |
| Brazil | $9.65B | 2.2% | |
| Poland | $8.89B | 2.0% | |
| Nigeria | $6.53B | 1.5% | |
| Mexico | $6.39B | 1.4% | |
| India | $6.23B | 1.4% | |
| Algeria | $6.01B | 1.4% | |
| Czech Republic | $5.57B | 1.3% | |
| Vietnam | $5.41B | 1.2% | |
| Switzerland | $5.24B | 1.2% |
What it imports
The largest categories in 2024.
| Category | Value | Share | |
|---|---|---|---|
| Mineral fuels, oils, distillation products | $61.3B | 14% | |
| Vehicles other than railway, tramway | $46.6B | 11% | |
| Machinery, nuclear reactors, boilers | $42.0B | 9.5% | |
| Electrical, electronic equipment | $40.2B | 9.1% | |
| Pharmaceutical products | $22.2B | 5.0% | |
| Plastics | $16.7B | 3.8% | |
| Optical, photo, technical, medical apparatus | $11.4B | 2.6% | |
| Iron and steel | $11.0B | 2.5% | |
| Organic chemicals | $11.0B | 2.5% | |
| Articles of apparel, knit or crocheted | $10.5B | 2.4% | |
| Articles of apparel, not knit or crocheted | $10.4B | 2.4% | |
| Fish, crustaceans, molluscs, aquatics invertebrates | $6.79B | 1.5% | |
| Articles of iron or steel | $6.46B | 1.5% | |
| Animal, vegetable fats and oils, cleavage products | $6.00B | 1.4% | |
| Furniture, lighting signs, prefabricated buildings | $5.68B | 1.3% |
In a list, the bar runs to the largest in that list. The line is each figure’s history from 2000, drawn to its own peak: it shows the shape of the years, and the value shows the size.
External balanceBack to top ↑
$2.1 billion (2013 est.)//-$15.14 billion (2012 est.)
Trade Facilitation & LogisticsBack to top ↑
Trade Policy & Market AccessBack to top ↑
- Trade Policy & Negotiation Capability
- Market Access & Agreements Network
- Trade Law & Enforcement
- Standards, Conformity & Quality Infrastructure
Digital & Services TradeBack to top ↑
- Services Trade Capability
- Digital Trade & E-Commerce
- Data Flows & Digital Trade Governance
- Tourism & Visitor Economy
Investment Attraction & ProjectionBack to top ↑
- Investment Attraction & Facilitation
- Investment Absorption & Linkages
- Outward Investment & Global Corporate Presence
$779.5 billion (31 December 2013 est.)//$725.3 billion (31 December 2012 est.)
$714.4 billion (31 December 2013 est.)//$710.2 billion (31 December 2012 est.)
Export Capability & SophisticationBack to top ↑
$458 billion (2013 est.)//$432 billion (2012 est.)
France 16.8%, Germany 10.8%, Italy 7.7%, Portugal 7.1%, UK 6.5% (2012)
machinery, motor vehicles; foodstuffs, pharmaceuticals, medicines, other consumer goods
Global Value Chain PositionBack to top ↑
- Value Chain Participation & Integration
- Value Chain Position & Upgrading
- Regional Integration & Hub Anchoring
Economic Leverage & DependenceBack to top ↑
- Strategic Supply Security
- Concentration Risk & Revenue Stabilisation
- Economic Leverage & Coercion Resistance
$431 billion (2013 est.)//$422 billion (2012 est.)
Germany 11.8%, France 11.5%, Italy 6.7%, China 5.6%, Netherlands 5.4%, UK 4.1% (2012)
machinery and equipment, fuels, chemicals, semifinished goods, foodstuffs, consumer goods, measuring and medical control instruments
Spain · you are in
Historical Context
Foundations
GINC Capability Domains
Find in this brief · Spain