
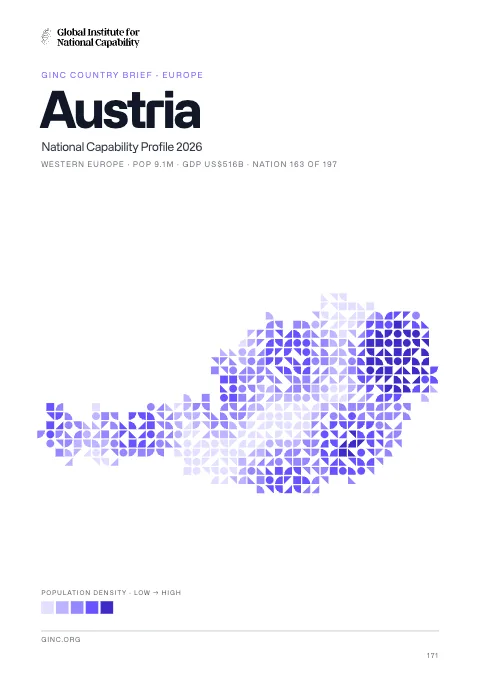
Austria
Austria is a landlocked federal republic in Europe, home to 8.2 million people, with its capital at Vienna.
Contents
12 chapters
Foundations
01–03
At a glance
- Area
- 83.9Kkm²#114 World#17 Europe
- Population
- 8.2M#94 World#16 Europe
- GDP (market)
- $418B
- GDP (PPP)
- $361B#37 World#10 Europe
- GDP per capita
- $42.6K#23 World#11 Europe
The whole brief
Austria National Capability Profile 2026
Foundations · Chapter 01
Historical Context
🇦🇹 Austria’s understanding the origins and evolution of the modern nation
BackgroundBack to top ↑
Once the center of power for the large Austro-Hungarian Empire, Austria was reduced to a small republic after its defeat in World War I. Following annexation by Nazi Germany in 1938 and subsequent occupation by the victorious Allies in 1945, Austria's status remained unclear for a decade. A State Treaty signed in 1955 ended the occupation, recognized Austria's independence, and forbade unification with Germany. A constitutional law that same year declared the country's "perpetual neutrality" as a condition for Soviet military withdrawal. The Soviet Union's collapse in 1991 and Austria's entry into the European Union in 1995 have altered the meaning of this neutrality. A prosperous, democratic country, Austria entered the EU Economic and Monetary Union in 1999.
IndependenceBack to top ↑
12 November 1918 (republic proclaimed); notable earlier dates: 976 (Margravate of Austria established); 17 September 1156 (Duchy of Austria founded); 11 August 1804 (Austrian Empire proclaimed)
National holidayBack to top ↑
National Day, 26 October (1955); note - commemorates the passage of the law on permanent neutrality
Foundations · Chapter 02
Geography
🇦🇹 Austria’s territory, resources and strategic position
Location and areaBack to top ↑
Central Europe, north of Italy and Slovenia
47 20 N, 13 20 E
Europe
slightly smaller than Maine
0 km (landlocked)
none (landlocked)
Terrain and resourcesBack to top ↑
in the west and south mostly mountains (Alps); along the eastern and northern margins mostly flat or gently sloping
oil, coal, lignite, timber, iron ore, copper, zinc, antimony, magnesite, tungsten, graphite, salt, hydropower
1,170 sq km (2007)
Settlement and hazardsBack to top ↑
landslides; avalanches; earthquakes
landlocked; strategic location at the crossroads of central Europe with many easily traversable Alpine passes and valleys; major river is the Danube; population is concentrated on eastern lowlands because of steep slopes, poor soils, and low temperatures elsewhere
OtherBack to top ↑
77.7 cu km (2011)
some forest degradation caused by air and soil pollution; soil pollution results from the use of agricultural chemicals; air pollution results from emissions by coal- and oil-fired power stations and industrial plants and from trucks transiting Austria between northern and southern Europe
Foundations · Chapter 03
Environment
🇦🇹 Austria’s environmental conditions, resources and national resilience
ClimateBack to top ↑
temperate; continental, cloudy; cold winters with frequent rain and some snow in lowlands and snow in mountains; moderate summers with occasional showers
Emissions and pollutionBack to top ↑
Water, waste and foodBack to top ↑
Resources and agreementsBack to top ↑
GINC Capability Domains · Chapter 04
Critical Technology
🇦🇹 Austria’s technology frontiers and the pursuit of national advantage
Two counts are set side by side for 2015–2024: on the left, the papers researchers in Austria published; on the right, the patent families that began there and were filed in more than one country. First by capability group, then group by group with each group’s capabilities. The badge on a card is the nation’s place among all nations. Papers are from GINC Research Analytics, patent families from GINC Patents.
Research by capability group
#30 WorldPapers published, 2015–2024
2,533
2,478
1,498
1,490
1,444
933
717
510
447
26
Patents by capability group
#21 WorldInternational patent families, 2015–2024
1,338
885
873
629
553
548
487
480
100
41
Advanced Materials & ManufacturingBack to top ↑
Research
#29 WorldPapers published, 2015–2024
Patents
#16 WorldInternational patent families, 2015–2024
Energy TechnologiesBack to top ↑
Research
#37 WorldPapers published, 2015–2024
Patents
#17 WorldInternational patent families, 2015–2024
Semiconductors & Advanced ComputingBack to top ↑
Research
#25 WorldPapers published, 2015–2024
No research topic: Semiconductor Design & EDA · Advanced Semiconductor Fabrication · Semiconductor Equipment & Materials · Advanced Packaging & Heterogeneous Integration
Patents
#12 WorldInternational patent families, 2015–2024
Artificial IntelligenceBack to top ↑
Research
#38 WorldPapers published, 2015–2024
Patents
#25 WorldInternational patent families, 2015–2024
Quantum TechnologiesBack to top ↑
Research
#16 WorldPapers published, 2015–2024
Patents
#14 WorldInternational patent families, 2015–2024
Connectivity, Cyber & Trust TechnologiesBack to top ↑
Research
#36 WorldPapers published, 2015–2024
Patents
#24 WorldInternational patent families, 2015–2024
Sensing, Timing & NavigationBack to top ↑
Research
#36 WorldPapers published, 2015–2024
Patents
#17 WorldInternational patent families, 2015–2024
Robotics & Autonomous SystemsBack to top ↑
Research
#30 WorldPapers published, 2015–2024
No research topic: Human-Machine Interfaces
Patents
#19 WorldInternational patent families, 2015–2024
Biotechnology & Health TechnologiesBack to top ↑
Research
#28 WorldPapers published, 2015–2024
Patents
#22 WorldInternational patent families, 2015–2024
Medicine and BioTech
Clinical research and life-science invention, drawn from the same series that drive the metric pages. Each card opens the full cross-country comparison.
Space TechnologiesBack to top ↑
Research
#33 WorldPapers published, 2015–2024
Patents
#21 WorldInternational patent families, 2015–2024
GINC Capability Domains · Chapter 05
Strategic Infrastructure
🇦🇹 Austria’s energy, connectivity and the material foundations of capability
Resource InfrastructureBack to top ↑
29,480 bbl/day (2012 est.)
0 bbl/day (2011 est.)
139,000 bbl/day (2011 est.)
85 million bbl (1 January 2012 est.)
159,200 bbl/day (2011 est.)
210,700 bbl/day (2011 est.)
43,010 bbl/day (2011 est.)
117,100 bbl/day (2011 est.)
1.906 billion cu m (2012 est.)
9 billion cu m (2012 est.)
34.75 billion cu m (2012 est.)
42.56 billion cu m (2012 est.)
10.82 billion cu m (1 January 2013 est.)
gas 4,736 km; oil 663 km; refined products 157 km (2013)
Agriculture & Food InfrastructureBack to top ↑
- Irrigation & Agricultural Water
- Livestock & Veterinary
- Fisheries & Aquaculture
- Storage, Cold Chain & Markets
Energy InfrastructureBack to top ↑
- Thermal Generation
- Nuclear Generation
- Nuclear Fuel Cycle & Radioactive Waste
- Hydropower
- Renewable Generation
- Transmission & Distribution
- System Control & Dispatch
- Storage & Fuel Supply
21.11 million kW (2010 est.)
69 billion kWh (2012 est.)
63.8 billion kWh (2011 est.)
20.46 billion kWh (2012 est.)
23.26 billion kWh (2012 est.)
27.5% of total installed capacity (2012 est.)
0% of total installed capacity (2012 est.)
59.6% of total installed capacity (2012 est.)
12.8% of total installed capacity (2012 est.)
67.18 million Mt (2011 est.)
Water, Sanitation & Waste InfrastructureBack to top ↑
- Dams, Reservoirs & Flood Defence
- Water Supply & Treatment
- Bulk Water Transfer & Desalination
- Wastewater & Sanitation
- Solid Waste & Recycling
Advanced ManufacturingBack to top ↑
- Materials & Inputs
- Chemicals & Hazardous Process Industry
- Production Systems
- Supply Chain & Ecosystem
- Workforce & Innovation
Transport InfrastructureBack to top ↑
- Seaports & Terminals
- Air Infrastructure
- Air Navigation & Traffic Management
- Inland Waterways & Ferries
- Rail Infrastructure
- Roads & Bridges
- Logistics, Multimodal & Border Infrastructure
- Postal & Parcel
52 (2013)
1 (2013)
358 km (2011)
Communications & Digital InfrastructureBack to top ↑
- Subsea Cables & International Gateways
- Core & Backbone Networks
- Mobile & Wireless Networks
- Spectrum & Broadcasting
- Data Centres, Compute & Cloud
- Data Resources
- AI Tools & Applications
3.342 million (2012)
13.59 million (2012)
6.143 million (2009)
3.512 million (2012)
.at
Financial InfrastructureBack to top ↑
- Currency & Reserves
- Payments & Settlement Systems
- Markets, Exchanges & Depositories
- Banks, Insurers & Systemic Institutions
Social InfrastructureBack to top ↑
- Health Infrastructure
- Public Health & Laboratories
- Medical Supply & Stockpiles
- Education & Skills Infrastructure
- Research & Scientific Facilities
- Housing, Community & Social Services
- Government & Public Administration
- Cultural, Community & Recreational Infrastructure
- Justice & Corrections
- Emergency Services & Civil Protection
- Hydrometeorology & Early Warning
Space, Aerospace & Defence InfrastructureBack to top ↑
GINC Capability Domains · Chapter 06
National Security
🇦🇹 Austria’s force, intelligence and the defence of the nation
Disputes and terrorismBack to top ↑
none
Force Generation & MobilisationBack to top ↑
Land Forces (KdoLdSK), Air Forces (KdoLuSK)
registration requirement at age 17, the legal minimum age for voluntary military service; 18 is the legal minimum age for compulsory service; males under the age of 35 must complete basic military training (6 month duration); males 18 to 50 years old in the militia or inactive reserve are subject to compulsory service (2012)
0.81% of GDP (2012)//0.82% of GDP (2011)//0.81% of GDP (2010)
Forces under arms
Active-duty strength on the Correlates of War series, which reaches back to 1816 and so carries a nation’s whole record of mobilisation rather than its present establishment. The card opens the full cross-country comparison.
Intelligence & AssessmentBack to top ↑
- Imagery & Geospatial Intelligence
- Signals & Cyber Intelligence
- Technical & Measurement Intelligence
- Open-Source & Financial Intelligence
- Human Intelligence & Counterintelligence
- All-Source Analysis & Warning
Joint Command, Projection & SustainmentBack to top ↑
- Command, Control & Communications
- Strategic Lift & Mobility
- Expeditionary & Peace Operations
- Operational Sustainment & War Reserves
- Defence Industrial Mobilisation
- CBRN Defence
Land PowerBack to top ↑
- Combined Arms Manoeuvre
- Land Fires
- Battlefield Aviation & Uncrewed Systems
- Special Operations & Irregular Warfare
Maritime PowerBack to top ↑
- Maritime Security & Constabulary
- Sea Denial & Undersea Warfare
- Sea Control
- Amphibious & Expeditionary Operations
Air PowerBack to top ↑
- Air Sovereignty & Policing
- Control of the Air
- Air Strike & Interdiction
- Airborne ISR, Early Warning & Battle Management
Strategic Strike & Missile DefenceBack to top ↑
Space OperationsBack to top ↑
Cyber & Electromagnetic OperationsBack to top ↑
Nuclear DeterrenceBack to top ↑
GINC Capability Domains · Chapter 07
Human Capital
🇦🇹 Austria’s population, health and the skills that sustain capability
DemographyBack to top ↑
8,223,062 (July 2014 est.)
0.01% (2014 est.)
8.76 births/1,000 population (2014 est.)
10.38 deaths/1,000 population (2014 est.)
1.43 children born/woman (2014 est.)
28.5 (2011 est.)
69.6%
Migration and urbanisationBack to top ↑
1.76 migrant(s)/1,000 population (2014 est.)
VIENNA (capital) 1.72 million (2011)
Welfare and equityBack to top ↑
6.2% (2012)
26.3 (2007)//31 (1995)
DisplacementBack to top ↑
Early Childhood DevelopmentBack to top ↑
Foundational EducationBack to top ↑
5.9% of GDP (2010)
Advanced EducationBack to top ↑
Technical & Vocational SkillsBack to top ↑
Digital & AI CompetenceBack to top ↑
Generative AI adoption
Modelled share of working-age adults using generative AI, from Microsoft telemetry scaled to each country’s 15–64 population. A measure of how fast a workforce is absorbing the technology rather than of how much of it a nation builds. The card opens the full cross-country comparison.
Lifelong Learning & ReskillingBack to top ↑
Research Talent & Knowledge CreationBack to top ↑
Population HealthBack to top ↑
4 deaths/100,000 live births (2010)
20.9% (2008)
0.3% (2009 est.)
15,000 (2009 est.)
fewer than 100 (2009 est.)
Health System CapabilityBack to top ↑
10.6% of GDP (2011)
4.86 physicians/1,000 population (2010)
7.6 beds/1,000 population (2010)
GINC Capability Domains · Chapter 08
Governance and Integrity
🇦🇹 Austria’s institutions, law and the integrity of the state
State structureBack to top ↑
federal republic
9 states (Bundeslaender, singular - Bundesland); Burgenland, Karnten (Carinthia), Niederoesterreich (Lower Austria), Oberoesterreich (Upper Austria), Salzburg, Steiermark (Styria), Tirol (Tyrol), Vorarlberg, Wien (Vienna)
several previous; latest adopted 1 October 1920, revised 1929, replaced May 1934 (authoritarian-corporate constitution), replaced by German Weimar constitution in 1938 following German annexation; latest reinstated 1 May 1945 (1920 constitution with 1929 revisions); amended many times, last in 2008 (2013)
16 years of age; universal
Political Institutions & Civic ParticipationBack to top ↑
- Electoral Management & Integrity
- Legislature & Deliberative Institutions
- Citizen Participation & Civic Space
bicameral Federal Assembly or Bundesversammlung consists of Federal Council or Bundesrat (62 seats; delegates appointed by state parliaments with each state receiving 3 to 12 seats in proportion to its population; members serve five- or six-year terms) and the National Council or Nationalrat (183 seats; members elected by popular vote for a five-year term under a system of proportional representation with partially open party lists)
Alliance for the Future of Austria or BZOe [Josef BUCHER]//Austrian People's Party or OeVP [Michael SPINDELEGGER]//Communist Party of Austria or KPOe [Mirko MESSNER]//Freedom Party of Austria or FPOe [Heinz Christian STRACHE]//The Greens [Eva GLAWISCHNIG]//NEOS - The New Austria [Matthias STROLZ]//Social Democratic Party of Austria or SPOe [Werner FAYMANN]//"Team Stronach for Austria" [Frank STRONACH]
Austrian Trade Union Federation or OeGB (nominally independent but primarily Social Democratic)//Federal Economic Chamber//Labor Chamber or AK (Social Democratic-leaning think tank)//OeVP-oriented Association of Austrian Industrialists or IV//Roman Catholic Church, including its chief lay organization, Catholic Action
Justice System & Fundamental RightsBack to top ↑
- Judicial Independence & Court Capability
- Access to Justice & Legal Services
- Fundamental Rights Protection
- Human Rights Institutions & Equality Bodies
civil law system; judicial review of legislative acts by the Constitutional Court
accepts compulsory ICJ jurisdiction; accepts ICCt jurisdiction
Internal Security & OrderBack to top ↑
transshipment point for Southwest Asian heroin and South American cocaine destined for Western Europe; increasing consumption of European-produced synthetic drugs
Regulatory Governance & Strategic ControlsBack to top ↑
- Regulatory Quality & Better Regulation
- Regulatory Delivery & Independent Regulators
- Strategic Controls & Economic Security Administration
Government Effectiveness & Public AdministrationBack to top ↑
- Centre of Government & Policy Coordination
- Civil Service & Public Workforce
- Digital Government & Service Delivery
- Legal Identity & Civil Registration
- Statistical & Data Capability
Public Integrity & Anti-CorruptionBack to top ↑
Transparency, Oversight & AccountabilityBack to top ↑
- Right to Information & Open Government
- Independent Oversight & Supreme Audit
- Independent Media & Journalist Safety
National Resilience & Crisis ManagementBack to top ↑
GINC Capability Domains · Chapter 09
Information and Influence
🇦🇹 Austria’s identity, media and the projection of influence
Identity and cultureBack to top ↑
German (official nationwide) 88.6%, Turkish 2.3%, Serbian 2.2%, Croatian (official in Burgenland) 1.6%, other (includes Slovene, official in Carinthia, and Hungarian, official in Burgenland) 5.3% (2001 census)
Roman Catholic 73.6%, Protestant 4.7%, Muslim 4.2%, other 3.5%, unspecified 2%, none 12% (2001 census)
Austrians 91.1%, former Yugoslavs 4% (includes Croatians, Slovenes, Serbs, and Bosniaks), Turks 1.6%, German 0.9%, other or unspecified 2.4% (2001 census)
golden eagle, Alpine gentian, edelweiss
three equal horizontal bands of red (top), white, and red; the flag design is certainly one of the oldest - if not the oldest - national banners in the world; according to tradition, in 1191, following a fierce battle in the Third Crusade, Duke Leopold V of Austria's white tunic became completely blood-spattered; upon removal of his wide belt or sash, a white band was revealed; the red-white-red color combination was subsequently adopted as his banner
Diplomatic Statecraft & Global NetworksBack to top ↑
- Diplomatic Network & Consular Reach
- Multilateral Leadership & Norm Setting
- Agenda-Setting & Convening
- Mediation & Crisis Diplomacy
ADB (nonregional member), AfDB (nonregional member), Australia Group, BIS, BSEC (observer), CD, CE, CEI, CERN, EAPC, EBRD, ECB, EIB, EMU, ESA, EU, FAO, FATF, G-9, IADB, IAEA, IBRD, ICAO, ICC (national committees), ICRM, IDA, IEA, IFAD, IFC, IFRCS, IGAD (partners), ILO, IMF, IMO, Interpol, IOC, IOM, IPU, ISO, ITSO, ITU, ITUC (NGOs), MIGA, MINURSO, NEA, NSG, OAS (observer), OECD, OIF (observer), OPCW, OSCE, Paris Club, PCA, PFP, Schengen Convention, SELEC (observer), UN, UNCTAD, UNDOF, UNESCO, UNFICYP, UNHCR, UNIFIL, UNTSO, UNWTO, UPU, WCO, WFTU (NGOs), WHO, WIPO, WMO, WTO, ZC
Alliances & Security CooperationBack to top ↑
Development Cooperation & Global AssistanceBack to top ↑
Culture, Language & Education DiplomacyBack to top ↑
- Cultural & Language Institutes
- Creative Industries & Cultural Export Reach
- Heritage & Cultural Institutions
- Education Diplomacy & Alumni Networks
- Sports & Major Events
Diaspora & Global CommunitiesBack to top ↑
Information Environment & Strategic CommunicationBack to top ↑
- Strategic Communications & Public Diplomacy
- International Media & Broadcasting
- Information Defence & Counter-Interference
Austria's public broadcaster, Osterreichischer Rundfunk (ORF), was the main broadcast source until commercial radio and TV service was introduced in the 1990s; cable and satellite TV are available, including German TV stations (2008)
GINC Capability Domains · Chapter 10
Financial Strength
🇦🇹 Austria’s fiscal depth, reserves and the capacity to act
Monetary & Currency CapabilityBack to top ↑
- Monetary Policy & Price Stability
- Exchange Rate & External Account Management
- Currency Issuance & Digital Money
2.1% (2013 est.)//2.6% (2012 est.)
euros (EUR) per US dollar -//0.7634 (2013 est.)//0.7752 (2012 est.)//0.755 (2010 est.)//0.7198 (2009 est.)//0.6827 (2008 est.)
2.2% (31 December 2013 est.)//2.5% (31 December 2012 est.)
$204.5 billion (31 December 2013 est.)//$201.1 billion (31 December 2012 est.)
$419 billion (31 December 2013 est.)//$414 billion (31 December 2012 est.)
Fiscal Capacity & Public FinanceBack to top ↑
- Revenue Mobilisation & Tax Administration
- Public Expenditure & Budget Management
- Sovereign Debt & Treasury Management
- Public Investment Management
47.9% of GDP (2013 est.)
-2.9% of GDP (2013 est.)
75.7% of GDP (2013 est.)//74.1% of GDP (2012 est.)
calendar year
Financial System Depth & AccessBack to top ↑
- Banking System Capacity
- Capital Markets Depth & Development
- Long-Term & Institutional Capital
- Financial Inclusion & Household Access
- Development & Policy Finance
$544.2 billion (31 December 2013 est.)//$543 billion (31 December 2012 est.)
$106 billion (31 December 2012 est.)//$82.37 billion (31 December 2011)//$NA (31 December 2010 est.)
23.9% of GDP (2013 est.)//24.4% of GDP (2012 est.)//24.5% of GDP (2011 est.)
Financial Regulation & IntegrityBack to top ↑
- Prudential Regulation & Supervision
- Financial Integrity & Illicit Finance Control
- Market Conduct & Consumer Protection
- Payment & Market Infrastructure Oversight
Financial Stability & Crisis ManagementBack to top ↑
- Macroprudential & Systemic Oversight
- Crisis Management, Resolution & Deposit Insurance
- External Liquidity & Financial Safety Nets
Sovereign Capital & External Financial PowerBack to top ↑
- Official Reserves Management
- Sovereign Wealth & Public Asset Management
- Currency Internationalisation & Reserve Status
- Capital Account & Flow Management
- International Financial Centre Capability
$27.21 billion (31 December 2012 est.)//$25.16 billion (31 December 2011 est.)
$812 billion (31 December 2012 est.)//$786.1 billion (31 December 2011)
GINC Capability Domains · Chapter 11
Production and Innovation
🇦🇹 Austria’s output, industry and the engine of prosperity
Economic Output & ProductivityBack to top ↑
Austria, with its well-developed market economy, skilled labor force, and high standard of living, is closely tied to other EU economies, especially Germany's. Its economy features a large service sector, a sound industrial sector, and a small, but highly developed agricultural sector. Following several years of solid foreign demand for Austrian exports and record employment growth, the international financial crisis of 2008 and subsequent global economic downturn led to a sharp but brief recession. Austrian GDP contracted 3.8% in 2009 but saw positive growth of about 2% in 2010 and 2.7% in 2011. Growth fell to 0.6% in 2012. Unemployment did not rise as steeply in Austria as elsewhere in Europe, partly because the government subsidized reduced working hour schemes to allow companies to retain employees. The 2012 unemployment rate of 4.3% was the lowest within the EU. Stabilization measures, stimulus spending, and an income tax reform pushed the budget deficit to 4.5% in 2010 and 2.6% in 2011, from only about 0.9% in 2008. The international financial crisis of 2008 caused difficulties for Austria's largest banks whose extensive operations in central, eastern, and southeastern Europe faced large losses. The government provided bank support - including in some instances, nationalization - to support aggregate demand and stabilize the banking system. Austria's fiscal position compares favorably with other euro-zone countries, but it faces external risks, such as Austrian banks' continued exposure to Central and Eastern Europe as well as political and economic uncertainties caused by the European sovereign debt crisis. In 2011 the government attempted to pass a constitutional amendment limiting public debt to 60% of GDP by 2020, but it was unable to obtain sufficient support in parliament and instead passed the measure as a simple law. In March 2012, the Austrian parliament approved an austerity package consisting of a mix of expenditure cuts and new revenues that will bring public finances into balance by 2016. In 2012, the budget deficit rose to 3.1% of GDP.
$361 billion (2013 est.)//$359.6 billion (2012 est.)//$356.5 billion (2011 est.)
0.4% (2013 est.)//0.9% (2012 est.)//2.8% (2011 est.)
$42,600 (2013 est.)//$42,500 (2012 est.)//$42,300 (2011 est.)
$417.9 billion (2013 est.)
Labour & EmploymentBack to top ↑
- Employment & Labour Force Participation
- Labour Market Institutions & Wage Setting
- Employment Services & Skills Matching
- Labour Adjustment, Transition & Formalisation
3.737 million (2013 est.)
4.9% (2013 est.)//4.4% (2012 est.)
Industrial & Sectoral BaseBack to top ↑
- Manufacturing & Advanced Industry
- Foundational & Process Industries
- Agrifood & Primary Production
- Services Economy
grains, potatoes, wine, fruit; dairy products, cattle, pigs, poultry; lumber
construction, machinery, vehicles and parts, food, metals, chemicals, lumber and wood, paper and paperboard, communications equipment, tourism
0.5% (2013 est.)
Structural Transformation & ComplexityBack to top ↑
Business Dynamism & EntrepreneurshipBack to top ↑
- Entrepreneurship & Firm Creation
- Risk Capital & Scale-Up Finance
- Firm Growth, Exit & Renewal
- Competition & Market Contestability
Innovation & CommercialisationBack to top ↑
- Business Innovation Capability
- Research Commercialisation & Knowledge Transfer
- Intellectual Property & Intangible Assets
- Innovation Ecosystems & Clusters
Technology Adoption & DiffusionBack to top ↑
GINC Capability Domains · Chapter 12
Trade and Investment
🇦🇹 Austria’s markets, capital and the terms of global exchange
Overall tradeBack to top ↑
$194B of exports to 216 partners and $201B of imports from 224 in 2024, a deficit of $7.02B.
- Exports
- $194B216 partners
- Imports
- $201B224 partners
- Balance
- −$7.02Bdeficit
- Total trade
- $395B2024
ExportsBack to top ↑
Where its exports go
The largest partners in 2024, with each one's share of the nation's exports.
| Partner | Value | Share | |
|---|---|---|---|
| Germany | $50.9B | 26% | |
| United States | $17.3B | 8.9% | |
| Italy | $12.6B | 6.5% | |
| Switzerland | $10.6B | 5.5% | |
| Hungary | $8.43B | 4.4% | |
| France | $6.86B | 3.5% | |
| China | $6.60B | 3.4% | |
| Czech Republic | $5.99B | 3.1% | |
| Poland | $5.85B | 3.0% | |
| United Kingdom | $5.46B | 2.8% | |
| Romania | $4.18B | 2.2% | |
| Netherlands | $3.77B | 1.9% | |
| Slovenia | $3.69B | 1.9% | |
| Slovakia | $3.40B | 1.8% | |
| Spain | $3.19B | 1.6% | |
| Belgium | $2.90B | 1.5% | |
| Croatia | $2.40B | 1.2% | |
| Turkey | $2.11B | 1.1% | |
| Mexico | $1.99B | 1.0% | |
| Sweden | $1.97B | 1.0% |
What it exports
The largest categories in 2024.
| Category | Value | Share | |
|---|---|---|---|
| Machinery, nuclear reactors, boilers | $32.9B | 17% | |
| Vehicles other than railway, tramway | $19.0B | 9.8% | |
| Electrical, electronic equipment | $18.5B | 9.5% | |
| Pharmaceutical products | $18.5B | 9.5% | |
| Plastics | $9.20B | 4.7% | |
| Iron and steel | $8.31B | 4.3% | |
| Mineral fuels, oils, distillation products | $6.51B | 3.4% | |
| Articles of iron or steel | $5.98B | 3.1% | |
| Paper and paperboard, articles of pulp, paper and board | $5.88B | 3.0% | |
| Optical, photo, technical, medical apparatus | $5.50B | 2.8% | |
| Wood and articles of wood, wood charcoal | $5.13B | 2.6% | |
| Aluminum | $4.29B | 2.2% | |
| Beverages, spirits and vinegar | $3.59B | 1.9% | |
| Pearls, precious stones, metals, coins | $3.16B | 1.6% | |
| Miscellaneous articles of base metal | $2.68B | 1.4% |
ImportsBack to top ↑
Where its imports come from
The largest partners in 2024, with each one's share of the nation's imports.
| Partner | Value | Share | |
|---|---|---|---|
| Germany | $66.7B | 33% | |
| China | $16.3B | 8.1% | |
| Italy | $13.2B | 6.6% | |
| Czech Republic | $9.02B | 4.5% | |
| Switzerland | $8.09B | 4.0% | |
| United States | $7.74B | 3.9% | |
| Poland | $6.66B | 3.3% | |
| Netherlands | $6.14B | 3.1% | |
| France | $5.60B | 2.8% | |
| Hungary | $5.24B | 2.6% | |
| Slovakia | $4.48B | 2.2% | |
| Spain | $3.36B | 1.7% | |
| Belgium | $3.16B | 1.6% | |
| Slovenia | $2.95B | 1.5% | |
| Turkey | $2.80B | 1.4% | |
| Kazakhstan | $2.75B | 1.4% | |
| Romania | $2.54B | 1.3% | |
| Japan | $2.53B | 1.3% | |
| United Kingdom | $2.39B | 1.2% | |
| Sweden | $2.17B | 1.1% |
What it imports
The largest categories in 2024.
| Category | Value | Share | |
|---|---|---|---|
| Machinery, nuclear reactors, boilers | $26.1B | 13% | |
| Vehicles other than railway, tramway | $21.7B | 11% | |
| Electrical, electronic equipment | $21.6B | 11% | |
| Mineral fuels, oils, distillation products | $12.1B | 6.0% | |
| Pharmaceutical products | $11.6B | 5.8% | |
| Plastics | $8.64B | 4.3% | |
| Optical, photo, technical, medical apparatus | $6.00B | 3.0% | |
| Articles of iron or steel | $5.83B | 2.9% | |
| Aluminum | $4.64B | 2.3% | |
| Iron and steel | $4.47B | 2.2% | |
| Articles of apparel, not knit or crocheted | $4.03B | 2.0% | |
| Furniture, lighting signs, prefabricated buildings | $3.96B | 2.0% | |
| Articles of apparel, knit or crocheted | $3.89B | 1.9% | |
| Organic chemicals | $3.67B | 1.8% | |
| Pearls, precious stones, metals, coins | $2.90B | 1.4% |
In a list, the bar runs to the largest in that list. The line is each figure’s history from 2000, drawn to its own peak: it shows the shape of the years, and the value shows the size.
External balanceBack to top ↑
$10.6 billion (2013 est.)//$7.085 billion (2012 est.)
Trade Facilitation & LogisticsBack to top ↑
Trade Policy & Market AccessBack to top ↑
- Trade Policy & Negotiation Capability
- Market Access & Agreements Network
- Trade Law & Enforcement
- Standards, Conformity & Quality Infrastructure
Digital & Services TradeBack to top ↑
- Services Trade Capability
- Digital Trade & E-Commerce
- Data Flows & Digital Trade Governance
- Tourism & Visitor Economy
Investment Attraction & ProjectionBack to top ↑
- Investment Attraction & Facilitation
- Investment Absorption & Linkages
- Outward Investment & Global Corporate Presence
$269.5 billion (31 December 2013 est.)//$265.3 billion (31 December 2012 est.)
$345.2 billion (31 December 2013 est.)//$331.4 billion (31 December 2012 est.)
Export Capability & SophisticationBack to top ↑
$165.6 billion (2013 est.)//$160.1 billion (2012 est.)
Germany 29.31%, Italy 6.25%, Switzerland 5.08%, United States 5%, France 4.27% (2013 est.)
machinery and equipment, motor vehicles and parts, paper and paperboard, metal goods, chemicals, iron and steel, textiles, foodstuffs
Global Value Chain PositionBack to top ↑
- Value Chain Participation & Integration
- Value Chain Position & Upgrading
- Regional Integration & Hub Anchoring
Economic Leverage & DependenceBack to top ↑
- Strategic Supply Security
- Concentration Risk & Revenue Stabilisation
- Economic Leverage & Coercion Resistance
$167.9 billion (2013 est.)//$163.2 billion (2012 est.)
Germany 40.39%, Italy 6.13%, Switzerland 5.36% (2013 est.)
machinery and equipment, motor vehicles, chemicals, metal goods, oil and oil products; foodstuffs
Austria · you are in
Historical Context
Foundations
GINC Capability Domains
Find in this brief · Austria