
Croatia
Croatia is a parliamentary democracy in Europe, home to 4.5 million people, with its capital at Zagreb.
Contents
12 chapters
Foundations
01–03
At a glance
- Area
- 56.6Kkm²#127 World#24 Europe
- Population
- 4.5M#125 World#25 Europe
- GDP (market)
- $59.1B
- GDP (PPP)
- $78.9B#83 World#25 Europe
- GDP per capita
- $17.8K#79 World#36 Europe
The whole brief
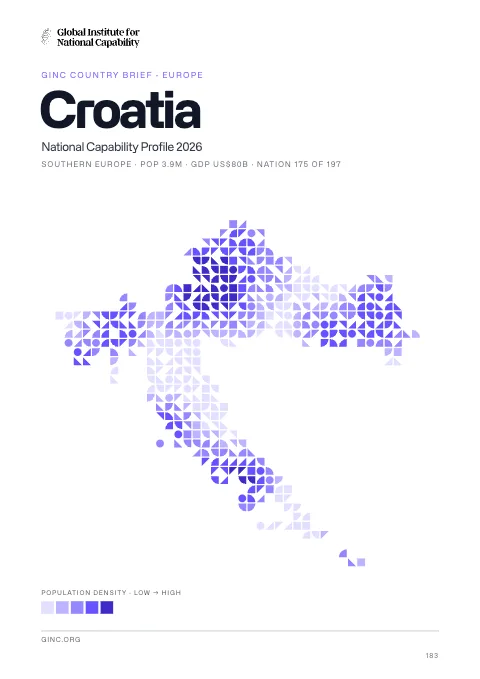
Croatia National Capability Profile 2026
Foundations · Chapter 01
Historical Context
🇭🇷 Croatia’s understanding the origins and evolution of the modern nation
BackgroundBack to top ↑
The lands that today comprise Croatia were part of the Austro-Hungarian Empire until the close of World War I. In 1918, the Croats, Serbs, and Slovenes formed a kingdom known after 1929 as Yugoslavia. Following World War II, Yugoslavia became a federal independent communist state under the strong hand of Marshal TITO. Although Croatia declared its independence from Yugoslavia in 1991, it took four years of sporadic, but often bitter, fighting before occupying Serb armies were mostly cleared from Croatian lands, along with a majority of Croatia's ethnic Serb population. Under UN supervision, the last Serb-held enclave in eastern Slavonia was returned to Croatia in 1998. The country joined NATO in April 2009 and the EU in July 2013.
IndependenceBack to top ↑
25 June 1991 (from Yugoslavia)
National holidayBack to top ↑
Independence Day, 8 October (1991) and Statehood Day, 25 June (1991); note - 25 June 1991 was the day the Croatian parliament voted for independence; following a three-month moratorium to allow the European Community to solve the Yugoslav crisis peacefully, parliament adopted a decision on 8 October 1991 to sever constitutional relations with Yugoslavia
Foundations · Chapter 02
Geography
🇭🇷 Croatia’s territory, resources and strategic position
Location and areaBack to top ↑
Southeastern Europe, bordering the Adriatic Sea, between Bosnia and Herzegovina and Slovenia
45 10 N, 15 30 E
Europe
slightly smaller than West Virginia
5,835 km (mainland 1,777 km, islands 4,058 km)
Terrain and resourcesBack to top ↑
geographically diverse; flat plains along Hungarian border, low mountains and highlands near Adriatic coastline and islands
oil, some coal, bauxite, low-grade iron ore, calcium, gypsum, natural asphalt, silica, mica, clays, salt, hydropower
36.27 sq km (2010)
Settlement and hazardsBack to top ↑
destructive earthquakes
controls most land routes from Western Europe to Aegean Sea and Turkish Straits; most Adriatic Sea islands lie off the coast of Croatia - some 1,200 islands, islets, ridges, and rocks
OtherBack to top ↑
105.5 cu km (2011)
air pollution (from metallurgical plants) and resulting acid rain is damaging the forests; coastal pollution from industrial and domestic waste; landmine removal and reconstruction of infrastructure consequent to 1992-95 civil strife
Foundations · Chapter 03
Environment
🇭🇷 Croatia’s environmental conditions, resources and national resilience
ClimateBack to top ↑
Mediterranean and continental; continental climate predominant with hot summers and cold winters; mild winters, dry summers along coast
Emissions and pollutionBack to top ↑
Water, waste and foodBack to top ↑
Resources and agreementsBack to top ↑
GINC Capability Domains · Chapter 04
Critical Technology
🇭🇷 Croatia’s technology frontiers and the pursuit of national advantage
Two counts are set side by side for 2015–2024: on the left, the papers researchers in Croatia published; on the right, the patent families that began there and were filed in more than one country. First by capability group, then group by group with each group’s capabilities. The badge on a card is the nation’s place among all nations. Papers are from GINC Research Analytics, patent families from GINC Patents.
Research by capability group
#66 WorldPapers published, 2015–2024
526
353
352
301
177
145
133
80
57
2
Patents by capability group
#59 WorldInternational patent families, 2015–2024
Advanced Materials & ManufacturingBack to top ↑
Research
#66 WorldPapers published, 2015–2024
Patents
#53 WorldInternational patent families, 2015–2024
Energy TechnologiesBack to top ↑
Research
#69 WorldPapers published, 2015–2024
Patents
#44 WorldInternational patent families, 2015–2024
Semiconductors & Advanced ComputingBack to top ↑
Research
#58 WorldPapers published, 2015–2024
No research topic: Semiconductor Design & EDA · Advanced Semiconductor Fabrication · Semiconductor Equipment & Materials · Advanced Packaging & Heterogeneous Integration
Patents
#69 WorldInternational patent families, 2015–2024
Artificial IntelligenceBack to top ↑
Research
#74 WorldPapers published, 2015–2024
Patents
#60 WorldInternational patent families, 2015–2024
Quantum TechnologiesBack to top ↑
Research
#66 WorldPapers published, 2015–2024
Patents
International patent families, 2015–2024
No international patent families on record for 2015–2024.
Connectivity, Cyber & Trust TechnologiesBack to top ↑
Research
#74 WorldPapers published, 2015–2024
Patents
#74 WorldInternational patent families, 2015–2024
Sensing, Timing & NavigationBack to top ↑
Research
#58 WorldPapers published, 2015–2024
Patents
#54 WorldInternational patent families, 2015–2024
Robotics & Autonomous SystemsBack to top ↑
Research
#57 WorldPapers published, 2015–2024
No research topic: Human-Machine Interfaces
Patents
#53 WorldInternational patent families, 2015–2024
Biotechnology & Health TechnologiesBack to top ↑
Research
#63 WorldPapers published, 2015–2024
Patents
#66 WorldInternational patent families, 2015–2024
Medicine and BioTech
Clinical research and life-science invention, drawn from the same series that drive the metric pages. Each card opens the full cross-country comparison.
Space TechnologiesBack to top ↑
Research
#79 WorldPapers published, 2015–2024
Patents
International patent families, 2015–2024
No international patent families on record for 2015–2024.
GINC Capability Domains · Chapter 05
Strategic Infrastructure
🇭🇷 Croatia’s energy, connectivity and the material foundations of capability
Resource InfrastructureBack to top ↑
11,930 bbl/day (2013 est.)
0 bbl/day (2013 est.)
51,470 bbl/day (2013 est.)
71 million bbl (1 January 2013 est.)
65,410 bbl/day (2013 est.)
74,410 bbl/day (2012 est.)
30,120 bbl/day (2013 est.)
26,670 bbl/day (2013 est.)
1.863 billion cu m (2013 est.)
2.755 billion cu m (2012 est.)
392 million cu m (2013 est.)
1.137 billion cu m (2013 est.)
24.92 billion cu m (1 January 2013 est.)
gas 2,410 km; oil 610 km (2011)
Agriculture & Food InfrastructureBack to top ↑
- Irrigation & Agricultural Water
- Livestock & Veterinary
- Fisheries & Aquaculture
- Storage, Cold Chain & Markets
Energy InfrastructureBack to top ↑
- Thermal Generation
- Nuclear Generation
- Nuclear Fuel Cycle & Radioactive Waste
- Hydropower
- Renewable Generation
- Transmission & Distribution
- System Control & Dispatch
- Storage & Fuel Supply
4.132 million kW (2010 est.)
14.24 billion kWh (2013 est.)
16.7 billion kWh (2012 est.)
3.294 billion kWh (2013 est.)
6.844 billion kWh (2013 est.)
45.9% of total installed capacity (2010 est.)
0% of total installed capacity (2010 est.)
44.7% of total installed capacity (2010 est.)
2.3% of total installed capacity (2010 est.)
22.35 million Mt (2011 est.)
Water, Sanitation & Waste InfrastructureBack to top ↑
- Dams, Reservoirs & Flood Defence
- Water Supply & Treatment
- Bulk Water Transfer & Desalination
- Wastewater & Sanitation
- Solid Waste & Recycling
Advanced ManufacturingBack to top ↑
- Materials & Inputs
- Chemicals & Hazardous Process Industry
- Production Systems
- Supply Chain & Ecosystem
- Workforce & Innovation
Transport InfrastructureBack to top ↑
- Seaports & Terminals
- Air Infrastructure
- Air Navigation & Traffic Management
- Inland Waterways & Ferries
- Rail Infrastructure
- Roads & Bridges
- Logistics, Multimodal & Border Infrastructure
- Postal & Parcel
69 (2013)
1 (2013)
785 km (2009)
Communications & Digital InfrastructureBack to top ↑
- Subsea Cables & International Gateways
- Core & Backbone Networks
- Mobile & Wireless Networks
- Spectrum & Broadcasting
- Data Centres, Compute & Cloud
- Data Resources
- AI Tools & Applications
1.64 million (2012)
4.97 million (2012)
2.234 million (2009)
729,420 (2012)
.hr
Financial InfrastructureBack to top ↑
- Currency & Reserves
- Payments & Settlement Systems
- Markets, Exchanges & Depositories
- Banks, Insurers & Systemic Institutions
Social InfrastructureBack to top ↑
- Health Infrastructure
- Public Health & Laboratories
- Medical Supply & Stockpiles
- Education & Skills Infrastructure
- Research & Scientific Facilities
- Housing, Community & Social Services
- Government & Public Administration
- Cultural, Community & Recreational Infrastructure
- Justice & Corrections
- Emergency Services & Civil Protection
- Hydrometeorology & Early Warning
Space, Aerospace & Defence InfrastructureBack to top ↑
GINC Capability Domains · Chapter 06
National Security
🇭🇷 Croatia’s force, intelligence and the defence of the nation
Disputes and terrorismBack to top ↑
dispute remains with Bosnia and Herzegovina over several small sections of the boundary related to maritime access that hinders ratification of the 1999 border agreement; since the breakup of Yugoslavia in the early 1990s, Croatia and Slovenia have each claimed sovereignty over Pirin Bay and four villages, and Slovenia has objected to Croatia's claim of an exclusive economic zone in the Adriatic Sea; in 2009, however Croatia and Slovenia signed a binding international arbitration agreement to define their disputed land and maritime borders, which led to Slovenia lifting its objections to Croatia joining the EU; Slovenia continues to impose a hard border Schengen regime with Croatia, which joined the EU in 2013 but has not yet fulfilled Schengen requirements
Force Generation & MobilisationBack to top ↑
Armed Forces of the Republic of Croatia (Oruzane Snage Republike Hrvatske, OSRH) consists of five major commands directly subordinate to a General Staff: Ground Forces (Hrvatska Kopnena Vojska, HKoV), Naval Forces (Hrvatska Ratna Mornarica, HRM; includes coast guard), Air Force and Air Defense Command (Hrvatsko Ratno Zrakoplovstvo I Protuzracna Obrana), Joint Education and Training Command, Logistics Command; Military Police Force supports each of the three Croatian military forces (2012)
18-27 years of age for voluntary military service; 6-month service obligation (2012)
1.7% of GDP (2012)//1.77% of GDP (2011)//1.7% of GDP (2010)
Forces under arms
Active-duty strength on the Correlates of War series, which reaches back to 1816 and so carries a nation’s whole record of mobilisation rather than its present establishment. The card opens the full cross-country comparison.
Intelligence & AssessmentBack to top ↑
- Imagery & Geospatial Intelligence
- Signals & Cyber Intelligence
- Technical & Measurement Intelligence
- Open-Source & Financial Intelligence
- Human Intelligence & Counterintelligence
- All-Source Analysis & Warning
Joint Command, Projection & SustainmentBack to top ↑
- Command, Control & Communications
- Strategic Lift & Mobility
- Expeditionary & Peace Operations
- Operational Sustainment & War Reserves
- Defence Industrial Mobilisation
- CBRN Defence
Land PowerBack to top ↑
- Combined Arms Manoeuvre
- Land Fires
- Battlefield Aviation & Uncrewed Systems
- Special Operations & Irregular Warfare
Maritime PowerBack to top ↑
- Maritime Security & Constabulary
- Sea Denial & Undersea Warfare
- Sea Control
- Amphibious & Expeditionary Operations
Air PowerBack to top ↑
- Air Sovereignty & Policing
- Control of the Air
- Air Strike & Interdiction
- Airborne ISR, Early Warning & Battle Management
Strategic Strike & Missile DefenceBack to top ↑
Space OperationsBack to top ↑
Cyber & Electromagnetic OperationsBack to top ↑
Nuclear DeterrenceBack to top ↑
GINC Capability Domains · Chapter 07
Human Capital
🇭🇷 Croatia’s population, health and the skills that sustain capability
DemographyBack to top ↑
4,470,534 (July 2014 est.)
-0.12% (2014 est.)
9.49 births/1,000 population (2014 est.)
12.13 deaths/1,000 population (2014 est.)
1.45 children born/woman (2014 est.)
27.9 (2011 est.)
Migration and urbanisationBack to top ↑
1.43 migrant(s)/1,000 population (2014 est.)
ZAGREB (capital) 686,000 (2011)
Welfare and equityBack to top ↑
21.1% (2011)
32 (2010)//29 (1998)
DisplacementBack to top ↑
Early Childhood DevelopmentBack to top ↑
Foundational EducationBack to top ↑
4.3% of GDP (2010)
Advanced EducationBack to top ↑
Technical & Vocational SkillsBack to top ↑
Digital & AI CompetenceBack to top ↑
Generative AI adoption
Modelled share of working-age adults using generative AI, from Microsoft telemetry scaled to each country’s 15–64 population. A measure of how fast a workforce is absorbing the technology rather than of how much of it a nation builds. The card opens the full cross-country comparison.
Lifelong Learning & ReskillingBack to top ↑
Research Talent & Knowledge CreationBack to top ↑
Population HealthBack to top ↑
17 deaths/100,000 live births (2010)
24.2% (2008)
less than 0.1% (2009 est.)
fewer than 1,000 (2009 est.)
fewer than 100 (2009 est.)
Health System CapabilityBack to top ↑
7.8% of GDP (2010)
2.72 physicians/1,000 population (2010)
6 beds/1,000 population (2011)
GINC Capability Domains · Chapter 08
Governance and Integrity
🇭🇷 Croatia’s institutions, law and the integrity of the state
State structureBack to top ↑
parliamentary democracy
20 counties (zupanije, zupanija - singular) and 1 city* (grad - singular) with special county status; Bjelovarsko-Bilogorska, Brodsko-Posavska, Dubrovacko-Neretvanska (Dubrovnik-Neretva), Istarska (Istria), Karlovacka, Koprivnicko-Krizevacka, Krapinsko-Zagorska, Licko-Senjska (Lika-Senj), Medimurska, Osjecko-Baranjska, Pozesko-Slavonska (Pozega-Slavonia), Primorsko-Goranska, Sibensko-Kninska, Sisacko-Moslavacka, Splitsko-Dalmatinska (Split-Dalmatia), Varazdinska, Viroviticko-Podravska, Vukovarsko-Srijemska (Vukovar-Syrmia), Zadarska, Zagreb*, Zagrebacka (Zagreb county)
several previous; latest adopted 22 December 1990; amended several times, last in December 2013 by referendum
18 years of age, 16 if employed; universal
Political Institutions & Civic ParticipationBack to top ↑
- Electoral Management & Integrity
- Legislature & Deliberative Institutions
- Citizen Participation & Civic Space
unicameral Assembly or Sabor (151 seats; members elected from party lists by popular vote to serve four-year terms; each of 10 electoral districts elect 14 members, Croatian citizens abroad vote as an electoral district and elect 3 members, national minorities vote as an electoral district and elect 8 members)
Bosniak Democratic Party of Croatia or BDSH [Medzad HODZIC]//Croatian Civic Party or HGS [Zeljko KERUM]//Croatian Democratic Congress of Slavonia and Baranja or HDSSB [Vladimir SISLJAGIC]//Croatian Democratic Union or HDZ [Tomislav KARAMARKO]//Croatian Laborists - Labor Party [Dragutin LESAR]//Croatian Party of Rights - dr. Ante Starcevic or HSP AS [Ruza TOMASIC]//Croatian Peasant Party or HSS [Branko HRG]//Croatian Pensioner Party or HSU [Silvano HRELJA]//Croatian People's Party - Liberal Democrats or HNS [Vesna PUSIC]//Croatian Pure Party of Rights or HCSP [Josip MILJIC]//Democratic Centre or DC [Vesna SKARE-OZBOLT]//HDZ-led Coalition [Tomislav KARAMARKO] (includes HDZ, HGS, and DC)//Independent Democratic Serb Party or SDSS [Vojislav STANIMIROVIC]//Independent List of Ivan Grubisic [Ivan GRUBISIC]//Istrian Democratic Assembly or IDS [Ivan JAKOVCIC]//Kukuriku Coalition [Zoran MILANOVIC] (includes SDP, HNS, IDS, and HSU)//Social Democratic Party of Croatia or SDP [Zoran MILANOVIC]//Sustainable Development for Croatia or ORaH [Mirela HOLY]
Justice System & Fundamental RightsBack to top ↑
- Judicial Independence & Court Capability
- Access to Justice & Legal Services
- Fundamental Rights Protection
- Human Rights Institutions & Equality Bodies
civil law system influenced by legal heritage of Austria-Hungary; note - Croatian law was fully harmonized with the European Community acquis as of the June 2010 completion of EU accession negotiations
has not submitted an ICJ jurisdiction declaration; accepts ICCt jurisdiction
Internal Security & OrderBack to top ↑
transit point along the Balkan route for Southwest Asian heroin to Western Europe; has been used as a transit point for maritime shipments of South American cocaine bound for Western Europe (2008)
Regulatory Governance & Strategic ControlsBack to top ↑
- Regulatory Quality & Better Regulation
- Regulatory Delivery & Independent Regulators
- Strategic Controls & Economic Security Administration
Government Effectiveness & Public AdministrationBack to top ↑
- Centre of Government & Policy Coordination
- Civil Service & Public Workforce
- Digital Government & Service Delivery
- Legal Identity & Civil Registration
- Statistical & Data Capability
Public Integrity & Anti-CorruptionBack to top ↑
Transparency, Oversight & AccountabilityBack to top ↑
- Right to Information & Open Government
- Independent Oversight & Supreme Audit
- Independent Media & Journalist Safety
National Resilience & Crisis ManagementBack to top ↑
GINC Capability Domains · Chapter 09
Information and Influence
🇭🇷 Croatia’s identity, media and the projection of influence
Identity and cultureBack to top ↑
Croatian (official) 95.6%, Serbian 1.2%, other 3% (including Hungarian, Czech, Slovak, and Albanian), unspecified 0.2% (2011 est.)
Roman Catholic 86.3%, Orthodox 4.4%, Muslim 1.5%, other 1.5%, unspecified 2.5%, not religious or atheist 3.8% (2011 est.)
Croat 90.4%, Serb 4.4%, other 4.4% (including Bosniak, Hungarian, Slovene, Czech, and Roma), unspecified 0.8% (2011 est.)
red-white checkerboard
three equal horizontal bands of red (top), white, and blue - the Pan-Slav colors - superimposed by the Croatian coat of arms; the coat of arms consists of one main shield (a checkerboard of 13 red and 12 silver (white) fields) surmounted by five smaller shields that form a crown over the main shield; the five small shields represent five historic regions, they are (from left to right): Croatia, Dubrovnik, Dalmatia, Istria, and Slavonia
Diplomatic Statecraft & Global NetworksBack to top ↑
- Diplomatic Network & Consular Reach
- Multilateral Leadership & Norm Setting
- Agenda-Setting & Convening
- Mediation & Crisis Diplomacy
Australia Group, BIS, BSEC (observer), CD, CE, CEI, EAPC, EBRD, EU, FAO, G-11, IADB, IAEA, IBRD, ICAO, ICC (national committees), ICRM, IDA, IFAD, IFC, IFRCS, IHO, ILO, IMF, IMO, IMSO, Interpol, IOC, IOM, IPU, ISO, ITSO, ITU, ITUC (NGOs), MIGA, MINURSO, MINUSTAH, NAM (observer), NATO, NSG, OAS (observer), OIF (observer), OPCW, OSCE, PCA, SELEC, UN, UNCTAD, UNDOF, UNESCO, UNFICYP, UNHCR, UNIDO, UNIFIL, UNMIL, UNMOGIP, UNWTO, UPU, WCO, WHO, WIPO, WMO, WTO, ZC
Alliances & Security CooperationBack to top ↑
Development Cooperation & Global AssistanceBack to top ↑
Culture, Language & Education DiplomacyBack to top ↑
- Cultural & Language Institutes
- Creative Industries & Cultural Export Reach
- Heritage & Cultural Institutions
- Education Diplomacy & Alumni Networks
- Sports & Major Events
Diaspora & Global CommunitiesBack to top ↑
Information Environment & Strategic CommunicationBack to top ↑
- Strategic Communications & Public Diplomacy
- International Media & Broadcasting
- Information Defence & Counter-Interference
the national state-owned public broadcaster, Croatian Radiotelevision (HRT), operates 4 terrestrial TV networks, a satellite channel that rebroadcasts programs for Croatians living abroad, and 6 regional TV centers; 2 private broadcasters operate national terrestrial networks; roughly 25 privately owned regional TV stations; multi-channel cable and satellite TV subscription services are available; state-owned public broadcaster operates 3 national radio networks and 9 regional radio stations; 2 privately owned national radio networks and more than 170 regional, county, city, and community radio stations (2012)
GINC Capability Domains · Chapter 10
Financial Strength
🇭🇷 Croatia’s fiscal depth, reserves and the capacity to act
Monetary & Currency CapabilityBack to top ↑
- Monetary Policy & Price Stability
- Exchange Rate & External Account Management
- Currency Issuance & Digital Money
2.2% (2013 est.)//3.4% (2012 est.)
kuna (HRK) per US dollar -//5.775 (2013 est.)//5.8503 (2012 est.)//5.498 (2010 est.)//5.2692 (2009)//4.98 (2008)
7% (31 December 2013 est.)//7% (31 December 2012 est.)
9% (31 December 2013 est.)//9.48% (31 December 2012 est.)
$10.38 billion (31 January 2014 est.)//$10.64 billion (31 December 2012 est.)
$49.3 billion (31 December 2013 est.)//$493.7 billion (31 December 2012 est.)
Fiscal Capacity & Public FinanceBack to top ↑
- Revenue Mobilisation & Tax Administration
- Public Expenditure & Budget Management
- Sovereign Debt & Treasury Management
- Public Investment Management
36.9% of GDP (2013 est.)
-4.4% of GDP (2013 est.)
66.2% of GDP (2013 est.)//55.6% of GDP (2012 est.)
calendar year
Financial System Depth & AccessBack to top ↑
- Banking System Capacity
- Capital Markets Depth & Development
- Long-Term & Institutional Capital
- Financial Inclusion & Household Access
- Development & Policy Finance
$46.65 billion (31 December 2013 est.)//$46.23 billion (31 December 2012 est.)
$21.63 billion (31 December 2013 est.)//$23.24 billion (31 December 2012)//$23.75 billion (31 December 2011 est.)
19.9% of GDP (2013 est.)//19.3% of GDP (2012 est.)//19.5% of GDP (2011 est.)
Financial Regulation & IntegrityBack to top ↑
- Prudential Regulation & Supervision
- Financial Integrity & Illicit Finance Control
- Market Conduct & Consumer Protection
- Payment & Market Infrastructure Oversight
Financial Stability & Crisis ManagementBack to top ↑
- Macroprudential & Systemic Oversight
- Crisis Management, Resolution & Deposit Insurance
- External Liquidity & Financial Safety Nets
Sovereign Capital & External Financial PowerBack to top ↑
- Official Reserves Management
- Sovereign Wealth & Public Asset Management
- Currency Internationalisation & Reserve Status
- Capital Account & Flow Management
- International Financial Centre Capability
$11.46 billion (31 December 2013 est.)//$11.95 billion (31 December 2012 est.)
$60.47 billion (31 December 2013 est.)//$61.39 billion (2012 est.)
GINC Capability Domains · Chapter 11
Production and Innovation
🇭🇷 Croatia’s output, industry and the engine of prosperity
Economic Output & ProductivityBack to top ↑
Though still one of the wealthiest of the former Yugoslav republics, Croatia's economy suffered badly during the 1991-95 war. The country's output during that time collapsed and Croatia missed the early waves of investment in Central and Eastern Europe that followed the fall of the Berlin Wall. Between 2000 and 2007, however, Croatia's economic fortunes began to improve with moderate but steady GDP growth between 4% and 6% led by a rebound in tourism and credit-driven consumer spending. Inflation over the same period remained tame and the currency, the kuna, stable. Croatia experienced an abrupt slowdown in the economy in 2008 and has yet to recover; economic growth was stagnant or negative in each year since 2009. Difficult problems still remain, including a stubbornly high unemployment rate, uneven regional development, and a challenging investment climate. Croatia continues to face reduced foreign investment. On 1 July 2013 Croatia joined the EU, following a decade-long application process. Croatia will be a member of the European Exchange Rate Mechanism until it meets the criteria for joining the Economic and Monetary Union and adopts the euro as its currency. EU accession has increased pressure on the government to reduce Croatia’s relatively high public debt, which triggered the EU’s excessive deficit procedure for fiscal consolidation. Zagreb has cut spending since 2012, and the government also raised additional revenues through more stringent tax collection and by raising the Value Added Tax. The government has also sought to accelerate privatization of non-strategic assets, with mixed success.
$78.9 billion (2013 est.)//$79.7 billion (2012 est.)//$81.3 billion (2012 est.)
-1% (2013 est.)//-1.9% (2012 est.)//-0.2% (2011 est.)
$17,800 (2013 est.)//$17,900 (2012 est.)//$18,200 (2011 est.)
$59.14 billion (2013 est.)
Labour & EmploymentBack to top ↑
- Employment & Labour Force Participation
- Labour Market Institutions & Wage Setting
- Employment Services & Skills Matching
- Labour Adjustment, Transition & Formalisation
1.715 million (2013 est.)
21.6% (2013 est.)//19.1% (2012 est.)
Industrial & Sectoral BaseBack to top ↑
- Manufacturing & Advanced Industry
- Foundational & Process Industries
- Agrifood & Primary Production
- Services Economy
arable crops (wheat, corn, barley, sugar beet, sunflower, rapeseed, alfalfa, clover); vegetables (potatoes, cabbage, onion, tomato, pepper); fruits (apples, plum, mandarins, olives), grapes for wine; livestock (cattle, cows, pigs); dairy products
chemicals and plastics, machine tools, fabricated metal, electronics, pig iron and rolled steel products, aluminum, paper, wood products, construction materials, textiles, shipbuilding, petroleum and petroleum refining, food and beverages, tourism
-1.8% (2013 est.)
Structural Transformation & ComplexityBack to top ↑
Business Dynamism & EntrepreneurshipBack to top ↑
- Entrepreneurship & Firm Creation
- Risk Capital & Scale-Up Finance
- Firm Growth, Exit & Renewal
- Competition & Market Contestability
Innovation & CommercialisationBack to top ↑
- Business Innovation Capability
- Research Commercialisation & Knowledge Transfer
- Intellectual Property & Intangible Assets
- Innovation Ecosystems & Clusters
Technology Adoption & DiffusionBack to top ↑
GINC Capability Domains · Chapter 12
Trade and Investment
🇭🇷 Croatia’s markets, capital and the terms of global exchange
Overall tradeBack to top ↑
$22.6B of exports to 193 partners and $45.8B of imports from 163 in 2024, a deficit of $23.2B.
- Exports
- $22.6B193 partners
- Imports
- $45.8B163 partners
- Balance
- −$23.2Bdeficit
- Total trade
- $68.5B2024
ExportsBack to top ↑
Where its exports go
The largest partners in 2024, with each one's share of the nation's exports.
| Partner | Value | Share | |
|---|---|---|---|
| Germany | $2.73B | 12% | |
| Italy | $2.70B | 12% | |
| Slovenia | $2.30B | 10% | |
| Bosnia and Herzegovina | $1.36B | 6.0% | |
| Austria | $1.26B | 5.6% | |
| Serbia | $1.13B | 5.0% | |
| Hungary | $1.12B | 4.9% | |
| United States | $1.01B | 4.4% | |
| Slovakia | $616M | 2.7% | |
| France | $525M | 2.3% | |
| Poland | $521M | 2.3% | |
| Netherlands | $463M | 2.0% | |
| Switzerland | $395M | 1.7% | |
| United Kingdom | $375M | 1.7% | |
| Romania | $365M | 1.6% | |
| Spain | $364M | 1.6% | |
| Czech Republic | $346M | 1.5% | |
| Belgium | $297M | 1.3% | |
| Montenegro | $296M | 1.3% | |
| Sweden | $262M | 1.2% |
What it exports
The largest categories in 2024.
| Category | Value | Share | |
|---|---|---|---|
| Electrical, electronic equipment | $2.34B | 10% | |
| Mineral fuels, oils, distillation products | $1.93B | 8.5% | |
| Machinery, nuclear reactors, boilers | $1.91B | 8.4% | |
| Pharmaceutical products | $1.33B | 5.9% | |
| Wood and articles of wood, wood charcoal | $1.13B | 5.0% | |
| Vehicles other than railway, tramway | $963M | 4.3% | |
| Aluminum | $760M | 3.4% | |
| Plastics | $688M | 3.0% | |
| Articles of iron or steel | $643M | 2.8% | |
| Articles of apparel, knit or crocheted | $619M | 2.7% | |
| Ships, boats, and other floating structures | $561M | 2.5% | |
| Furniture, lighting signs, prefabricated buildings | $547M | 2.4% | |
| Paper and paperboard, articles of pulp, paper and board | $420M | 1.9% | |
| Glass and glassware | $402M | 1.8% | |
| Iron and steel | $359M | 1.6% |
ImportsBack to top ↑
Where its imports come from
The largest partners in 2024, with each one's share of the nation's imports.
| Partner | Value | Share | |
|---|---|---|---|
| Germany | $6.48B | 14% | |
| Italy | $5.96B | 13% | |
| Slovenia | $5.32B | 12% | |
| Hungary | $3.02B | 6.6% | |
| Austria | $2.40B | 5.2% | |
| France | $1.84B | 4.0% | |
| Poland | $1.82B | 4.0% | |
| Netherlands | $1.80B | 3.9% | |
| China | $1.71B | 3.7% | |
| Bosnia and Herzegovina | $1.32B | 2.9% | |
| Spain | $1.13B | 2.5% | |
| Serbia | $1.08B | 2.4% | |
| United States | $1.05B | 2.3% | |
| Czech Republic | $1.04B | 2.3% | |
| Slovakia | $1.01B | 2.2% | |
| Azerbaijan | $981M | 2.1% | |
| Turkey | $736M | 1.6% | |
| Belgium | $710M | 1.5% | |
| Romania | $616M | 1.3% | |
| Bulgaria | $574M | 1.3% |
What it imports
The largest categories in 2024.
| Category | Value | Share | |
|---|---|---|---|
| Mineral fuels, oils, distillation products | $7.19B | 16% | |
| Machinery, nuclear reactors, boilers | $3.96B | 8.6% | |
| Vehicles other than railway, tramway | $3.72B | 8.1% | |
| Electrical, electronic equipment | $3.49B | 7.6% | |
| Pharmaceutical products | $2.07B | 4.5% | |
| Plastics | $1.78B | 3.9% | |
| Articles of apparel, knit or crocheted | $1.09B | 2.4% | |
| Articles of iron or steel | $1.07B | 2.3% | |
| Aluminum | $1.00B | 2.2% | |
| Iron and steel | $959M | 2.1% | |
| Furniture, lighting signs, prefabricated buildings | $900M | 2.0% | |
| Optical, photo, technical, medical apparatus | $888M | 1.9% | |
| Meat and edible meat offal | $825M | 1.8% | |
| Paper and paperboard, articles of pulp, paper and board | $809M | 1.8% | |
| Articles of apparel, not knit or crocheted | $793M | 1.7% |
In a list, the bar runs to the largest in that list. The line is each figure’s history from 2000, drawn to its own peak: it shows the shape of the years, and the value shows the size.
External balanceBack to top ↑
-$102.3 million (2013 est.)//-$17.59 million (2012 est.)
Trade Facilitation & LogisticsBack to top ↑
Trade Policy & Market AccessBack to top ↑
- Trade Policy & Negotiation Capability
- Market Access & Agreements Network
- Trade Law & Enforcement
- Standards, Conformity & Quality Infrastructure
Digital & Services TradeBack to top ↑
- Services Trade Capability
- Digital Trade & E-Commerce
- Data Flows & Digital Trade Governance
- Tourism & Visitor Economy
Investment Attraction & ProjectionBack to top ↑
- Investment Attraction & Facilitation
- Investment Absorption & Linkages
- Outward Investment & Global Corporate Presence
$37.5 billion (31 December 2013 est.)//$36.08 billion (31 December 2012 est.)
$6.081 billion (31 December 2013 est.)//$5.581 billion (31 December 2012 est.)
Export Capability & SophisticationBack to top ↑
$12.36 billion (2013 est.)//$13.16 billion (2012 est.)
Italy 14.1%, Bosnia Herzegovina 13.1%, Germany 11.1%, Slovenia 10.1%, Austria 6.3% (2012 est.)
transport equipment, machinery, textiles, chemicals, foodstuffs, fuels
Global Value Chain PositionBack to top ↑
- Value Chain Participation & Integration
- Value Chain Position & Upgrading
- Regional Integration & Hub Anchoring
Economic Leverage & DependenceBack to top ↑
- Strategic Supply Security
- Concentration Risk & Revenue Stabilisation
- Economic Leverage & Coercion Resistance
$21.74 billion (2013 est.)//$22.16 billion (2012 est.)
Germany 13.7%, Italy 12.5%, Slovenia 11.5%, Austria 9.1%, Hungary 6.2%, Russia 5.4% (2012 est.)
machinery, transport and electrical equipment; chemicals, fuels and lubricants; foodstuffs
Croatia · you are in
Historical Context
Foundations
GINC Capability Domains
Find in this brief · Croatia