
Azerbaijan
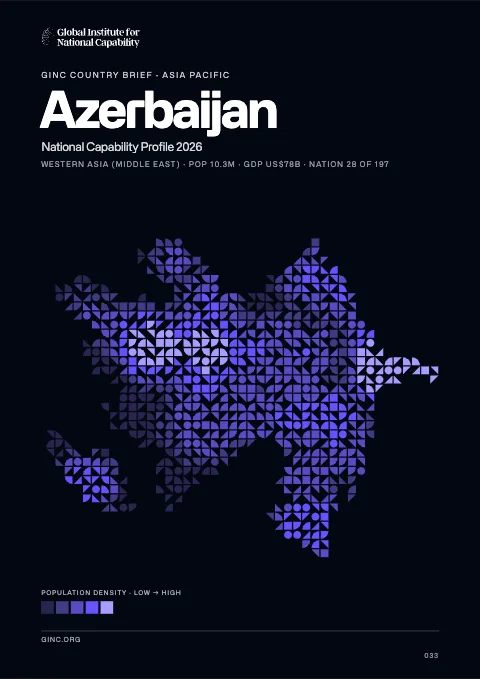
Azerbaijan is a landlocked republic in the Middle East, home to 9.7 million people, with its capital at Baku.
Contents
12 chapters
Foundations
01–03
At a glance
- Area
- 86.6Kkm²#113 World#9 Middle East
- Population
- 9.7M#91 World#7 Middle East
- GDP (market)
- $76B
- GDP (PPP)
- $102.7B#74 World#10 Middle East
- GDP per capita
- $10.8K#114 World#11 Middle East
The whole brief
Azerbaijan National Capability Profile 2026
Foundations · Chapter 01
Historical Context
🇦🇿 Azerbaijan’s understanding the origins and evolution of the modern nation
BackgroundBack to top ↑
Azerbaijan - a nation with a majority-Turkic and majority-Shia Muslim population - was briefly independent (from 1918 to 1920) following the collapse of the Russian Empire; it was subsequently incorporated into the Soviet Union for seven decades. Azerbaijan has yet to resolve its conflict with Armenia over Nagorno-Karabakh, a primarily Armenian-populated region that Moscow recognized in 1923 as an autonomous republic within Soviet Azerbaijan after Armenia and Azerbaijan disputed the territory's status. Armenia and Azerbaijan began fighting over the area in 1988; the struggle escalated after both countries attained independence from the Soviet Union in 1991. By May 1994, when a cease-fire took hold, ethnic Armenian forces held not only Nagorno-Karabakh but also seven surrounding provinces in the territory of Azerbaijan. The OSCE Minsk Group, co-chaired by the United States, France, and Russia, is the framework established to mediate a peaceful resolution of the conflict. Corruption in the country is widespread, and the government, which eliminated presidential term limits in a 2009 referendum, has been accused of authoritarianism. Although the poverty rate has been reduced and infrastructure investment has increased substantially in recent years due to revenue from oil and gas production, reforms have not adequately addressed weaknesses in most government institutions, particularly in the education and health sectors.
IndependenceBack to top ↑
30 August 1991 (declared from the Soviet Union); 18 October 1991 (adopted by the Supreme Council of Azerbaijan)
National holidayBack to top ↑
Founding of the Democratic Republic of Azerbaijan, 28 May (1918)
Foundations · Chapter 02
Geography
🇦🇿 Azerbaijan’s territory, resources and strategic position
Location and areaBack to top ↑
Southwestern Asia, bordering the Caspian Sea, between Iran and Russia, with a small European portion north of the Caucasus range
40 30 N, 47 30 E
Middle East
slightly smaller than Maine
0 km (landlocked); note - Azerbaijan borders the Caspian Sea (713 km)
none (landlocked)
Terrain and resourcesBack to top ↑
large, flat Kur-Araz Ovaligi (Kura-Araks Lowland, much of it below sea level) with Great Caucasus Mountains to the north, Qarabag Yaylasi (Karabakh Upland) in west; Baku lies on Abseron Yasaqligi (Apsheron Peninsula) that juts into Caspian Sea
petroleum, natural gas, iron ore, nonferrous metals, bauxite
14,250 sq km (2010)
Settlement and hazardsBack to top ↑
droughts
both the main area of the country and the Naxcivan exclave are landlocked
OtherBack to top ↑
34.68 cu km (2011)
local scientists consider the Abseron Yasaqligi (Apsheron Peninsula) (including Baku and Sumqayit) and the Caspian Sea to be the ecologically most devastated area in the world because of severe air, soil, and water pollution; soil pollution results from oil spills, from the use of DDT pesticide, and from toxic defoliants used in the production of cotton
Foundations · Chapter 03
Environment
🇦🇿 Azerbaijan’s environmental conditions, resources and national resilience
ClimateBack to top ↑
dry, semiarid steppe
Emissions and pollutionBack to top ↑
Water, waste and foodBack to top ↑
Resources and agreementsBack to top ↑
GINC Capability Domains · Chapter 04
Critical Technology
🇦🇿 Azerbaijan’s technology frontiers and the pursuit of national advantage
Two counts are set side by side for 2015–2024: on the left, the papers researchers in Azerbaijan published; on the right, the patent families that began there and were filed in more than one country. First by capability group, then group by group with each group’s capabilities. The badge on a card is the nation’s place among all nations. Papers are from GINC Research Analytics, patent families from GINC Patents.
Research by capability group
#90 WorldPapers published, 2015–2024
254
194
51
49
46
45
39
27
13
5
Patents by capability group
#90 WorldInternational patent families, 2015–2024
Advanced Materials & ManufacturingBack to top ↑
Research
#71 WorldPapers published, 2015–2024
Patents
#85 WorldInternational patent families, 2015–2024
Energy TechnologiesBack to top ↑
Research
#93 WorldPapers published, 2015–2024
Patents
#84 WorldInternational patent families, 2015–2024
Semiconductors & Advanced ComputingBack to top ↑
Research
#72 WorldPapers published, 2015–2024
No research topic: Semiconductor Design & EDA · Advanced Semiconductor Fabrication · Semiconductor Equipment & Materials · Advanced Packaging & Heterogeneous Integration
Patents
#69 WorldInternational patent families, 2015–2024
Artificial IntelligenceBack to top ↑
Research
#91 WorldPapers published, 2015–2024
Patents
#89 WorldInternational patent families, 2015–2024
Quantum TechnologiesBack to top ↑
Research
#80 WorldPapers published, 2015–2024
Patents
International patent families, 2015–2024
No international patent families on record for 2015–2024.
Connectivity, Cyber & Trust TechnologiesBack to top ↑
Research
#95 WorldPapers published, 2015–2024
Patents
#87 WorldInternational patent families, 2015–2024
Sensing, Timing & NavigationBack to top ↑
Research
#103 WorldPapers published, 2015–2024
Patents
#70 WorldInternational patent families, 2015–2024
Robotics & Autonomous SystemsBack to top ↑
Research
#92 WorldPapers published, 2015–2024
No research topic: Human-Machine Interfaces
Patents
#73 WorldInternational patent families, 2015–2024
Biotechnology & Health TechnologiesBack to top ↑
Research
#127 WorldPapers published, 2015–2024
Patents
International patent families, 2015–2024
No international patent families on record for 2015–2024.
Medicine and BioTech
Clinical research and life-science invention, drawn from the same series that drive the metric pages. Each card opens the full cross-country comparison.
Space TechnologiesBack to top ↑
Research
#61 WorldPapers published, 2015–2024
Patents
International patent families, 2015–2024
No international patent families on record for 2015–2024.
GINC Capability Domains · Chapter 05
Strategic Infrastructure
🇦🇿 Azerbaijan’s energy, connectivity and the material foundations of capability
Resource InfrastructureBack to top ↑
931,900 bbl/day (2012 est.)
821,000 bbl/day (2011 est.)
0 bbl/day (2010 est.)
7 billion bbl (1 January 2013 est.)
133,500 bbl/day (2010 est.)
168,000 bbl/day (2011 est.)
53,440 bbl/day (2010 est.)
499 bbl/day (2010 est.)
17.86 billion cu m (2011 est.)
9.921 billion cu m (2010 est.)
5.55 billion cu m (2011 est.)
250 million cu m (2011 est.)
991.1 billion cu m (1 January 2013 est.)
condensate 89 km; gas 3,890 km; oil 2,446 km (2013)
Agriculture & Food InfrastructureBack to top ↑
- Irrigation & Agricultural Water
- Livestock & Veterinary
- Fisheries & Aquaculture
- Storage, Cold Chain & Markets
Energy InfrastructureBack to top ↑
- Thermal Generation
- Nuclear Generation
- Nuclear Fuel Cycle & Radioactive Waste
- Hydropower
- Renewable Generation
- Transmission & Distribution
- System Control & Dispatch
- Storage & Fuel Supply
6.392 million kW (2010 est.)
22.99 billion kWh (2012 est.)
20.29 billion kWh (2012 est.)
462 million kWh (2010 est.)
100 million kWh (2010 est.)
84.5% of total installed capacity (2010 est.)
0% of total installed capacity (2010 est.)
15.4% of total installed capacity (2010 est.)
0.1% of total installed capacity (2010 est.)
36.52 million Mt (2011 est.)
Water, Sanitation & Waste InfrastructureBack to top ↑
- Dams, Reservoirs & Flood Defence
- Water Supply & Treatment
- Bulk Water Transfer & Desalination
- Wastewater & Sanitation
- Solid Waste & Recycling
Advanced ManufacturingBack to top ↑
- Materials & Inputs
- Chemicals & Hazardous Process Industry
- Production Systems
- Supply Chain & Ecosystem
- Workforce & Innovation
Transport InfrastructureBack to top ↑
- Seaports & Terminals
- Air Infrastructure
- Air Navigation & Traffic Management
- Inland Waterways & Ferries
- Rail Infrastructure
- Roads & Bridges
- Logistics, Multimodal & Border Infrastructure
- Postal & Parcel
37 (2013)
1 (2012)
Communications & Digital InfrastructureBack to top ↑
- Subsea Cables & International Gateways
- Core & Backbone Networks
- Mobile & Wireless Networks
- Spectrum & Broadcasting
- Data Centres, Compute & Cloud
- Data Resources
- AI Tools & Applications
1.734 million (2012)
10.125 million (2012)
2.42 million (2009)
46,856 (2012)
.az
Financial InfrastructureBack to top ↑
- Currency & Reserves
- Payments & Settlement Systems
- Markets, Exchanges & Depositories
- Banks, Insurers & Systemic Institutions
Social InfrastructureBack to top ↑
- Health Infrastructure
- Public Health & Laboratories
- Medical Supply & Stockpiles
- Education & Skills Infrastructure
- Research & Scientific Facilities
- Housing, Community & Social Services
- Government & Public Administration
- Cultural, Community & Recreational Infrastructure
- Justice & Corrections
- Emergency Services & Civil Protection
- Hydrometeorology & Early Warning
Space, Aerospace & Defence InfrastructureBack to top ↑
GINC Capability Domains · Chapter 06
National Security
🇦🇿 Azerbaijan’s force, intelligence and the defence of the nation
Disputes and terrorismBack to top ↑
Azerbaijan, Kazakhstan, and Russia ratified the Caspian seabed delimitation treaties based on equidistance, while Iran continues to insist on a one-fifth slice of the sea; the dispute over the break-away Nagorno-Karabakh region and the Armenian military occupation of surrounding lands in Azerbaijan remains the primary focus of regional instability; residents have evacuated the former Soviet-era small ethnic enclaves in Armenia and Azerbaijan; local border forces struggle to control the illegal transit of goods and people across the porous, undemarcated Armenian, Azerbaijani, and Georgian borders; bilateral talks continue with Turkmenistan on dividing the seabed and contested oilfields in the middle of the Caspian
Force Generation & MobilisationBack to top ↑
Army, Navy, Air, and Air Defense Forces (2010)
men between 18 and 35 are liable for military service; length of service is 18 months and 12 months for university graduates; 17 years of age for voluntary service; 17 year olds are considered to be on active service at cadet military schools (2012)
5.2% of GDP (2013)//4.64% of GDP (2012)//4.67% of GDP (2011)//4.64% of GDP (2010)
Forces under arms
Active-duty strength on the Correlates of War series, which reaches back to 1816 and so carries a nation’s whole record of mobilisation rather than its present establishment. The card opens the full cross-country comparison.
Intelligence & AssessmentBack to top ↑
- Imagery & Geospatial Intelligence
- Signals & Cyber Intelligence
- Technical & Measurement Intelligence
- Open-Source & Financial Intelligence
- Human Intelligence & Counterintelligence
- All-Source Analysis & Warning
Joint Command, Projection & SustainmentBack to top ↑
- Command, Control & Communications
- Strategic Lift & Mobility
- Expeditionary & Peace Operations
- Operational Sustainment & War Reserves
- Defence Industrial Mobilisation
- CBRN Defence
Land PowerBack to top ↑
- Combined Arms Manoeuvre
- Land Fires
- Battlefield Aviation & Uncrewed Systems
- Special Operations & Irregular Warfare
Maritime PowerBack to top ↑
- Maritime Security & Constabulary
- Sea Denial & Undersea Warfare
- Sea Control
- Amphibious & Expeditionary Operations
Air PowerBack to top ↑
- Air Sovereignty & Policing
- Control of the Air
- Air Strike & Interdiction
- Airborne ISR, Early Warning & Battle Management
Strategic Strike & Missile DefenceBack to top ↑
Space OperationsBack to top ↑
Cyber & Electromagnetic OperationsBack to top ↑
Nuclear DeterrenceBack to top ↑
GINC Capability Domains · Chapter 07
Human Capital
🇦🇿 Azerbaijan’s population, health and the skills that sustain capability
DemographyBack to top ↑
9,686,210 (July 2014 est.)
0.99% (2014 est.)
16.96 births/1,000 population (2014 est.)
7.09 deaths/1,000 population (2014 est.)
1.91 children born/woman (2014 est.)
23.4 (2011 est.)
51.1% (2006)
Migration and urbanisationBack to top ↑
0 migrant(s)/1,000 population (2014 est.)
BAKU (capital) 2.123 million (2011)
Welfare and equityBack to top ↑
6% (2012 est.)
33.7 (2008)//36.5 (2001)
DisplacementBack to top ↑
Early Childhood DevelopmentBack to top ↑
8.4% (2006)
Foundational EducationBack to top ↑
2.4% of GDP (2011)
Advanced EducationBack to top ↑
Technical & Vocational SkillsBack to top ↑
Digital & AI CompetenceBack to top ↑
Generative AI adoption
Modelled share of working-age adults using generative AI, from Microsoft telemetry scaled to each country’s 15–64 population. A measure of how fast a workforce is absorbing the technology rather than of how much of it a nation builds. The card opens the full cross-country comparison.
Lifelong Learning & ReskillingBack to top ↑
Research Talent & Knowledge CreationBack to top ↑
Population HealthBack to top ↑
43 deaths/100,000 live births (2010)
23.8% (2008)
0.2% (2012 est.)
10,400 (2012 est.)
600 (2012 est.)
Health System CapabilityBack to top ↑
5.2% of GDP (2011)
3.38 physicians/1,000 population (2011)
4.6 beds/1,000 population (2011)
GINC Capability Domains · Chapter 08
Governance and Integrity
🇦🇿 Azerbaijan’s institutions, law and the integrity of the state
State structureBack to top ↑
republic
66 rayons (rayonlar; rayon - singular), 11 cities (saharlar; sahar - singular);
several previous; latest adopted 12 November 1995; amended 1996, 2002, 2009 (2009)
18 years of age; universal
Political Institutions & Civic ParticipationBack to top ↑
- Electoral Management & Integrity
- Legislature & Deliberative Institutions
- Citizen Participation & Civic Space
unicameral National Assembly or Milli Mejlis (125 seats; members elected by popular vote to serve five-year terms)
Azerbaijan Democratic Party or ADP [Sardar JALALOGLU]//Azerbaijan Popular Front or AXCP [Ali KARIMLI]//Civil Solidarity Party or CSP [Sabir RUSTAMKHANLI]//Civil Unity Party [Sabir HACIYEV]//Classical Popular Front Party of Azerbaijan [Mirmahmud MIRALI-OGLU]//Democratic Reforms Party [Asim MOLLAZADE]//Great Creation Party [Fazil Gazanfaroglu MUSTAFAYEV]//Hope (Umid) Party [Igbal AGAZADE]//Justice Party [Ilyas ISMAILOV]//Liberal Party of Azerbaijan [Lala Shovkat HACIYEVA, Avaz TEMIRKHAN]//Motherland Party [Fazail AGAMALI]//Musavat (Equality) [Isa GAMBAR]//Open Society Party [Sulhaddin AKBAR]//Social Democratic Party of Azerbaijan or SDP [Araz ALIZADE]//Social Welfare Party [Khanhusein KAZIMLI]//Whole Azerbaijan Popular Front Party [Gudrat HASANGULIYEV]//Yeni (New) Azerbaijan Party or YAP [President Ilham ALIYEV]
EL Movement [Eldar NAMAZOV]//Karabakh Liberation Organization//Forum of Intelligentsia [Rustam IBRAHIMBEYOV]//Republican Alternative (REAL) [Ilgar MAMMADOV]//National Council of Democratic Forces [Jamil HASANLI]//NIDA Youth Movement [Turgut GAMBAR, Zaur GURBANLI (in jail)]//Positive Change Youth Movement [Bakhtiyar HAJIYEV]//Ireli Youth Movement [Rauf MERDIYEV]//Ol! Youth Movement [Vugar SALAMLI]
Justice System & Fundamental RightsBack to top ↑
- Judicial Independence & Court Capability
- Access to Justice & Legal Services
- Fundamental Rights Protection
- Human Rights Institutions & Equality Bodies
civil law system
has not submitted an ICJ jurisdiction declaration; non-party state to the ICCt
Internal Security & OrderBack to top ↑
limited illicit cultivation of cannabis and opium poppy, mostly for CIS consumption; small government eradication program; transit point for Southwest Asian opiates bound for Russia and to a lesser extent the rest of Europe
Regulatory Governance & Strategic ControlsBack to top ↑
- Regulatory Quality & Better Regulation
- Regulatory Delivery & Independent Regulators
- Strategic Controls & Economic Security Administration
Government Effectiveness & Public AdministrationBack to top ↑
- Centre of Government & Policy Coordination
- Civil Service & Public Workforce
- Digital Government & Service Delivery
- Legal Identity & Civil Registration
- Statistical & Data Capability
Public Integrity & Anti-CorruptionBack to top ↑
Transparency, Oversight & AccountabilityBack to top ↑
- Right to Information & Open Government
- Independent Oversight & Supreme Audit
- Independent Media & Journalist Safety
National Resilience & Crisis ManagementBack to top ↑
GINC Capability Domains · Chapter 09
Information and Influence
🇦🇿 Azerbaijan’s identity, media and the projection of influence
Identity and cultureBack to top ↑
Azerbaijani (Azeri) (official) 92.5%, Russian 1.4%, Armenian 1.4%, other 4.7% (2009 est.)
Muslim 93.4%, Russian Orthodox 2.5%, Armenian Orthodox 2.3%, other 1.8% (1995 est.)
Azerbaijani 91.6%, Lezgian 2%, Russian 1.3%, Armenian 1.3%, Talysh 1.3%, other 2.4%
flames of fire
three equal horizontal bands of blue (top), red, and green; a crescent and eight-pointed star in white are centered in the red band; the blue band recalls Azerbaijan's Turkic heritage, red stands for modernization and progress, and green refers to Islam; the crescent moon is an Islamic symbol, while the eight-pointed star represents the eight Turkic peoples of the world
Diplomatic Statecraft & Global NetworksBack to top ↑
- Diplomatic Network & Consular Reach
- Multilateral Leadership & Norm Setting
- Agenda-Setting & Convening
- Mediation & Crisis Diplomacy
ADB, BSEC, CD, CE, CICA, CIS, EAPC, EBRD, ECO, EITI (compliant country), FAO, GCTU, GUAM, IAEA, IBRD, ICAO, ICC (NGOs), ICRM, IDA, IDB, IFAD, IFC, IFRCS, ILO, IMF, IMO, Interpol, IOC, IOM, IPU, ISO, ITSO, ITU, ITUC (NGOs), MIGA, NAM, OAS (observer), OIC, OPCW, OSCE, PFP, SELEC (observer), UN, UNCTAD, UNESCO, UNHCR, UNIDO, UNWTO, UPU, WCO, WFTU (NGOs), WHO, WIPO, WMO, WTO (observer)
Alliances & Security CooperationBack to top ↑
Development Cooperation & Global AssistanceBack to top ↑
Culture, Language & Education DiplomacyBack to top ↑
- Cultural & Language Institutes
- Creative Industries & Cultural Export Reach
- Heritage & Cultural Institutions
- Education Diplomacy & Alumni Networks
- Sports & Major Events
Diaspora & Global CommunitiesBack to top ↑
Information Environment & Strategic CommunicationBack to top ↑
- Strategic Communications & Public Diplomacy
- International Media & Broadcasting
- Information Defence & Counter-Interference
3 state-run and 1 public TV channels; 4 domestic commercial TV stations and about 15 regional TV stations; cable TV services are available in Baku; 1 state-run and 1 public radio network operating; a small number of private commercial radio stations broadcasting; local FM relays of Baku commercial stations are available in many localities; local relays of several international broadcasters had been available until late 2008 when their broadcasts were banned from FM frequencies (2010)
GINC Capability Domains · Chapter 10
Financial Strength
🇦🇿 Azerbaijan’s fiscal depth, reserves and the capacity to act
Monetary & Currency CapabilityBack to top ↑
- Monetary Policy & Price Stability
- Exchange Rate & External Account Management
- Currency Issuance & Digital Money
2.4% (2013 est.)//1.1% (2012 est.)
Azerbaijani manats (AZN) per US dollar -//0.785 (2013 est.)//0.7857 (2012 est.)//0.8027 (2010 est.)//0.8038 (2009)//0.8219 (2008)
5% (31 December 2012 est.)//5.25% (31 December 2011 est.)
17% (31 December 2013 est.)//18.5% (31 December 2012 est.)
$17.17 billion (31 December 2013 est.)//$14.15 billion (31 December 2012 est.)
$21.88 billion (31 December 2013 est.)//$17.59 billion (31 December 2012 est.)
Fiscal Capacity & Public FinanceBack to top ↑
- Revenue Mobilisation & Tax Administration
- Public Expenditure & Budget Management
- Sovereign Debt & Treasury Management
- Public Investment Management
36.3% of GDP (2013 est.)
0.5% of GDP (2013 est.)
7.5% of GDP (2013 est.)//7.8% of GDP (2012 est.)
calendar year
Financial System Depth & AccessBack to top ↑
- Banking System Capacity
- Capital Markets Depth & Development
- Long-Term & Institutional Capital
- Financial Inclusion & Household Access
- Development & Policy Finance
$21.76 billion (31 December 2013 est.)//$17.01 billion (31 December 2012 est.)
$NA
41% of GDP (2013 est.)//44.4% of GDP (2012 est.)//45.1% of GDP (2011 est.)
Financial Regulation & IntegrityBack to top ↑
- Prudential Regulation & Supervision
- Financial Integrity & Illicit Finance Control
- Market Conduct & Consumer Protection
- Payment & Market Infrastructure Oversight
Financial Stability & Crisis ManagementBack to top ↑
- Macroprudential & Systemic Oversight
- Crisis Management, Resolution & Deposit Insurance
- External Liquidity & Financial Safety Nets
Sovereign Capital & External Financial PowerBack to top ↑
- Official Reserves Management
- Sovereign Wealth & Public Asset Management
- Currency Internationalisation & Reserve Status
- Capital Account & Flow Management
- International Financial Centre Capability
$13.08 billion (31 December 2013 est.)//$11.28 billion (31 December 2012 est.)
$9.552 billion (31 December 2013 est.)//$9.11 billion (31 December 2012 est.)
GINC Capability Domains · Chapter 11
Production and Innovation
🇦🇿 Azerbaijan’s output, industry and the engine of prosperity
Economic Output & ProductivityBack to top ↑
Azerbaijan's high economic growth has been attributable to large and growing oil and gas exports, but some non-export sectors also featured double-digit growth, including construction, banking, and real estate. Oil exports through the Baku-Tbilisi-Ceyhan Pipeline, the Baku-Novorossiysk, and the Baku-Supsa pipelines remain the main economic driver, but efforts to boost Azerbaijan's gas production are underway. The eventual completion of the geopolitically important Southern Gas Corridor between Azerbaijan and Europe will open up another, albeit, smaller source of revenue from gas exports. Azerbaijan has made only limited progress on instituting market-based economic reforms. Pervasive public and private sector corruption and structural economic inefficiencies remain a drag on long-term growth, particularly in non-energy sectors. Several other obstacles impede Azerbaijan's economic progress, including the need for stepped up foreign investment in the non-energy sector and the continuing conflict with Armenia over the Nagorno-Karabakh region. Trade with Russia and the other former Soviet republics is declining in importance, while trade is building with Turkey and the nations of Europe. Long-term prospects depend on world oil prices, Azerbaijan's ability to negotiate export routes for its growing gas production, and its ability to use its energy wealth to promote growth and spur employment in non-energy sectors of the economy.
$102.7 billion (2013 est.)//$97.04 billion (2012 est.)//$94.98 billion (2011 est.)
5.8% (2013 est.)//2.2% (2012 est.)//0.1% (2011 est.)
$10,800 (2013 est.)//$10,500 (2012 est.)//$10,400 (2011 est.)
$76.01 billion (2013 est.)
Labour & EmploymentBack to top ↑
- Employment & Labour Force Participation
- Labour Market Institutions & Wage Setting
- Employment Services & Skills Matching
- Labour Adjustment, Transition & Formalisation
4.68 million (2012 est.)
6% (2013 est.)//5.7% (2012 est.)
Industrial & Sectoral BaseBack to top ↑
- Manufacturing & Advanced Industry
- Foundational & Process Industries
- Agrifood & Primary Production
- Services Economy
cotton, grain, rice, grapes, fruit, vegetables, tea, tobacco; cattle, pigs, sheep, goats
petroleum and petroleum products, natural gas, oilfield equipment; steel, iron ore; cement; chemicals and petrochemicals; textiles
3% (2013 est.)
Structural Transformation & ComplexityBack to top ↑
Business Dynamism & EntrepreneurshipBack to top ↑
- Entrepreneurship & Firm Creation
- Risk Capital & Scale-Up Finance
- Firm Growth, Exit & Renewal
- Competition & Market Contestability
Innovation & CommercialisationBack to top ↑
- Business Innovation Capability
- Research Commercialisation & Knowledge Transfer
- Intellectual Property & Intangible Assets
- Innovation Ecosystems & Clusters
Technology Adoption & DiffusionBack to top ↑
GINC Capability Domains · Chapter 12
Trade and Investment
🇦🇿 Azerbaijan’s markets, capital and the terms of global exchange
Overall tradeBack to top ↑
$26.4B of exports to 132 partners and $23.1B of imports from 165 in 2024, a surplus of $3.26B.
- Exports
- $26.4B132 partners
- Imports
- $23.1B165 partners
- Balance
- +$3.26Bsurplus
- Total trade
- $49.6B2024
ExportsBack to top ↑
Where its exports go
The largest partners in 2024, with each one's share of the nation's exports.
| Partner | Value | Share | |
|---|---|---|---|
| Italy | $8.64B | 33% | |
| Turkey | $4.52B | 17% | |
| Czech Republic | $1.36B | 5.2% | |
| Russia | $1.18B | 4.5% | |
| Greece | $1.18B | 4.5% | |
| Croatia | $981M | 3.7% | |
| Germany | $892M | 3.4% | |
| India | $736M | 2.8% | |
| Israel | $735M | 2.8% | |
| Portugal | $710M | 2.7% | |
| Romania | $699M | 2.6% | |
| Georgia | $587M | 2.2% | |
| Bulgaria | $364M | 1.4% | |
| Nigeria | $326M | 1.2% | |
| Tunisia | $280M | 1.1% | |
| Thailand | $257M | 1.0% | |
| United Kingdom | $253M | 1.0% | |
| Switzerland | $233M | 0.9% | |
| Ukraine | $212M | 0.8% | |
| Serbia | $197M | 0.7% |
What it exports
The largest categories in 2024.
| Category | Value | Share | |
|---|---|---|---|
| Mineral fuels, oils, distillation products | $22.7B | 86% | |
| Edible fruits, nuts, peel of citrus fruit, melons | $505M | 1.9% | |
| Plastics | $373M | 1.4% | |
| Arms and ammunition, parts and accessories | $331M | 1.3% | |
| Aluminum | $241M | 0.9% | |
| Cotton | $230M | 0.9% | |
| Pearls, precious stones, metals, coins | $226M | 0.9% | |
| Edible vegetables and certain roots and tubers | $214M | 0.8% | |
| Vehicles other than railway, tramway | $190M | 0.7% | |
| Fertilizers | $184M | 0.7% | |
| Organic chemicals | $148M | 0.6% | |
| Salt, sulphur, earth, stone, plaster, lime and cement | $98.2M | 0.4% | |
| Dairy products, eggs, honey, edible products | $97.8M | 0.4% | |
| Iron and steel | $91.7M | 0.3% | |
| Machinery, nuclear reactors, boilers | $85.1M | 0.3% |
ImportsBack to top ↑
Where its imports come from
The largest partners in 2024, with each one's share of the nation's imports.
| Partner | Value | Share | |
|---|---|---|---|
| China | $3.72B | 16% | |
| Russia | $3.62B | 16% | |
| Turkey | $2.66B | 11% | |
| United States | $1.58B | 6.8% | |
| Australia | $1.46B | 6.3% | |
| United Kingdom | $907M | 3.9% | |
| Germany | $791M | 3.4% | |
| Georgia | $681M | 2.9% | |
| Iran | $633M | 2.7% | |
| Kazakhstan | $609M | 2.6% | |
| Italy | $517M | 2.2% | |
| Belarus | $456M | 2.0% | |
| Japan | $379M | 1.6% | |
| South Korea | $357M | 1.5% | |
| Turkmenistan | $303M | 1.3% | |
| Switzerland | $260M | 1.1% | |
| India | $242M | 1.0% | |
| Mexico | $239M | 1.0% | |
| France | $234M | 1.0% | |
| Ukraine | $232M | 1.0% |
What it imports
The largest categories in 2024.
| Category | Value | Share | |
|---|---|---|---|
| Pearls, precious stones, metals, coins | $3.91B | 17% | |
| Vehicles other than railway, tramway | $2.62B | 11% | |
| Machinery, nuclear reactors, boilers | $2.36B | 10% | |
| Mineral fuels, oils, distillation products | $1.91B | 8.3% | |
| Electrical, electronic equipment | $1.85B | 8.0% | |
| Articles of iron or steel | $650M | 2.8% | |
| Plastics | $581M | 2.5% | |
| Iron and steel | $569M | 2.5% | |
| Pharmaceutical products | $510M | 2.2% | |
| Optical, photo, technical, medical apparatus | $414M | 1.8% | |
| Wood and articles of wood, wood charcoal | $403M | 1.7% | |
| Cereals | $389M | 1.7% | |
| Paper and paperboard, articles of pulp, paper and board | $332M | 1.4% | |
| Aluminum | $312M | 1.3% | |
| Articles of apparel, knit or crocheted | $274M | 1.2% |
In a list, the bar runs to the largest in that list. The line is each figure’s history from 2000, drawn to its own peak: it shows the shape of the years, and the value shows the size.
External balanceBack to top ↑
$13.28 billion (2013 est.)//$14.98 billion (2012 est.)
Trade Facilitation & LogisticsBack to top ↑
Trade Policy & Market AccessBack to top ↑
- Trade Policy & Negotiation Capability
- Market Access & Agreements Network
- Trade Law & Enforcement
- Standards, Conformity & Quality Infrastructure
Digital & Services TradeBack to top ↑
- Services Trade Capability
- Digital Trade & E-Commerce
- Data Flows & Digital Trade Governance
- Tourism & Visitor Economy
Investment Attraction & ProjectionBack to top ↑
- Investment Attraction & Facilitation
- Investment Absorption & Linkages
- Outward Investment & Global Corporate Presence
$14.35 billion (31 December 2013 est.)//$12.35 billion (31 December 2012 est.)
$8.616 billion (31 December 2013 est.)//$7.516 billion (31 December 2012 est.)
Export Capability & SophisticationBack to top ↑
$34.46 billion (2013 est.)//$32.63 billion (2012 est.)
Italy 25%, Indonesia 11.6%, Thailand 7%, Germany 5.7%, Israel 5.3%, France 4.7%, India 4.6%, Russia 4.5%, USA 4.1% (2013 est.)
oil and gas 90%, machinery, cotton, foodstuffs
Global Value Chain PositionBack to top ↑
- Value Chain Participation & Integration
- Value Chain Position & Upgrading
- Regional Integration & Hub Anchoring
Economic Leverage & DependenceBack to top ↑
- Strategic Supply Security
- Concentration Risk & Revenue Stabilisation
- Economic Leverage & Coercion Resistance
$10.72 billion (2013 est.)//$9.65 billion (2012 est.)
Russia 14.1%, Turkey 13.7%, UK 12.5%, Germany 7.7%, Ukraine 5.5%, China 5.3%, France 4% (2013 est.)
machinery and equipment, oil products, foodstuffs, metals, chemicals
Azerbaijan · you are in
Historical Context
Foundations
GINC Capability Domains
Find in this brief · Azerbaijan