
Belgium
Belgium is a federal parliamentary democracy in Europe, home to 10 million people, with its capital at Brussels.
Contents
12 chapters
Foundations
01–03
At a glance
- Area
- 30.5Kkm²#140 World#32 Europe
- Population
- 10.4M#83 World#12 Europe
- GDP (market)
- $507B
- GDP (PPP)
- $421.7B#32 World#7 Europe
- GDP per capita
- $37.8K#32 World#16 Europe
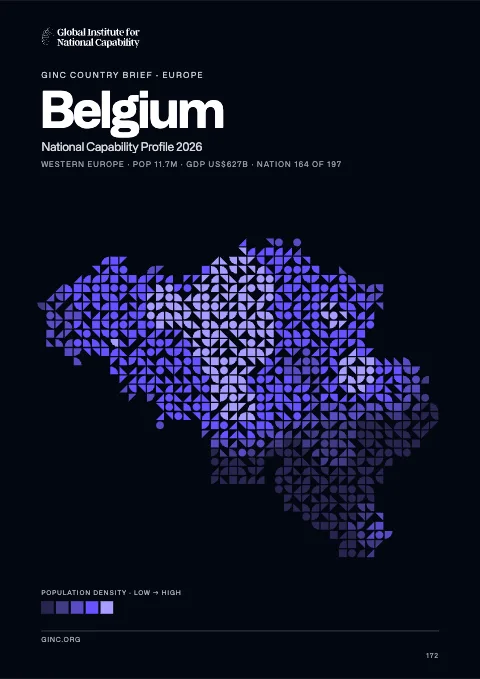
The whole brief
Belgium National Capability Profile 2026
Foundations · Chapter 01
Historical Context
🇧🇪 Belgium’s understanding the origins and evolution of the modern nation
BackgroundBack to top ↑
Belgium became independent from the Netherlands in 1830; it was occupied by Germany during World Wars I and II. The country prospered in the past half century as a modern, technologically advanced European state and member of NATO and the EU. Political divisions between the Dutch-speaking Flemings of the north and the French-speaking Walloons of the south have led in recent years to constitutional amendments granting these regions formal recognition and autonomy. Its capital, Brussels, is home to numerous international organizations including the EU and NATO.
IndependenceBack to top ↑
4 October 1830 (a provisional government declared independence from the Netherlands); 21 July 1831 (King LEOPOLD I ascended to the throne)
National holidayBack to top ↑
21 July (1831) ascension to the Throne of King LEOPOLD I
Foundations · Chapter 02
Geography
🇧🇪 Belgium’s territory, resources and strategic position
Location and areaBack to top ↑
Western Europe, bordering the North Sea, between France and the Netherlands
50 50 N, 4 00 E
Europe
about the size of Maryland
66.5 km
Terrain and resourcesBack to top ↑
flat coastal plains in northwest, central rolling hills, rugged mountains of Ardennes Forest in southeast
construction materials, silica sand, carbonates
233.5 sq km (2007)
Settlement and hazardsBack to top ↑
flooding is a threat along rivers and in areas of reclaimed coastal land, protected from the sea by concrete dikes
crossroads of Western Europe; most West European capitals within 1,000 km of Brussels, the seat of both the European Union and NATO
OtherBack to top ↑
18.3 cu km (2011)
the environment is exposed to intense pressures from human activities: urbanization, dense transportation network, industry, extensive animal breeding and crop cultivation; air and water pollution also have repercussions for neighboring countries; uncertainties regarding federal and regional responsibilities (now resolved) had slowed progress in tackling environmental challenges
Foundations · Chapter 03
Environment
🇧🇪 Belgium’s environmental conditions, resources and national resilience
ClimateBack to top ↑
temperate; mild winters, cool summers; rainy, humid, cloudy
Emissions and pollutionBack to top ↑
Water, waste and foodBack to top ↑
Resources and agreementsBack to top ↑
GINC Capability Domains · Chapter 04
Critical Technology
🇧🇪 Belgium’s technology frontiers and the pursuit of national advantage
Two counts are set side by side for 2015–2024: on the left, the papers researchers in Belgium published; on the right, the patent families that began there and were filed in more than one country. First by capability group, then group by group with each group’s capabilities. The badge on a card is the nation’s place among all nations. Papers are from GINC Research Analytics, patent families from GINC Patents.
Research by capability group
#29 WorldPapers published, 2015–2024
2,856
2,685
2,397
1,523
1,096
907
478
468
449
48
Patents by capability group
#20 WorldInternational patent families, 2015–2024
1,829
918
753
739
587
519
457
328
34
34
Advanced Materials & ManufacturingBack to top ↑
Research
#27 WorldPapers published, 2015–2024
Patents
#19 WorldInternational patent families, 2015–2024
Energy TechnologiesBack to top ↑
Research
#27 WorldPapers published, 2015–2024
Patents
#19 WorldInternational patent families, 2015–2024
Semiconductors & Advanced ComputingBack to top ↑
Research
#27 WorldPapers published, 2015–2024
No research topic: Semiconductor Design & EDA · Advanced Semiconductor Fabrication · Semiconductor Equipment & Materials · Advanced Packaging & Heterogeneous Integration
Patents
#13 WorldInternational patent families, 2015–2024
Artificial IntelligenceBack to top ↑
Research
#40 WorldPapers published, 2015–2024
Patents
#23 WorldInternational patent families, 2015–2024
Quantum TechnologiesBack to top ↑
Research
#29 WorldPapers published, 2015–2024
Patents
#21 WorldInternational patent families, 2015–2024
Connectivity, Cyber & Trust TechnologiesBack to top ↑
Research
#50 WorldPapers published, 2015–2024
Patents
#21 WorldInternational patent families, 2015–2024
Sensing, Timing & NavigationBack to top ↑
Research
#21 WorldPapers published, 2015–2024
Patents
#19 WorldInternational patent families, 2015–2024
Robotics & Autonomous SystemsBack to top ↑
Research
#35 WorldPapers published, 2015–2024
No research topic: Human-Machine Interfaces
Patents
#24 WorldInternational patent families, 2015–2024
Biotechnology & Health TechnologiesBack to top ↑
Research
#17 WorldPapers published, 2015–2024
Patents
#13 WorldInternational patent families, 2015–2024
Medicine and BioTech
Clinical research and life-science invention, drawn from the same series that drive the metric pages. Each card opens the full cross-country comparison.
Space TechnologiesBack to top ↑
Research
#21 WorldPapers published, 2015–2024
Patents
#23 WorldInternational patent families, 2015–2024
GINC Capability Domains · Chapter 05
Strategic Infrastructure
🇧🇪 Belgium’s energy, connectivity and the material foundations of capability
Resource InfrastructureBack to top ↑
10,530 bbl/day (2012 est.)
0 bbl/day (2010 est.)
667,700 bbl/day (2010 est.)
0 bbl (1 January 2013 est.)
720,000 bbl/day (2010 est.)
644,400 bbl/day (2011 est.)
442,800 bbl/day (2010 est.)
355,100 bbl/day (2010 est.)
0 cu m (2011 est.)
13.46 billion cu m (2011 est.)
21.18 billion cu m (2012 est.)
38.9 billion cu m (2012 est.)
0 cu m (1 January 2013 est.)
gas 3,139 km; oil 154 km; refined products 535 km (2013)
Agriculture & Food InfrastructureBack to top ↑
- Irrigation & Agricultural Water
- Livestock & Veterinary
- Fisheries & Aquaculture
- Storage, Cold Chain & Markets
Energy InfrastructureBack to top ↑
- Thermal Generation
- Nuclear Generation
- Nuclear Fuel Cycle & Radioactive Waste
- Hydropower
- Renewable Generation
- Transmission & Distribution
- System Control & Dispatch
- Storage & Fuel Supply
18.32 million kW (2010 est.)
83.37 billion kWh (2011 est.)
84.68 billion kWh (2010 est.)
6.911 billion kWh (2012 est.)
16.85 billion kWh (2012 est.)
43.6% of total installed capacity (2010 est.)
32.3% of total installed capacity (2010 est.)
0.6% of total installed capacity (2010 est.)
16.3% of total installed capacity (2010 est.)
131.1 million Mt (2011 est.)
Water, Sanitation & Waste InfrastructureBack to top ↑
- Dams, Reservoirs & Flood Defence
- Water Supply & Treatment
- Bulk Water Transfer & Desalination
- Wastewater & Sanitation
- Solid Waste & Recycling
Advanced ManufacturingBack to top ↑
- Materials & Inputs
- Chemicals & Hazardous Process Industry
- Production Systems
- Supply Chain & Ecosystem
- Workforce & Innovation
Transport InfrastructureBack to top ↑
- Seaports & Terminals
- Air Infrastructure
- Air Navigation & Traffic Management
- Inland Waterways & Ferries
- Rail Infrastructure
- Roads & Bridges
- Logistics, Multimodal & Border Infrastructure
- Postal & Parcel
41 (2013)
1 (2013)
2,043 km (1,528 km in regular commercial use) (2012)
Communications & Digital InfrastructureBack to top ↑
- Subsea Cables & International Gateways
- Core & Backbone Networks
- Mobile & Wireless Networks
- Spectrum & Broadcasting
- Data Centres, Compute & Cloud
- Data Resources
- AI Tools & Applications
4.631 million (2012)
12.88 million (2012)
8.113 million (2009)
5.192 million (2012)
.be
Financial InfrastructureBack to top ↑
- Currency & Reserves
- Payments & Settlement Systems
- Markets, Exchanges & Depositories
- Banks, Insurers & Systemic Institutions
Social InfrastructureBack to top ↑
- Health Infrastructure
- Public Health & Laboratories
- Medical Supply & Stockpiles
- Education & Skills Infrastructure
- Research & Scientific Facilities
- Housing, Community & Social Services
- Government & Public Administration
- Cultural, Community & Recreational Infrastructure
- Justice & Corrections
- Emergency Services & Civil Protection
- Hydrometeorology & Early Warning
Space, Aerospace & Defence InfrastructureBack to top ↑
GINC Capability Domains · Chapter 06
National Security
🇧🇪 Belgium’s force, intelligence and the defence of the nation
Disputes and terrorismBack to top ↑
none
Force Generation & MobilisationBack to top ↑
Belgian Armed Forces: Land Operations Command, Naval Operations Command, Air Operations Command (2012)
18 years of age for male and female voluntary military service; conscription abolished in 1994 (2012)
1.05% of GDP (2012)//1.08% of GDP (2011)//1.05% of GDP (2010)
Forces under arms
Active-duty strength on the Correlates of War series, which reaches back to 1816 and so carries a nation’s whole record of mobilisation rather than its present establishment. The card opens the full cross-country comparison.
Intelligence & AssessmentBack to top ↑
- Imagery & Geospatial Intelligence
- Signals & Cyber Intelligence
- Technical & Measurement Intelligence
- Open-Source & Financial Intelligence
- Human Intelligence & Counterintelligence
- All-Source Analysis & Warning
Joint Command, Projection & SustainmentBack to top ↑
- Command, Control & Communications
- Strategic Lift & Mobility
- Expeditionary & Peace Operations
- Operational Sustainment & War Reserves
- Defence Industrial Mobilisation
- CBRN Defence
Land PowerBack to top ↑
- Combined Arms Manoeuvre
- Land Fires
- Battlefield Aviation & Uncrewed Systems
- Special Operations & Irregular Warfare
Maritime PowerBack to top ↑
- Maritime Security & Constabulary
- Sea Denial & Undersea Warfare
- Sea Control
- Amphibious & Expeditionary Operations
Air PowerBack to top ↑
- Air Sovereignty & Policing
- Control of the Air
- Air Strike & Interdiction
- Airborne ISR, Early Warning & Battle Management
Strategic Strike & Missile DefenceBack to top ↑
Space OperationsBack to top ↑
Cyber & Electromagnetic OperationsBack to top ↑
Nuclear DeterrenceBack to top ↑
GINC Capability Domains · Chapter 07
Human Capital
🇧🇪 Belgium’s population, health and the skills that sustain capability
DemographyBack to top ↑
10,449,361 (July 2014 est.)
0.05% (2014 est.)
9.99 births/1,000 population (2014 est.)
10.76 deaths/1,000 population (2014 est.)
1.65 children born/woman (2014 est.)
28 (2010 est.)
70.4%
Migration and urbanisationBack to top ↑
1.22 migrant(s)/1,000 population (2014 est.)
BRUSSELS (capital) 1.949 million; Antwerp 959,000 (2011)
Welfare and equityBack to top ↑
15.2% (2007 est.)
28 (2005)//28.7 (1996)
DisplacementBack to top ↑
Early Childhood DevelopmentBack to top ↑
Foundational EducationBack to top ↑
6.6% of GDP (2010)
Advanced EducationBack to top ↑
Technical & Vocational SkillsBack to top ↑
Digital & AI CompetenceBack to top ↑
Generative AI adoption
Modelled share of working-age adults using generative AI, from Microsoft telemetry scaled to each country’s 15–64 population. A measure of how fast a workforce is absorbing the technology rather than of how much of it a nation builds. The card opens the full cross-country comparison.
Lifelong Learning & ReskillingBack to top ↑
Research Talent & Knowledge CreationBack to top ↑
Population HealthBack to top ↑
8 deaths/100,000 live births (2010)
22.1% (2008)
0.2% (2009 est.)
14,000 (2009 est.)
fewer than 100 (2009 est.)
Health System CapabilityBack to top ↑
10.6% of GDP (2011)
3.78 physicians/1,000 population (2010)
6.5 beds/1,000 population (2011)
GINC Capability Domains · Chapter 08
Governance and Integrity
🇧🇪 Belgium’s institutions, law and the integrity of the state
State structureBack to top ↑
federal parliamentary democracy under a constitutional monarchy
3 regions (French: regions, singular - region; Dutch: gewesten, singular - gewest); Brussels-Capital Region, also known as Brussels Hoofdstedelijk Gewest (Dutch), Region de Bruxelles-Capitale (French long form), Bruxelles-Capitale (French short form); Flemish Region (Flanders), also known as Vlaams Gewest (Dutch long form), Vlaanderen (Dutch short form), Region Flamande (French long form), Flandre (French short form); Walloon Region (Wallonia), also known as Region Wallone (French long form), Wallonie (French short form), Waals Gewest (Dutch long form), Wallonie (Dutch short form)
drafted 25 November 1830, approved 7 February 1831, entered into force 26 July 1831, revised 14 July 1993 (creating a federal state); amended many times, last in 2012 (2012)
18 years of age; universal and compulsory
Political Institutions & Civic ParticipationBack to top ↑
- Electoral Management & Integrity
- Legislature & Deliberative Institutions
- Citizen Participation & Civic Space
bicameral Parliament consists of a Senate or Senaat in Dutch, Senat in French (71 seats indirectly elected serve five-year terms) and a Chamber of Deputies or Kamer van Volksvertegenwoordigers in Dutch, Chambre des Representants in French (150 seats; members directly elected by popular vote on the basis of proportional representation to serve five-year terms)
Federation of Enterprises in Belgium [Pieter TIMMERMANS/Pierre Alain DE SMEDT]; Confederation of Christan Trade Unions [Luc CORTEBEECK/Claude ROLIN]; Belgian General Federation of Labor [Rudy DE LEEUW/Anne DEMELENNE]
Justice System & Fundamental RightsBack to top ↑
- Judicial Independence & Court Capability
- Access to Justice & Legal Services
- Fundamental Rights Protection
- Human Rights Institutions & Equality Bodies
civil law system based on the French Civil Code; note - Belgian law continues to be modified in conformance with the legislative norms mandated by the European Union; judicial review of legislative acts
accepts compulsory ICJ jurisdiction with reservations; accepts ICCt jurisdiction
Internal Security & OrderBack to top ↑
growing producer of synthetic drugs and cannabis; transit point for US-bound ecstasy; source of precursor chemicals for South American cocaine processors; transshipment point for cocaine, heroin, hashish, and marijuana entering Western Europe; despite a strengthening of legislation, the country remains vulnerable to money laundering related to narcotics, automobiles, alcohol, and tobacco; significant domestic consumption of ecstasy
Regulatory Governance & Strategic ControlsBack to top ↑
- Regulatory Quality & Better Regulation
- Regulatory Delivery & Independent Regulators
- Strategic Controls & Economic Security Administration
Government Effectiveness & Public AdministrationBack to top ↑
- Centre of Government & Policy Coordination
- Civil Service & Public Workforce
- Digital Government & Service Delivery
- Legal Identity & Civil Registration
- Statistical & Data Capability
Public Integrity & Anti-CorruptionBack to top ↑
Transparency, Oversight & AccountabilityBack to top ↑
- Right to Information & Open Government
- Independent Oversight & Supreme Audit
- Independent Media & Journalist Safety
National Resilience & Crisis ManagementBack to top ↑
GINC Capability Domains · Chapter 09
Information and Influence
🇧🇪 Belgium’s identity, media and the projection of influence
Identity and cultureBack to top ↑
Dutch (official) 60%, French (official) 40%, German (official) less than 1%, legally bilingual (Dutch and French)
Roman Catholic 75%, other (includes Protestant) 25%
Fleming 58%, Walloon 31%, mixed or other 11%
lion
three equal vertical bands of black (hoist side), yellow, and red; the vertical design was based on the flag of France; the colors are those of the arms of the duchy of Brabant (yellow lion with red claws and tongue on a black field)
Diplomatic Statecraft & Global NetworksBack to top ↑
- Diplomatic Network & Consular Reach
- Multilateral Leadership & Norm Setting
- Agenda-Setting & Convening
- Mediation & Crisis Diplomacy
ADB (nonregional members), AfDB (nonregional members), Australia Group, Benelux, BIS, CD, CE, CERN, EAPC, EBRD, ECB, EIB, EITI (implementing country), EMU, ESA, EU, FAO, FATF, G-9, G-10, IADB, IAEA, IBRD, ICAO, ICC (national committees), ICRM, IDA, IEA, IFAD, IFC, IFRCS, IGAD (partners), IHO, ILO, IMF, IMO, IMSO, Interpol, IOC, IOM, IPU, ISO, ITSO, ITU, ITUC (NGOs), MIGA, MONUSCO, NATO, NEA, NSG, OAS (observer), OECD, OIF, OPCW, OSCE, Paris Club, PCA, Schengen Convention, SELEC (observer), UN, UNCTAD, UNESCO, UNHCR, UNIDO, UNIFIL, UNRWA, UNTSO, UPU, WCO, WHO, WIPO, WMO, WTO, ZC
Alliances & Security CooperationBack to top ↑
Development Cooperation & Global AssistanceBack to top ↑
Culture, Language & Education DiplomacyBack to top ↑
- Cultural & Language Institutes
- Creative Industries & Cultural Export Reach
- Heritage & Cultural Institutions
- Education Diplomacy & Alumni Networks
- Sports & Major Events
Diaspora & Global CommunitiesBack to top ↑
Information Environment & Strategic CommunicationBack to top ↑
- Strategic Communications & Public Diplomacy
- International Media & Broadcasting
- Information Defence & Counter-Interference
a segmented market with the three major communities (Flemish, French, and German-speaking) each having responsibility for their own broadcast media; multiple TV channels exist for each community; additionally, in excess of 90% of households are connected to cable and can access broadcasts of TV stations from neighboring countries; each community has a public radio network co-existing with private broadcasters (2007)
GINC Capability Domains · Chapter 10
Financial Strength
🇧🇪 Belgium’s fiscal depth, reserves and the capacity to act
Monetary & Currency CapabilityBack to top ↑
- Monetary Policy & Price Stability
- Exchange Rate & External Account Management
- Currency Issuance & Digital Money
1.3% (2013 est.)//2.6% (2012 est.)
euros (EUR) per US dollar -//0.7634 (2013 est.)//0.7752 (2012 est.)//0.755 (2010 est.)//0.7198 (2009 est.)//0.6827 (2008 est.)
0.75% (31 December 2013)//1.5% (31 December 2010)
3.5% (31 December 2013 est.)//3.62% (31 December 2012 est.)
$185.1 billion (31 December 2013 est.)//$185.7 billion (31 December 2012 est.)
$591.7 billion (31 December 2013 est.)//$585 billion (31 December 2012 est.)
Fiscal Capacity & Public FinanceBack to top ↑
- Revenue Mobilisation & Tax Administration
- Public Expenditure & Budget Management
- Sovereign Debt & Treasury Management
- Public Investment Management
47.7% of GDP (2013 est.)
-3.2% of GDP (2013 est.)
102.4% of GDP (2013 est.)//99.6% of GDP (2012 est.)
calendar year
Financial System Depth & AccessBack to top ↑
- Banking System Capacity
- Capital Markets Depth & Development
- Long-Term & Institutional Capital
- Financial Inclusion & Household Access
- Development & Policy Finance
$581.4 billion (31 December 2013 est.)//$574.8 billion (31 December 2012 est.)
$NA (31 December 2012 est.)//$NA (31 December 2011)//$269.3 billion (31 December 2010 est.)
19.2% of GDP (2013 est.)//19.6% of GDP (2012 est.)//20.8% of GDP (2011 est.)
Financial Regulation & IntegrityBack to top ↑
- Prudential Regulation & Supervision
- Financial Integrity & Illicit Finance Control
- Market Conduct & Consumer Protection
- Payment & Market Infrastructure Oversight
Financial Stability & Crisis ManagementBack to top ↑
- Macroprudential & Systemic Oversight
- Crisis Management, Resolution & Deposit Insurance
- External Liquidity & Financial Safety Nets
Sovereign Capital & External Financial PowerBack to top ↑
- Official Reserves Management
- Sovereign Wealth & Public Asset Management
- Currency Internationalisation & Reserve Status
- Capital Account & Flow Management
- International Financial Centre Capability
$30.77 billion (31 December 2012 est.)//$29.43 billion (31 December 2011 est.)
$1.424 trillion (31 December 2012 est.)//$1.417 trillion (31 December 2011)
GINC Capability Domains · Chapter 11
Production and Innovation
🇧🇪 Belgium’s output, industry and the engine of prosperity
Economic Output & ProductivityBack to top ↑
This modern, open, and private-enterprise-based economy has capitalized on its central geographic location, highly developed transport network, and diversified industrial and commercial base. Industry is concentrated mainly in the more heavily-populated region of Flanders in the north. With few natural resources, Belgium imports substantial quantities of raw materials and exports a large volume of manufactures, making its economy vulnerable to volatility in world markets. Roughly three-quarters of Belgium's trade is with other EU countries, and Belgium has benefited most from its proximity to Germany. In 2013 Belgian GDP grew by 0.1%, the unemployment rate increased to 8.8% from 7.6% the previous year, and the government reduced the budget deficit from a peak of 6% of GDP in 2009 to 3.2%. Despite the relative improvement in Belgium's budget deficit, public debt hovers around 100% of GDP, a factor that has contributed to investor perceptions that the country is increasingly vulnerable to spillover from the euro-zone crisis. Belgian banks were severely affected by the international financial crisis in 2008 with three major banks receiving capital injections from the government, and the nationalization of the Belgian retail arm of a Franco-Belgian bank.
$421.7 billion (2013 est.)//$421.3 billion (2012 est.)//$422.5 billion (2011 est.)
0.1% (2013 est.)//-0.3% (2012 est.)//1.8% (2011 est.)
$37,800 (2013 est.)//$38,000 (2012 est.)//$38,400 (2011 est.)
$507.4 billion (2013 est.)
Labour & EmploymentBack to top ↑
- Employment & Labour Force Participation
- Labour Market Institutions & Wage Setting
- Employment Services & Skills Matching
- Labour Adjustment, Transition & Formalisation
5.15 million (2013 est.)
8.8% (2013 est.)//7.6% (2012 est.)
Industrial & Sectoral BaseBack to top ↑
- Manufacturing & Advanced Industry
- Foundational & Process Industries
- Agrifood & Primary Production
- Services Economy
sugar beets, fresh vegetables, fruits, grain, tobacco; beef, veal, pork, milk
engineering and metal products, motor vehicle assembly, transportation equipment, scientific instruments, processed food and beverages, chemicals, base metals, textiles, glass, petroleum
0.2% (2013 est.)
Structural Transformation & ComplexityBack to top ↑
Business Dynamism & EntrepreneurshipBack to top ↑
- Entrepreneurship & Firm Creation
- Risk Capital & Scale-Up Finance
- Firm Growth, Exit & Renewal
- Competition & Market Contestability
Innovation & CommercialisationBack to top ↑
- Business Innovation Capability
- Research Commercialisation & Knowledge Transfer
- Intellectual Property & Intangible Assets
- Innovation Ecosystems & Clusters
Technology Adoption & DiffusionBack to top ↑
GINC Capability Domains · Chapter 12
Trade and Investment
🇧🇪 Belgium’s markets, capital and the terms of global exchange
Overall tradeBack to top ↑
$387B of exports to 221 partners and $389B of imports from 223 in 2024, a deficit of $1.26B.
- Exports
- $387B221 partners
- Imports
- $389B223 partners
- Balance
- −$1.26Bdeficit
- Total trade
- $776B2024
ExportsBack to top ↑
Where its exports go
The largest partners in 2024, with each one's share of the nation's exports.
| Partner | Value | Share | |
|---|---|---|---|
| Netherlands | $59.7B | 15% | |
| France | $57.3B | 15% | |
| Germany | $52.2B | 13% | |
| United States | $26.6B | 6.9% | |
| Italy | $25.9B | 6.7% | |
| United Kingdom | $18.6B | 4.8% | |
| Spain | $10.4B | 2.7% | |
| Poland | $8.52B | 2.2% | |
| Sweden | $8.45B | 2.2% | |
| China | $6.48B | 1.7% | |
| Luxembourg | $6.25B | 1.6% | |
| Nigeria | $4.52B | 1.2% | |
| Switzerland | $4.18B | 1.1% | |
| Turkey | $4.13B | 1.1% | |
| Denmark | $4.02B | 1.0% | |
| India | $3.97B | 1.0% | |
| Czech Republic | $3.63B | 0.9% | |
| Japan | $3.54B | 0.9% | |
| Portugal | $3.47B | 0.9% | |
| Norway | $3.38B | 0.9% |
What it exports
The largest categories in 2024.
| Category | Value | Share | |
|---|---|---|---|
| Mineral fuels, oils, distillation products | $61.3B | 16% | |
| Pharmaceutical products | $52.2B | 13% | |
| Vehicles other than railway, tramway | $30.9B | 8.0% | |
| Plastics | $24.8B | 6.4% | |
| Machinery, nuclear reactors, boilers | $21.8B | 5.6% | |
| Organic chemicals | $16.5B | 4.3% | |
| Pearls, precious stones, metals, coins | $15.2B | 3.9% | |
| Iron and steel | $14.7B | 3.8% | |
| Electrical, electronic equipment | $11.8B | 3.1% | |
| Miscellaneous chemical products | $9.44B | 2.4% | |
| Optical, photo, technical, medical apparatus | $7.21B | 1.9% | |
| Vegetable, fruit, nut food preparations | $6.03B | 1.6% | |
| Cocoa and cocoa preparations | $5.63B | 1.5% | |
| Dairy products, eggs, honey, edible products | $5.10B | 1.3% | |
| Cereal, flour, starch, milk preparations and products | $4.97B | 1.3% |
ImportsBack to top ↑
Where its imports come from
The largest partners in 2024, with each one's share of the nation's imports.
| Partner | Value | Share | |
|---|---|---|---|
| Netherlands | $85.4B | 22% | |
| Germany | $51.5B | 13% | |
| France | $46.1B | 12% | |
| United States | $23.2B | 6.0% | |
| Italy | $17.6B | 4.5% | |
| China | $14.4B | 3.7% | |
| United Kingdom | $11.9B | 3.1% | |
| Ireland | $10.7B | 2.7% | |
| Spain | $10.1B | 2.6% | |
| Switzerland | $8.90B | 2.3% | |
| Japan | $8.33B | 2.1% | |
| Sweden | $8.26B | 2.1% | |
| Norway | $7.74B | 2.0% | |
| Poland | $6.70B | 1.7% | |
| Czech Republic | $5.03B | 1.3% | |
| India | $4.16B | 1.1% | |
| Turkey | $3.75B | 1.0% | |
| South Korea | $2.97B | 0.8% | |
| Austria | $2.90B | 0.7% | |
| Hungary | $2.73B | 0.7% |
What it imports
The largest categories in 2024.
| Category | Value | Share | |
|---|---|---|---|
| Mineral fuels, oils, distillation products | $61.1B | 16% | |
| Vehicles other than railway, tramway | $45.7B | 12% | |
| Pharmaceutical products | $44.4B | 11% | |
| Machinery, nuclear reactors, boilers | $30.3B | 7.8% | |
| Electrical, electronic equipment | $22.8B | 5.9% | |
| Organic chemicals | $15.8B | 4.1% | |
| Plastics | $14.9B | 3.8% | |
| Optical, photo, technical, medical apparatus | $11.8B | 3.0% | |
| Pearls, precious stones, metals, coins | $9.56B | 2.5% | |
| Iron and steel | $9.32B | 2.4% | |
| Miscellaneous chemical products | $5.89B | 1.5% | |
| Articles of iron or steel | $4.96B | 1.3% | |
| Dairy products, eggs, honey, edible products | $4.87B | 1.3% | |
| Copper | $4.84B | 1.2% | |
| Cocoa and cocoa preparations | $4.63B | 1.2% |
In a list, the bar runs to the largest in that list. The line is each figure’s history from 2000, drawn to its own peak: it shows the shape of the years, and the value shows the size.
External balanceBack to top ↑
-$9.1 billion (2013 est.)//-$6.65 billion (2012 est.)
Trade Facilitation & LogisticsBack to top ↑
Trade Policy & Market AccessBack to top ↑
- Trade Policy & Negotiation Capability
- Market Access & Agreements Network
- Trade Law & Enforcement
- Standards, Conformity & Quality Infrastructure
Digital & Services TradeBack to top ↑
- Services Trade Capability
- Digital Trade & E-Commerce
- Data Flows & Digital Trade Governance
- Tourism & Visitor Economy
Investment Attraction & ProjectionBack to top ↑
- Investment Attraction & Facilitation
- Investment Absorption & Linkages
- Outward Investment & Global Corporate Presence
$1.195 trillion (31 December 2013 est.)//$1.159 trillion (31 December 2012 est.)
$1.215 trillion (31 December 2013 est.)//$1.185 trillion (31 December 2012 est.)
Export Capability & SophisticationBack to top ↑
$295.3 billion (2013 est.)//$302.4 billion (2012 est.)
Germany 18%, France 16.1%, Netherlands 13%, UK 7.3%, US 5.3%, Italy 4.4% (2012)
machinery and equipment, chemicals, finished diamonds, metals and metal products, foodstuffs
Global Value Chain PositionBack to top ↑
- Value Chain Participation & Integration
- Value Chain Position & Upgrading
- Regional Integration & Hub Anchoring
Economic Leverage & DependenceBack to top ↑
- Strategic Supply Security
- Concentration Risk & Revenue Stabilisation
- Economic Leverage & Coercion Resistance
$310.2 billion (2013 est.)//$311.1 billion (2012 est.)
Netherlands 20.9%, Germany 14.2%, France 10.6%, US 6.1%, UK 5.5%, Ireland 4.4% (2012)
raw materials, machinery and equipment, chemicals, raw diamonds, pharmaceuticals, foodstuffs, transportation equipment, oil products
Belgium · you are in
Historical Context
Foundations
GINC Capability Domains
Find in this brief · Belgium