
Slovenia
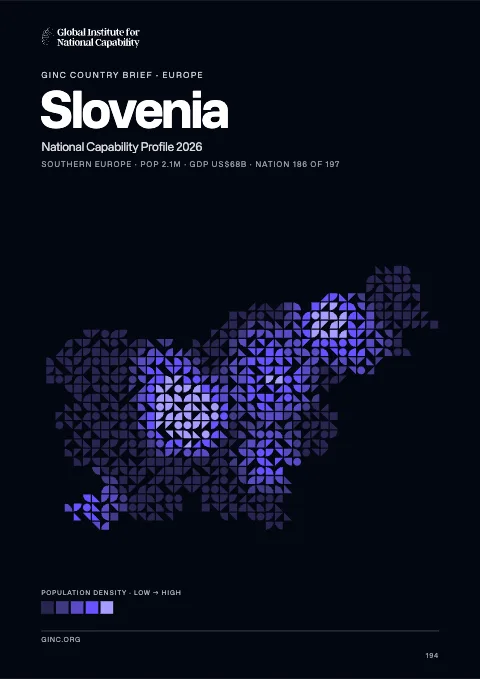
Slovenia is a parliamentary republic in Europe, home to 2.0 million people, with its capital at Ljubljana.
Contents
12 chapters
Foundations
01–03
At a glance
- Area
- 20.3Kkm²#154 World#35 Europe
- Population
- 2M#147 World#32 Europe
- GDP (market)
- $46.8B
- GDP (PPP)
- $57.4B#92 World#27 Europe
- GDP per capita
- $27.4K#54 World#25 Europe
The whole brief
Slovenia National Capability Profile 2026
Foundations · Chapter 01
Historical Context
🇸🇮 Slovenia’s understanding the origins and evolution of the modern nation
BackgroundBack to top ↑
The Slovene lands were part of the Austro-Hungarian Empire until the latter's dissolution at the end of World War I. In 1918, the Slovenes joined the Serbs and Croats in forming a new multinational state, which was named Yugoslavia in 1929. After World War II, Slovenia became a republic of the renewed Yugoslavia, which though communist, distanced itself from Moscow's rule. Dissatisfied with the exercise of power by the majority Serbs, the Slovenes succeeded in establishing their independence in 1991 after a short 10-day war. Historical ties to Western Europe, a strong economy, and a stable democracy have assisted in Slovenia's transformation to a modern state. Slovenia acceded to both NATO and the EU in the spring of 2004; it joined the eurozone in 2007.
IndependenceBack to top ↑
25 June 1991 (from Yugoslavia)
National holidayBack to top ↑
Independence Day/Statehood Day, 25 June (1991)
Foundations · Chapter 02
Geography
🇸🇮 Slovenia’s territory, resources and strategic position
Location and areaBack to top ↑
south Central Europe, Julian Alps between Austria and Croatia
46 07 N, 14 49 E
Europe
slightly smaller than New Jersey
46.6 km
Terrain and resourcesBack to top ↑
a short coastal strip on the Adriatic, an alpine mountain region adjacent to Italy and Austria, mixed mountains and valleys with numerous rivers to the east
lignite coal, lead, zinc, building stone, hydropower, forests
76.04 sq km (2010)
Settlement and hazardsBack to top ↑
flooding; earthquakes
despite its small size, this eastern Alpine country controls some of Europe's major transit routes
OtherBack to top ↑
31.87 cu km (2011)
Sava River polluted with domestic and industrial waste; pollution of coastal waters with heavy metals and toxic chemicals; forest damage near Koper from air pollution (originating at metallurgical and chemical plants) and resulting acid rain
Foundations · Chapter 03
Environment
🇸🇮 Slovenia’s environmental conditions, resources and national resilience
ClimateBack to top ↑
Mediterranean climate on the coast, continental climate with mild to hot summers and cold winters in the plateaus and valleys to the east
Emissions and pollutionBack to top ↑
Water, waste and foodBack to top ↑
Resources and agreementsBack to top ↑
GINC Capability Domains · Chapter 04
Critical Technology
🇸🇮 Slovenia’s technology frontiers and the pursuit of national advantage
Two counts are set side by side for 2015–2024: on the left, the papers researchers in Slovenia published; on the right, the patent families that began there and were filed in more than one country. First by capability group, then group by group with each group’s capabilities. The badge on a card is the nation’s place among all nations. Papers are from GINC Research Analytics, patent families from GINC Patents.
Research by capability group
#63 WorldPapers published, 2015–2024
909
562
323
311
272
115
86
73
51
7
Patents by capability group
#47 WorldInternational patent families, 2015–2024
Advanced Materials & ManufacturingBack to top ↑
Research
#52 WorldPapers published, 2015–2024
Patents
#42 WorldInternational patent families, 2015–2024
Energy TechnologiesBack to top ↑
Research
#56 WorldPapers published, 2015–2024
Patents
#47 WorldInternational patent families, 2015–2024
Semiconductors & Advanced ComputingBack to top ↑
Research
#60 WorldPapers published, 2015–2024
No research topic: Semiconductor Design & EDA · Advanced Semiconductor Fabrication · Semiconductor Equipment & Materials · Advanced Packaging & Heterogeneous Integration
Patents
#44 WorldInternational patent families, 2015–2024
Artificial IntelligenceBack to top ↑
Research
#72 WorldPapers published, 2015–2024
Patents
#66 WorldInternational patent families, 2015–2024
Quantum TechnologiesBack to top ↑
Research
#70 WorldPapers published, 2015–2024
Patents
#36 WorldInternational patent families, 2015–2024
Connectivity, Cyber & Trust TechnologiesBack to top ↑
Research
#80 WorldPapers published, 2015–2024
Patents
#56 WorldInternational patent families, 2015–2024
Sensing, Timing & NavigationBack to top ↑
Research
#66 WorldPapers published, 2015–2024
Patents
#44 WorldInternational patent families, 2015–2024
Robotics & Autonomous SystemsBack to top ↑
Research
#63 WorldPapers published, 2015–2024
No research topic: Human-Machine Interfaces
Patents
#52 WorldInternational patent families, 2015–2024
Biotechnology & Health TechnologiesBack to top ↑
Research
#66 WorldPapers published, 2015–2024
Patents
#39 WorldInternational patent families, 2015–2024
Medicine and BioTech
Clinical research and life-science invention, drawn from the same series that drive the metric pages. Each card opens the full cross-country comparison.
Space TechnologiesBack to top ↑
Research
#55 WorldPapers published, 2015–2024
Patents
#44 WorldInternational patent families, 2015–2024
GINC Capability Domains · Chapter 05
Strategic Infrastructure
🇸🇮 Slovenia’s energy, connectivity and the material foundations of capability
Resource InfrastructureBack to top ↑
305 bbl/day (2012 est.)
0 bbl/day (2010 est.)
0 bbl/day (2010 est.)
0 bbl (1 January 2013 est.)
0 bbl/day (2010 est.)
52,930 bbl/day (2011 est.)
14,210 bbl/day (2010 est.)
68,320 bbl/day (2010 est.)
2 million cu m (2012 est.)
680 million cu m (2012 est.)
1.181 billion cu m (2012 est.)
870 million cu m (2012 est.)
NA cu m (1 January 2013 est.)
gas 844 km; oil 5 km (2013)
Agriculture & Food InfrastructureBack to top ↑
- Irrigation & Agricultural Water
- Livestock & Veterinary
- Fisheries & Aquaculture
- Storage, Cold Chain & Markets
Energy InfrastructureBack to top ↑
- Thermal Generation
- Nuclear Generation
- Nuclear Fuel Cycle & Radioactive Waste
- Hydropower
- Renewable Generation
- Transmission & Distribution
- System Control & Dispatch
- Storage & Fuel Supply
3.351 million kW (2012 est.)
15.73 billion kWh (2012 est.)
12.66 billion kWh (2012 est.)
8.363 billion kWh (2012 est.)
7.452 billion kWh (2012 est.)
36.6% of total installed capacity (2012 est.)
20.5% of total installed capacity (2012 est.)
37.4% of total installed capacity (2012 est.)
5.5% of total installed capacity (2012 est.)
19.51 million Mt (2011 est.)
Water, Sanitation & Waste InfrastructureBack to top ↑
- Dams, Reservoirs & Flood Defence
- Water Supply & Treatment
- Bulk Water Transfer & Desalination
- Wastewater & Sanitation
- Solid Waste & Recycling
Advanced ManufacturingBack to top ↑
- Materials & Inputs
- Chemicals & Hazardous Process Industry
- Production Systems
- Supply Chain & Ecosystem
- Workforce & Innovation
Transport InfrastructureBack to top ↑
- Seaports & Terminals
- Air Infrastructure
- Air Navigation & Traffic Management
- Inland Waterways & Ferries
- Rail Infrastructure
- Roads & Bridges
- Logistics, Multimodal & Border Infrastructure
- Postal & Parcel
16 (2013)
(there is some transport on the Drava River) (2012)
Communications & Digital InfrastructureBack to top ↑
- Subsea Cables & International Gateways
- Core & Backbone Networks
- Mobile & Wireless Networks
- Spectrum & Broadcasting
- Data Centres, Compute & Cloud
- Data Resources
- AI Tools & Applications
825,000 (8012)
2.246 million (2012)
1.298 million (2009)
415,581 (2012)
.si
Financial InfrastructureBack to top ↑
- Currency & Reserves
- Payments & Settlement Systems
- Markets, Exchanges & Depositories
- Banks, Insurers & Systemic Institutions
Social InfrastructureBack to top ↑
- Health Infrastructure
- Public Health & Laboratories
- Medical Supply & Stockpiles
- Education & Skills Infrastructure
- Research & Scientific Facilities
- Housing, Community & Social Services
- Government & Public Administration
- Cultural, Community & Recreational Infrastructure
- Justice & Corrections
- Emergency Services & Civil Protection
- Hydrometeorology & Early Warning
Space, Aerospace & Defence InfrastructureBack to top ↑
GINC Capability Domains · Chapter 06
National Security
🇸🇮 Slovenia’s force, intelligence and the defence of the nation
Disputes and terrorismBack to top ↑
since the breakup of Yugoslavia in the early 1990s, Croatia and Slovenia have each claimed sovereignty over Pirin Bay and four villages, and Slovenia has objected to Croatia's claim of an exclusive economic zone in the Adriatic Sea; in 2009, however Croatia and Slovenia signed a binding international arbitration agreement to define their disputed land and maritime borders, which led to Slovenia lifting its objections to Croatia joining the EU; as a member state that forms part of the EU's external border, Slovenia has implemented the strict Schengen border rules to curb illegal migration and commerce through southeastern Europe while encouraging close cross-border ties with Croatia; Slovenia continues to impose a hard border Schengen regime with Croatia, which joined the EU in 2013 but has not yet fulfilled Schengen requirements
Force Generation & MobilisationBack to top ↑
Slovenian Armed Forces (Slovenska Vojska, SV): Forces Command (with ground units, naval element, air and air defense brigade); Administration for Civil Protection and Disaster Relief (ACPDR) (2013)
18-25 years of age for voluntary military service; conscription abolished in 2003 (2012)
1.18% of GDP (2012)//1.32% of GDP (2011)//1.18% of GDP (2010)
Forces under arms
Active-duty strength on the Correlates of War series, which reaches back to 1816 and so carries a nation’s whole record of mobilisation rather than its present establishment. The card opens the full cross-country comparison.
Intelligence & AssessmentBack to top ↑
- Imagery & Geospatial Intelligence
- Signals & Cyber Intelligence
- Technical & Measurement Intelligence
- Open-Source & Financial Intelligence
- Human Intelligence & Counterintelligence
- All-Source Analysis & Warning
Joint Command, Projection & SustainmentBack to top ↑
- Command, Control & Communications
- Strategic Lift & Mobility
- Expeditionary & Peace Operations
- Operational Sustainment & War Reserves
- Defence Industrial Mobilisation
- CBRN Defence
Land PowerBack to top ↑
- Combined Arms Manoeuvre
- Land Fires
- Battlefield Aviation & Uncrewed Systems
- Special Operations & Irregular Warfare
Maritime PowerBack to top ↑
- Maritime Security & Constabulary
- Sea Denial & Undersea Warfare
- Sea Control
- Amphibious & Expeditionary Operations
Air PowerBack to top ↑
- Air Sovereignty & Policing
- Control of the Air
- Air Strike & Interdiction
- Airborne ISR, Early Warning & Battle Management
Strategic Strike & Missile DefenceBack to top ↑
Space OperationsBack to top ↑
Cyber & Electromagnetic OperationsBack to top ↑
Nuclear DeterrenceBack to top ↑
GINC Capability Domains · Chapter 07
Human Capital
🇸🇮 Slovenia’s population, health and the skills that sustain capability
DemographyBack to top ↑
1,988,292 (July 2014 est.)
-0.23% (2014 est.)
8.54 births/1,000 population (2014 est.)
11.25 deaths/1,000 population (2014 est.)
1.33 children born/woman (2014 est.)
28.8 (2011 est.)
Migration and urbanisationBack to top ↑
0.37 migrant(s)/1,000 population (2014 est.)
LJUBLJANA (capital) 273,000 (2011)
Welfare and equityBack to top ↑
13.5% (2012)
23.7 (2012)//23.8 (2005)
Early Childhood DevelopmentBack to top ↑
Foundational EducationBack to top ↑
5.7% of GDP (2010)
Advanced EducationBack to top ↑
Technical & Vocational SkillsBack to top ↑
Digital & AI CompetenceBack to top ↑
Generative AI adoption
Modelled share of working-age adults using generative AI, from Microsoft telemetry scaled to each country’s 15–64 population. A measure of how fast a workforce is absorbing the technology rather than of how much of it a nation builds. The card opens the full cross-country comparison.
Lifelong Learning & ReskillingBack to top ↑
Research Talent & Knowledge CreationBack to top ↑
Population HealthBack to top ↑
12 deaths/100,000 live births (2010)
28.6% (2008)
less than 0.1% (2009 est.)
fewer than 1,000 (2009 est.)
fewer than 100 (2009 est.)
Health System CapabilityBack to top ↑
9% of GDP (2010)
2.54 physicians/1,000 population (2010)
4.6 beds/1,000 population (2010)
GINC Capability Domains · Chapter 08
Governance and Integrity
🇸🇮 Slovenia’s institutions, law and the integrity of the state
State structureBack to top ↑
parliamentary republic
200 municipalities (obcine, singular - obcina) and 11 urban municipalities (mestne obcine, singular - mestna obcina)
previous 1974 (preindependence); latest passed by legislature 23 December 1991; amended several times, last in 2013 (2013)
18 years of age, 16 if employed; universal
Political Institutions & Civic ParticipationBack to top ↑
- Electoral Management & Integrity
- Legislature & Deliberative Institutions
- Citizen Participation & Civic Space
bicameral Parliament consists of a National Council or Drzavni Svet (40 seats; members indirectly elected by an electoral college to serve five-year terms; note - this is primarily an advisory body with limited legislative powers; it may propose laws, ask to review any National Assembly decision, and call national referenda) and the National Assembly or Drzavni Zbor (90 seats; 88 members are elected on a proportional basis and 2 are elected by the Italian and Hungarian minorities through a majoritarian, preferential system; members elected by popular vote to serve four-year terms)
Civic List or DL [Gregor VIRANT] (formerly LGV)//Democratic Party of Pensioners of Slovenia or DeSUS [Karl ERJAVEC]//New Slovenia or NSi [Ljudmila NOVAK]//Positive Slovenia or PS [Alenka BRATUSEK (interim)]//Slovene People's Party or SLS [Radovan ZERJAV]//Slovenian Democratic Party or SDS [Janez JANSA]//Social Democrats or SD [Igor LUKSIC] (formerly ZLSD)
Slovenian Roma Association [Jozek Horvat MUC]; various trade and public sector employee unions//
Justice System & Fundamental RightsBack to top ↑
- Judicial Independence & Court Capability
- Access to Justice & Legal Services
- Fundamental Rights Protection
- Human Rights Institutions & Equality Bodies
civil law system
has not submitted an ICJ jurisdiction declaration; accepts ICCt jurisdiction
Internal Security & OrderBack to top ↑
minor transit point for cocaine and Southwest Asian heroin bound for Western Europe, and for precursor chemicals
Regulatory Governance & Strategic ControlsBack to top ↑
- Regulatory Quality & Better Regulation
- Regulatory Delivery & Independent Regulators
- Strategic Controls & Economic Security Administration
Government Effectiveness & Public AdministrationBack to top ↑
- Centre of Government & Policy Coordination
- Civil Service & Public Workforce
- Digital Government & Service Delivery
- Legal Identity & Civil Registration
- Statistical & Data Capability
Public Integrity & Anti-CorruptionBack to top ↑
Transparency, Oversight & AccountabilityBack to top ↑
- Right to Information & Open Government
- Independent Oversight & Supreme Audit
- Independent Media & Journalist Safety
National Resilience & Crisis ManagementBack to top ↑
GINC Capability Domains · Chapter 09
Information and Influence
🇸🇮 Slovenia’s identity, media and the projection of influence
Identity and cultureBack to top ↑
Slovenian (official) 91.1%, Serbo-Croatian 4.5%, other or unspecified 4.4%, Italian (official, only in municipalities where Italian national communities reside), Hungarian (official, only in municipalities where Hungarian national communities reside) (2002 census)
Catholic 57.8%, Muslim 2.4%, Orthodox 2.3%, other Christian 0.9%, unaffiliated 3.5%, other or unspecified 23%, none 10.1% (2002 census)
Slovene 83.1%, Serb 2%, Croat 1.8%, Bosniak 1.1%, other or unspecified 12% (2002 census)
Mount Triglav
three equal horizontal bands of white (top), blue, and red, derive from the medieval coat of arms of the Duchy of Carniola; the Slovenian seal (a shield with the image of Triglav, Slovenia's highest peak, in white against a blue background at the center; beneath it are two wavy blue lines depicting seas and rivers, and above it are three six-pointed stars arranged in an inverted triangle, which are taken from the coat of arms of the Counts of Celje, the great Slovene dynastic house of the late 14th and early 15th centuries) appears in the upper hoist side of the flag centered on the white and blue bands
Diplomatic Statecraft & Global NetworksBack to top ↑
- Diplomatic Network & Consular Reach
- Multilateral Leadership & Norm Setting
- Agenda-Setting & Convening
- Mediation & Crisis Diplomacy
Australia Group, BIS, CD, CE, CEI, EAPC, EBRD, ECB, EIB, EMU, ESA (cooperating state), EU, FAO, IADB, IAEA, IBRD, ICAO, ICC (national committees), ICRM, IDA, IFC, IFRCS, IHO, ILO, IMF, IMO, Interpol, IOC, IOM, IPU, ISO, ITU, MIGA, NATO, NEA, NSG, OAS (observer), OECD, OIF (observer), OPCW, OSCE, PCA, Schengen Convention, SELEC, UN, UNCTAD, UNESCO, UNHCR, UNIDO, UNIFIL, UNTSO, UNWTO, UPU, WCO, WHO, WIPO, WMO, WTO, ZC
Alliances & Security CooperationBack to top ↑
Development Cooperation & Global AssistanceBack to top ↑
Culture, Language & Education DiplomacyBack to top ↑
- Cultural & Language Institutes
- Creative Industries & Cultural Export Reach
- Heritage & Cultural Institutions
- Education Diplomacy & Alumni Networks
- Sports & Major Events
Diaspora & Global CommunitiesBack to top ↑
Information Environment & Strategic CommunicationBack to top ↑
- Strategic Communications & Public Diplomacy
- International Media & Broadcasting
- Information Defence & Counter-Interference
public TV broadcaster, Radiotelevizija Slovenija (RTV), operates a system of national and regional TV stations; 35 domestic commercial TV stations operating nationally, regionally, and locally; about 60% of households are connected to multi-channel cable TV; public radio broadcaster operates 3 national and 4 regional stations; more than 75 regional and local commercial and non-commercial radio stations (2007)
GINC Capability Domains · Chapter 10
Financial Strength
🇸🇮 Slovenia’s fiscal depth, reserves and the capacity to act
Monetary & Currency CapabilityBack to top ↑
- Monetary Policy & Price Stability
- Exchange Rate & External Account Management
- Currency Issuance & Digital Money
1.8% (2013 est.)//2.7% (2012 est.)
euros (EUR) per US dollar -//0.7634 (2013 est.)//0.7752 (2012 est.)//0.755 (2010 est.)//0.7198 (2009 est.)//0.6827 (2008 est.)
0.75% (31 December 2013)//1.5% (31 December 2012)
5.7% (31 December 2013 est.)//5.7% (31 December 2012 est.)
$11.85 billion (31 December 2013 est.)//$11.39 billion (31 December 2012 est.)
$25.4 billion (31 December 2013 est.)//$24.88 billion (31 December 2012 est.)
Fiscal Capacity & Public FinanceBack to top ↑
- Revenue Mobilisation & Tax Administration
- Public Expenditure & Budget Management
- Sovereign Debt & Treasury Management
- Public Investment Management
41.8% of GDP (2013 est.)
-4.4% of GDP (2013 est.)
71.7% of GDP (2013 est.)//54.4% of GDP (2012 est.)
calendar year
Financial System Depth & AccessBack to top ↑
- Banking System Capacity
- Capital Markets Depth & Development
- Long-Term & Institutional Capital
- Financial Inclusion & Household Access
- Development & Policy Finance
$42.76 billion (31 December 2013 est.)//$45.1 billion (31 December 2012 est.)
$6.87 billion (31 December 2013 est.)//$6.31 billion (31 December 2012)//$6.783 billion (31 December 2011 est.)
22.4% of GDP (2013 est.)//20.6% of GDP (2012 est.)//20.4% of GDP (2011 est.)
Financial Regulation & IntegrityBack to top ↑
- Prudential Regulation & Supervision
- Financial Integrity & Illicit Finance Control
- Market Conduct & Consumer Protection
- Payment & Market Infrastructure Oversight
Financial Stability & Crisis ManagementBack to top ↑
- Macroprudential & Systemic Oversight
- Crisis Management, Resolution & Deposit Insurance
- External Liquidity & Financial Safety Nets
Sovereign Capital & External Financial PowerBack to top ↑
- Official Reserves Management
- Sovereign Wealth & Public Asset Management
- Currency Internationalisation & Reserve Status
- Capital Account & Flow Management
- International Financial Centre Capability
$889 million (31. December 2013 est.)//$927.6 million (31 December 2012 est.)
$52.53 billion (31 December 2013 est.)//$52.48 billion (31 December 2012)
GINC Capability Domains · Chapter 11
Production and Innovation
🇸🇮 Slovenia’s output, industry and the engine of prosperity
Economic Output & ProductivityBack to top ↑
With excellent infrastructure, a well-educated work force, and a strategic location between the Balkans and Western Europe, Slovenia has one of the highest per capita GDPs in Central Europe. Slovenia became the first 2004 European Union entrant to adopt the euro (on 1 January 2007) and has experienced one of the most stable political transitions in Central and Southeastern Europe. In March 2004, Slovenia became the first transition country to graduate from borrower status to donor partner at the World Bank. In 2007, Slovenia was invited to begin the process for joining the OECD; it became a member in 2012. However, long-delayed privatizations, particularly within Slovenia’s largely state-owned and increasingly indebted banking sector, have fueled investor concerns since 2012 that the country would need EU-IMF financial assistance. In 2013, the European Commission granted Slovenia permission to begin recapitalizing ailing lenders and transferring their nonperforming assets into a “bad bank” established to restore bank balance sheets. Yield-seeking bond investors’ strong demand for Slovenian debt helped the government in 2013 to continue to finance itself independently on international markets. The government has embarked on a program of state asset sales intended to bolster investor confidence in the economy, which in 2014 is poised to contract 1%, its third-year of recession.
$57.36 billion (2013 est.)//$58.03 billion (2012 est.)//$59.52 billion (2011 est.)
-1.1% (2013 est.)//-2.5% (2012 est.)//0.7% (2011 est.)
$27,400 (2013 est.)//$28,200 (2012 est.)//$29,000 (2011 est.)
$46.82 billion (2013 est.)
Labour & EmploymentBack to top ↑
- Employment & Labour Force Participation
- Labour Market Institutions & Wage Setting
- Employment Services & Skills Matching
- Labour Adjustment, Transition & Formalisation
913,400 (2013 est.)
13.1% (2013 est.)//12% (2012 est.)
Industrial & Sectoral BaseBack to top ↑
- Manufacturing & Advanced Industry
- Foundational & Process Industries
- Agrifood & Primary Production
- Services Economy
potatoes, hops, wheat, sugar beets, corn, grapes; cattle, sheep, poultry
ferrous metallurgy and aluminum products, lead and zinc smelting; electronics (including military electronics), trucks, automobiles, electric power equipment, wood products, textiles, chemicals, machine tools
-0.6% (2013 est.)
Structural Transformation & ComplexityBack to top ↑
Business Dynamism & EntrepreneurshipBack to top ↑
- Entrepreneurship & Firm Creation
- Risk Capital & Scale-Up Finance
- Firm Growth, Exit & Renewal
- Competition & Market Contestability
Innovation & CommercialisationBack to top ↑
- Business Innovation Capability
- Research Commercialisation & Knowledge Transfer
- Intellectual Property & Intangible Assets
- Innovation Ecosystems & Clusters
Technology Adoption & DiffusionBack to top ↑
GINC Capability Domains · Chapter 12
Trade and Investment
🇸🇮 Slovenia’s markets, capital and the terms of global exchange
Overall tradeBack to top ↑
$66.3B of exports to 195 partners and $75.7B of imports from 219 in 2024, a deficit of $9.44B.
- Exports
- $66.3B195 partners
- Imports
- $75.7B219 partners
- Balance
- −$9.44Bdeficit
- Total trade
- $142B2024
ExportsBack to top ↑
Where its exports go
The largest partners in 2024, with each one's share of the nation's exports.
| Partner | Value | Share | |
|---|---|---|---|
| Switzerland | $20.4B | 31% | |
| Germany | $7.09B | 11% | |
| Italy | $5.48B | 8.3% | |
| Croatia | $5.32B | 8.0% | |
| Austria | $2.95B | 4.5% | |
| Hungary | $2.31B | 3.5% | |
| France | $2.13B | 3.2% | |
| Poland | $1.52B | 2.3% | |
| Russia | $1.27B | 1.9% | |
| Romania | $1.22B | 1.8% | |
| United States | $1.13B | 1.7% | |
| Serbia | $1.11B | 1.7% | |
| Czech Republic | $1.08B | 1.6% | |
| United Kingdom | $1.03B | 1.5% | |
| Netherlands | $931M | 1.4% | |
| Spain | $902M | 1.4% | |
| Slovakia | $750M | 1.1% | |
| Bosnia and Herzegovina | $680M | 1.0% | |
| Denmark | $547M | 0.8% | |
| Turkey | $522M | 0.8% |
What it exports
The largest categories in 2024.
| Category | Value | Share | |
|---|---|---|---|
| Pharmaceutical products | $25.5B | 39% | |
| Electrical, electronic equipment | $6.01B | 9.1% | |
| Vehicles other than railway, tramway | $5.89B | 8.9% | |
| Machinery, nuclear reactors, boilers | $4.90B | 7.4% | |
| Mineral fuels, oils, distillation products | $3.22B | 4.9% | |
| Plastics | $1.87B | 2.8% | |
| Aluminum | $1.64B | 2.5% | |
| Iron and steel | $1.49B | 2.3% | |
| Rubbers | $1.04B | 1.6% | |
| Articles of iron or steel | $994M | 1.5% | |
| Optical, photo, technical, medical apparatus | $973M | 1.5% | |
| Wood and articles of wood, wood charcoal | $935M | 1.4% | |
| Paper and paperboard, articles of pulp, paper and board | $897M | 1.4% | |
| Furniture, lighting signs, prefabricated buildings | $794M | 1.2% | |
| Essential oils, perfumes, cosmetics, toiletries | $509M | 0.8% |
ImportsBack to top ↑
Where its imports come from
The largest partners in 2024, with each one's share of the nation's imports.
| Partner | Value | Share | |
|---|---|---|---|
| Switzerland | $18.0B | 24% | |
| China | $9.25B | 12% | |
| Germany | $7.06B | 9.3% | |
| India | $6.48B | 8.6% | |
| Italy | $5.80B | 7.7% | |
| Austria | $3.69B | 4.9% | |
| Croatia | $2.30B | 3.0% | |
| United States | $1.99B | 2.6% | |
| Turkey | $1.49B | 2.0% | |
| France | $1.39B | 1.8% | |
| Poland | $1.37B | 1.8% | |
| Hungary | $1.27B | 1.7% | |
| Spain | $1.13B | 1.5% | |
| Netherlands | $1.08B | 1.4% | |
| Czech Republic | $1.05B | 1.4% | |
| Serbia | $858M | 1.1% | |
| Bosnia and Herzegovina | $810M | 1.1% | |
| Belgium | $754M | 1.0% | |
| Saudi Arabia | $722M | 1.0% | |
| Slovakia | $619M | 0.8% |
What it imports
The largest categories in 2024.
| Category | Value | Share | |
|---|---|---|---|
| Organic chemicals | $22.4B | 30% | |
| Pharmaceutical products | $11.0B | 15% | |
| Vehicles other than railway, tramway | $5.73B | 7.6% | |
| Mineral fuels, oils, distillation products | $4.98B | 6.6% | |
| Electrical, electronic equipment | $4.68B | 6.2% | |
| Machinery, nuclear reactors, boilers | $4.15B | 5.5% | |
| Plastics | $2.23B | 3.0% | |
| Iron and steel | $2.05B | 2.7% | |
| Aluminum | $1.59B | 2.1% | |
| Optical, photo, technical, medical apparatus | $1.12B | 1.5% | |
| Articles of iron or steel | $999M | 1.3% | |
| Paper and paperboard, articles of pulp, paper and board | $824M | 1.1% | |
| Rubbers | $738M | 1.0% | |
| Furniture, lighting signs, prefabricated buildings | $652M | 0.9% | |
| Wood and articles of wood, wood charcoal | $639M | 0.8% |
In a list, the bar runs to the largest in that list. The line is each figure’s history from 2000, drawn to its own peak: it shows the shape of the years, and the value shows the size.
External balanceBack to top ↑
$2.954 billion (2013 est.)//$1.486 billion (2012 est.)
Trade Facilitation & LogisticsBack to top ↑
Trade Policy & Market AccessBack to top ↑
- Trade Policy & Negotiation Capability
- Market Access & Agreements Network
- Trade Law & Enforcement
- Standards, Conformity & Quality Infrastructure
Digital & Services TradeBack to top ↑
- Services Trade Capability
- Digital Trade & E-Commerce
- Data Flows & Digital Trade Governance
- Tourism & Visitor Economy
Investment Attraction & ProjectionBack to top ↑
- Investment Attraction & Facilitation
- Investment Absorption & Linkages
- Outward Investment & Global Corporate Presence
$14.67 billion (31 December 2013 est.)//$15.57 billion (31 December 2012 est.)
$7.453 billion (31 December 2013 est.)//$7.436 billion (31 December 2012 est.)
Export Capability & SophisticationBack to top ↑
$28.73 billion (2013 est.)//$27.08 billion (2012 est.)
Germany 20%, Italy 12%, Austria 7.9%, Croatia 6.2%, France 4.8%, Russia 4.6% (2012)
manufactured goods, machinery and transport equipment, chemicals, food
Global Value Chain PositionBack to top ↑
- Value Chain Participation & Integration
- Value Chain Position & Upgrading
- Regional Integration & Hub Anchoring
Economic Leverage & DependenceBack to top ↑
- Strategic Supply Security
- Concentration Risk & Revenue Stabilisation
- Economic Leverage & Coercion Resistance
$29.49 billion (2013 est.)//$28.39 billion (2012 est.)
Italy 16.5%, Germany 16.3%, Austria 10.4%, Croatia 4.8%, Hungary 4% (2012)
machinery and transport equipment, manufactured goods, chemicals, fuels and lubricants, food
Slovenia · you are in
Historical Context
Foundations
GINC Capability Domains
Find in this brief · Slovenia