
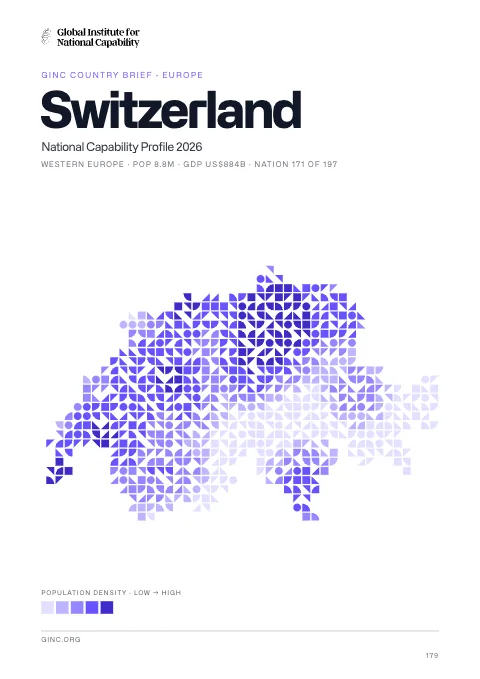
Switzerland
Switzerland is a landlocked formally a confederation but similar in structure to a federal republic in Europe, home to 8.1 million people, with its capital at Bern.
Contents
12 chapters
Foundations
01–03
At a glance
- Area
- 41.3Kkm²#135 World#30 Europe
- Population
- 8.1M#95 World#17 Europe
- GDP (market)
- $646B
- GDP (PPP)
- $371.2B#36 World#9 Europe
- GDP per capita
- $54.8K#13 World#6 Europe
The whole brief
Switzerland National Capability Profile 2026
Foundations · Chapter 01
Historical Context
🇨🇭 Switzerland’s understanding the origins and evolution of the modern nation
BackgroundBack to top ↑
The Swiss Confederation was founded in 1291 as a defensive alliance among three cantons. In succeeding years, other localities joined the original three. The Swiss Confederation secured its independence from the Holy Roman Empire in 1499. A constitution of 1848, subsequently modified in 1874, replaced the confederation with a centralized federal government. Switzerland's sovereignty and neutrality have long been honored by the major European powers, and the country was not involved in either of the two world wars. The political and economic integration of Europe over the past half century, as well as Switzerland's role in many UN and international organizations, has strengthened Switzerland's ties with its neighbors. However, the country did not officially become a UN member until 2002. Switzerland remains active in many UN and international organizations but retains a strong commitment to neutrality.
IndependenceBack to top ↑
1 August 1291 (founding of the Swiss Confederation)
National holidayBack to top ↑
Founding of the Swiss Confederation, 1 August (1291)
Foundations · Chapter 02
Geography
🇨🇭 Switzerland’s territory, resources and strategic position
Location and areaBack to top ↑
Central Europe, east of France, north of Italy
47 00 N, 8 00 E
Europe
slightly less than twice the size of New Jersey
0 km (landlocked)
none (landlocked)
Terrain and resourcesBack to top ↑
mostly mountains (Alps in south, Jura in northwest) with a central plateau of rolling hills, plains, and large lakes
hydropower potential, timber, salt
550 sq km (2007)
Settlement and hazardsBack to top ↑
avalanches, landslides; flash floods
landlocked; crossroads of northern and southern Europe; along with southeastern France, northern Italy, and southwestern Austria, has the highest elevations in the Alps
OtherBack to top ↑
53.5 cu km (2011)
air pollution from vehicle emissions and open-air burning; acid rain; water pollution from increased use of agricultural fertilizers; loss of biodiversity
Foundations · Chapter 03
Environment
🇨🇭 Switzerland’s environmental conditions, resources and national resilience
ClimateBack to top ↑
temperate, but varies with altitude; cold, cloudy, rainy/snowy winters; cool to warm, cloudy, humid summers with occasional showers
Emissions and pollutionBack to top ↑
Water, waste and foodBack to top ↑
Resources and agreementsBack to top ↑
GINC Capability Domains · Chapter 04
Critical Technology
🇨🇭 Switzerland’s technology frontiers and the pursuit of national advantage
Two counts are set side by side for 2015–2024: on the left, the papers researchers in Switzerland published; on the right, the patent families that began there and were filed in more than one country. First by capability group, then group by group with each group’s capabilities. The badge on a card is the nation’s place among all nations. Papers are from GINC Research Analytics, patent families from GINC Patents.
Research by capability group
#20 WorldPapers published, 2015–2024
4,345
4,161
3,776
2,227
2,146
1,678
1,283
875
674
51
Patents by capability group
#11 WorldInternational patent families, 2015–2024
4,388
2,643
2,386
2,359
2,127
1,590
1,355
1,296
136
50
Advanced Materials & ManufacturingBack to top ↑
Research
#19 WorldPapers published, 2015–2024
Patents
#9 WorldInternational patent families, 2015–2024
Energy TechnologiesBack to top ↑
Research
#21 WorldPapers published, 2015–2024
Patents
#14 WorldInternational patent families, 2015–2024
Semiconductors & Advanced ComputingBack to top ↑
Research
#13 WorldPapers published, 2015–2024
No research topic: Semiconductor Design & EDA · Advanced Semiconductor Fabrication · Semiconductor Equipment & Materials · Advanced Packaging & Heterogeneous Integration
Patents
#11 WorldInternational patent families, 2015–2024
Artificial IntelligenceBack to top ↑
Research
#27 WorldPapers published, 2015–2024
Patents
#14 WorldInternational patent families, 2015–2024
Quantum TechnologiesBack to top ↑
Research
#13 WorldPapers published, 2015–2024
Patents
#11 WorldInternational patent families, 2015–2024
Connectivity, Cyber & Trust TechnologiesBack to top ↑
Research
#32 WorldPapers published, 2015–2024
Patents
#14 WorldInternational patent families, 2015–2024
Sensing, Timing & NavigationBack to top ↑
Research
#27 WorldPapers published, 2015–2024
Patents
#10 WorldInternational patent families, 2015–2024
Robotics & Autonomous SystemsBack to top ↑
Research
#20 WorldPapers published, 2015–2024
No research topic: Human-Machine Interfaces
Patents
#9 WorldInternational patent families, 2015–2024
Biotechnology & Health TechnologiesBack to top ↑
Research
#13 WorldPapers published, 2015–2024
Patents
#8 WorldInternational patent families, 2015–2024
Medicine and BioTech
Clinical research and life-science invention, drawn from the same series that drive the metric pages. Each card opens the full cross-country comparison.
Space TechnologiesBack to top ↑
Research
#19 WorldPapers published, 2015–2024
Patents
#19 WorldInternational patent families, 2015–2024
GINC Capability Domains · Chapter 05
Strategic Infrastructure
🇨🇭 Switzerland’s energy, connectivity and the material foundations of capability
Resource InfrastructureBack to top ↑
3,613 bbl/day (2012 est.)
0 bbl/day (2011 est.)
258,200 bbl/day (2011 est.)
0 bbl (1 January 2013 est.)
96,710 bbl/day (2010 est.)
258,200 bbl/day (2011 est.)
7,585 bbl/day (2010 est.)
157,600 bbl/day (2010 est.)
0 cu m (2011 est.)
3.2 billion cu m (2012 est.)
8.494 billion cu m (2012 est.)
11.77 billion cu m (2012 est.)
0 cu m (1 January 2011 est.)
gas 1,800 km; oil 94 km; refined products 7 km (2013)
Agriculture & Food InfrastructureBack to top ↑
- Irrigation & Agricultural Water
- Livestock & Veterinary
- Fisheries & Aquaculture
- Storage, Cold Chain & Markets
Energy InfrastructureBack to top ↑
- Thermal Generation
- Nuclear Generation
- Nuclear Fuel Cycle & Radioactive Waste
- Hydropower
- Renewable Generation
- Transmission & Distribution
- System Control & Dispatch
- Storage & Fuel Supply
18.07 million kW (2010 est.)
68.02 billion kWh (2012 est.)
58.97 billion kWh (2012 est.)
34.57 billion kWh (2012 est.)
32.25 billion kWh (2012 est.)
3.1% of total installed capacity (2010 est.)
24.3% of total installed capacity (2012 est.)
68% of total installed capacity (2012 est.)
5.5% of total installed capacity (2012 est.)
41.84 million Mt (2011 est.)
Water, Sanitation & Waste InfrastructureBack to top ↑
- Dams, Reservoirs & Flood Defence
- Water Supply & Treatment
- Bulk Water Transfer & Desalination
- Wastewater & Sanitation
- Solid Waste & Recycling
Advanced ManufacturingBack to top ↑
- Materials & Inputs
- Chemicals & Hazardous Process Industry
- Production Systems
- Supply Chain & Ecosystem
- Workforce & Innovation
Transport InfrastructureBack to top ↑
- Seaports & Terminals
- Air Infrastructure
- Air Navigation & Traffic Management
- Inland Waterways & Ferries
- Rail Infrastructure
- Roads & Bridges
- Logistics, Multimodal & Border Infrastructure
- Postal & Parcel
63 (2013)
2 (2013)
1,292 km (there are 1,227 km of waterways on lakes and rivers for public transport and another 65 km on the Rhine River between Basel-Rheinfelden and Schaffhausen-Bodensee used for the transport of commercial goods) (2010)
Communications & Digital InfrastructureBack to top ↑
- Subsea Cables & International Gateways
- Core & Backbone Networks
- Mobile & Wireless Networks
- Spectrum & Broadcasting
- Data Centres, Compute & Cloud
- Data Resources
- AI Tools & Applications
4.382 million (2012)
10.46 million (2012)
6.152 million (2009)
5.301 million (2012)
.ch
Financial InfrastructureBack to top ↑
- Currency & Reserves
- Payments & Settlement Systems
- Markets, Exchanges & Depositories
- Banks, Insurers & Systemic Institutions
Social InfrastructureBack to top ↑
- Health Infrastructure
- Public Health & Laboratories
- Medical Supply & Stockpiles
- Education & Skills Infrastructure
- Research & Scientific Facilities
- Housing, Community & Social Services
- Government & Public Administration
- Cultural, Community & Recreational Infrastructure
- Justice & Corrections
- Emergency Services & Civil Protection
- Hydrometeorology & Early Warning
Space, Aerospace & Defence InfrastructureBack to top ↑
GINC Capability Domains · Chapter 06
National Security
🇨🇭 Switzerland’s force, intelligence and the defence of the nation
Disputes and terrorismBack to top ↑
none
Force Generation & MobilisationBack to top ↑
Swiss Armed Forces: Land Forces, Swiss Air Force (Schweizer Luftwaffe) (2013)
19-26 years of age for male compulsory military service; 18 years of age for voluntary male and female military service; every Swiss male has to serve at least 260 days in the armed forces; conscripts receive 18 weeks of mandatory training, followed by seven 3-week intermittent recalls for training during the next 10 years (2012)
0.76% of GDP (2012)//0.75% of GDP (2011)//0.76% of GDP (2010)
Forces under arms
Active-duty strength on the Correlates of War series, which reaches back to 1816 and so carries a nation’s whole record of mobilisation rather than its present establishment. The card opens the full cross-country comparison.
Intelligence & AssessmentBack to top ↑
- Imagery & Geospatial Intelligence
- Signals & Cyber Intelligence
- Technical & Measurement Intelligence
- Open-Source & Financial Intelligence
- Human Intelligence & Counterintelligence
- All-Source Analysis & Warning
Joint Command, Projection & SustainmentBack to top ↑
- Command, Control & Communications
- Strategic Lift & Mobility
- Expeditionary & Peace Operations
- Operational Sustainment & War Reserves
- Defence Industrial Mobilisation
- CBRN Defence
Land PowerBack to top ↑
- Combined Arms Manoeuvre
- Land Fires
- Battlefield Aviation & Uncrewed Systems
- Special Operations & Irregular Warfare
Maritime PowerBack to top ↑
- Maritime Security & Constabulary
- Sea Denial & Undersea Warfare
- Sea Control
- Amphibious & Expeditionary Operations
Air PowerBack to top ↑
- Air Sovereignty & Policing
- Control of the Air
- Air Strike & Interdiction
- Airborne ISR, Early Warning & Battle Management
Strategic Strike & Missile DefenceBack to top ↑
Space OperationsBack to top ↑
Cyber & Electromagnetic OperationsBack to top ↑
Nuclear DeterrenceBack to top ↑
GINC Capability Domains · Chapter 07
Human Capital
🇨🇭 Switzerland’s population, health and the skills that sustain capability
DemographyBack to top ↑
8,061,516 (July 2014 est.)
0.78% (2014 est.)
10.48 births/1,000 population (2014 est.)
8.1 deaths/1,000 population (2014 est.)
1.54 children born/woman (2014 est.)
30.2 (2010 est.)
Migration and urbanisationBack to top ↑
5.43 migrant(s)/1,000 population (2014 est.)
Zurich 1.194 million; BERN (capital) 353,000 (2011)
Welfare and equityBack to top ↑
7.6% (2011)
28.7 (2012 est.)//33.1 (1992)
DisplacementBack to top ↑
Early Childhood DevelopmentBack to top ↑
Foundational EducationBack to top ↑
5.2% of GDP (2010)
Advanced EducationBack to top ↑
Technical & Vocational SkillsBack to top ↑
Digital & AI CompetenceBack to top ↑
Generative AI adoption
Modelled share of working-age adults using generative AI, from Microsoft telemetry scaled to each country’s 15–64 population. A measure of how fast a workforce is absorbing the technology rather than of how much of it a nation builds. The card opens the full cross-country comparison.
Lifelong Learning & ReskillingBack to top ↑
Research Talent & Knowledge CreationBack to top ↑
Population HealthBack to top ↑
8 deaths/100,000 live births (2010)
17.5% (2008)
0.4% (2009 est.)
18,000 (2009 est.)
fewer than 100 (2009 est.)
Health System CapabilityBack to top ↑
10.9% of GDP (2011)
4.08 physicians/1,000 population (2010)
5 beds/1,000 population (2010)
GINC Capability Domains · Chapter 08
Governance and Integrity
🇨🇭 Switzerland’s institutions, law and the integrity of the state
State structureBack to top ↑
formally a confederation but similar in structure to a federal republic
26 cantons (cantons, singular - canton in French; cantoni, singular - cantone in Italian; Kantone, singular - Kanton in German); Aargau, Appenzell Ausserrhoden, Appenzell Innerrhoden, Basel-Landschaft, Basel-Stadt, Bern/Berne, Fribourg/Freiburg, Geneve, Glarus, Graubuenden/Grischun/Grigioni, Jura, Luzern, Neuchatel, Nidwalden, Obwalden, Sankt Gallen, Schaffhausen, Schwyz, Solothurn, Thurgau, Ticino, Uri, Valais/Wallis, Vaud, Zug, Zuerich
previous 1848, 1874 (extensive revision of 1848 version); latest adopted by referendum 18 April 1999, effective 1 January 2000; amended several times, last in 2012 (2012)
18 years of age; universal
Political Institutions & Civic ParticipationBack to top ↑
- Electoral Management & Integrity
- Legislature & Deliberative Institutions
- Citizen Participation & Civic Space
bicameral Federal Assembly or Bundesversammlung (in German), Assemblee Federale (in French), Assemblea Federale (in Italian) consists of the Council of States or Staenderat (in German), Conseil des Etats (in French), Consiglio degli Stati (in Italian) (46 seats; membership consists of 2 representatives from each canton and 1 from each half canton; members serve four-year terms) and the National Council or Nationalrat (in German), Conseil National (in French), Consiglio Nazionale (in Italian) (200 seats; members elected by popular vote on the basis of proportional representation serve four-year terms)
Christian Democratic People's Party (Christlichdemokratische Volkspartei der Schweiz or CVP, Parti Democrate-Chretien Suisse or PDC, Partito Popolare Democratico Svizzero or PPD, Partida Cristiandemocratica dalla Svizra or PCD) [Christophe DARBELLAY]//Conservative Democratic Party (Buergerlich-Demokratische Partei Schweiz or BDP, Parti Bourgeois Democratique Suisse or PBD, Partito Borghese Democratico Svizzero or PBD, Partido burgais democratica Svizera or PBD) [Martin LANDOLT]//Free Democratic Party or FDP.The Liberals (FDP.Die Liberalen, PLR.Les Liberaux-Radicaux, PLR.I Liberali, Ils Liberals) [Philipp MUELLER]//Green Liberal Party (Grunliberale or GLP, Parti vert liberale or PVL, Partito Verde-Liberale or PVL, Partida Verde Liberale or PVL) [Martin BAEUMLE]//Green Party (Gruene Partei der Schweiz or Gruene, Parti Ecologiste Suisse or Les Verts, Partito Ecologista Svizzero or I Verdi, Partida Ecologica Svizra or La Verda) [Adele THORENS]//Social Democratic Party (Sozialdemokratische Partei der Schweiz or SPS, Parti Socialiste Suisse or PSS, Partito Socialista Svizzero or PSS, Partida Socialdemocratica de la Svizra or PSS) [Christian LEVRAT]//Swiss People's Party (Schweizerische Volkspartei or SVP, Union Democratique du Centre or UDC, Unione Democratica di Centro or UDC, Uniun Democratica dal Center or UDC) [Toni BRUNNER]//and other minor parties
NA
Justice System & Fundamental RightsBack to top ↑
- Judicial Independence & Court Capability
- Access to Justice & Legal Services
- Fundamental Rights Protection
- Human Rights Institutions & Equality Bodies
civil law system; judicial review of legislative acts, except for federal decrees of a general obligatory character
accepts compulsory ICJ jurisdiction with reservations; accepts ICCt jurisdiction
Internal Security & OrderBack to top ↑
a major international financial center vulnerable to the layering and integration stages of money laundering; despite significant legislation and reporting requirements, secrecy rules persist and nonresidents are permitted to conduct business through offshore entities and various intermediaries; transit country for and consumer of South American cocaine, Southwest Asian heroin, and Western European synthetics; domestic cannabis cultivation and limited ecstasy production
Regulatory Governance & Strategic ControlsBack to top ↑
- Regulatory Quality & Better Regulation
- Regulatory Delivery & Independent Regulators
- Strategic Controls & Economic Security Administration
Government Effectiveness & Public AdministrationBack to top ↑
- Centre of Government & Policy Coordination
- Civil Service & Public Workforce
- Digital Government & Service Delivery
- Legal Identity & Civil Registration
- Statistical & Data Capability
Public Integrity & Anti-CorruptionBack to top ↑
Transparency, Oversight & AccountabilityBack to top ↑
- Right to Information & Open Government
- Independent Oversight & Supreme Audit
- Independent Media & Journalist Safety
National Resilience & Crisis ManagementBack to top ↑
GINC Capability Domains · Chapter 09
Information and Influence
🇨🇭 Switzerland’s identity, media and the projection of influence
Identity and cultureBack to top ↑
German (official) 64.9%, French (official) 22.6%, Italian (official) 8.3%, Serbo-Croatian 2.5%, Albanian 2.6%, Portuguese 3.4%, Spanish 2.2%, English 4.6%, Romansch (official) 0.5%, other 5.1%
Roman Catholic 38.2%, Protestant 26.9%, Muslim 4.9%, other Christian 5.7%, other 1.6%, none 21.4%, unspecified 1.3% (2012 est.)
German 65%, French 18%, Italian 10%, Romansch 1%, other 6%
Swiss cross (white cross on red field; arms equal length)
red square with a bold, equilateral white cross in the center that does not extend to the edges of the flag; various medieval legends purport to describe the origin of the flag; a white cross used as identification for troops of the Swiss Confederation is first attested at the Battle of Laupen (1339)
Diplomatic Statecraft & Global NetworksBack to top ↑
- Diplomatic Network & Consular Reach
- Multilateral Leadership & Norm Setting
- Agenda-Setting & Convening
- Mediation & Crisis Diplomacy
ADB (nonregional member), AfDB (nonregional member), Australia Group, BIS, CD, CE, CERN, EAPC, EBRD, EFTA, EITI (implementing country), ESA, FAO, FATF, G-10, IADB, IAEA, IBRD, ICAO, ICC (national committees), ICRM, IDA, IEA, IFAD, IFC, IFRCS, IGAD (partners), ILO, IMF, IMO, IMSO, Interpol, IOC, IOM, IPU, ISO, ITSO, ITU, ITUC (NGOs), LAIA (observer), MIGA, MINUSMA, MONUSCO, NEA, NSG, OAS (observer), OECD, OIF, OPCW, OSCE, Pacific Alliance (observer), Paris Club, PCA, PFP, Schengen Convention, UN, UNCTAD, UNESCO, UNHCR, UNIDO, UNITAR, UNMISS, UNRWA, UNTSO, UNWTO, UPU, WCO, WHO, WIPO, WMO, WTO, ZC
Alliances & Security CooperationBack to top ↑
Development Cooperation & Global AssistanceBack to top ↑
Culture, Language & Education DiplomacyBack to top ↑
- Cultural & Language Institutes
- Creative Industries & Cultural Export Reach
- Heritage & Cultural Institutions
- Education Diplomacy & Alumni Networks
- Sports & Major Events
Diaspora & Global CommunitiesBack to top ↑
Information Environment & Strategic CommunicationBack to top ↑
- Strategic Communications & Public Diplomacy
- International Media & Broadcasting
- Information Defence & Counter-Interference
the publicly owned radio and TV broadcaster, Swiss Broadcasting Corporation (SRG/SSR), operates 7 national TV networks, 3 broadcasting in German, 2 in Italian, and 2 in French; private commercial TV stations broadcast regionally and locally; TV broadcasts from stations in Germany, Italy, and France are widely available via multi-channel cable and satellite TV services; SRG/SSR operates 18 radio stations that, along with private broadcasters, provide national to local coverage (2009)
GINC Capability Domains · Chapter 10
Financial Strength
🇨🇭 Switzerland’s fiscal depth, reserves and the capacity to act
Monetary & Currency CapabilityBack to top ↑
- Monetary Policy & Price Stability
- Exchange Rate & External Account Management
- Currency Issuance & Digital Money
-0.4% (2013 est.)//-0.7% (2012 est.)
Swiss francs (CHF) per US dollar -//0.9542 (2013 est.)//0.9374 (2012 est.)//1.0429 (2010 est.)//1.0881 (2009)//1.0774 (2008)
0.5% (31 December 2010 est.)//0.75% (31 December 2009 est.)
2.7% (31 December 2013 est.)//2.69% (31 December 2012 est.)
$525.9 billion (31 December 2013 est.)//$534.4 billion (31 December 2012 est.)
$1.36 trillion (31 December 2013 est.)//$1.215 trillion (31 December 2012 est.)
Fiscal Capacity & Public FinanceBack to top ↑
- Revenue Mobilisation & Tax Administration
- Public Expenditure & Budget Management
- Sovereign Debt & Treasury Management
- Public Investment Management
33.7% of GDP (2013 est.)
1.4% of GDP (2013 est.)
33.8% of GDP (2013 est.)//34.9% of GDP (2012)
calendar year
Financial System Depth & AccessBack to top ↑
- Banking System Capacity
- Capital Markets Depth & Development
- Long-Term & Institutional Capital
- Financial Inclusion & Household Access
- Development & Policy Finance
$1.395 trillion (31 December 2013 est.)//$1.247 trillion (31 December 2012 est.)
$1.079 trillion (31 December 2012 est.)//$932.2 billion (31 December 2011)//$1.229 trillion (31 December 2010 est.)
31.5% of GDP (2013 est.)//31.5% of GDP (2012 est.)//27.3% of GDP (2011 est.)
Financial Regulation & IntegrityBack to top ↑
- Prudential Regulation & Supervision
- Financial Integrity & Illicit Finance Control
- Market Conduct & Consumer Protection
- Payment & Market Infrastructure Oversight
Financial Stability & Crisis ManagementBack to top ↑
- Macroprudential & Systemic Oversight
- Crisis Management, Resolution & Deposit Insurance
- External Liquidity & Financial Safety Nets
Sovereign Capital & External Financial PowerBack to top ↑
- Official Reserves Management
- Sovereign Wealth & Public Asset Management
- Currency Internationalisation & Reserve Status
- Capital Account & Flow Management
- International Financial Centre Capability
$536.3 billion (31 December 2013 est.)//$536.4 billion (31 December 2012 est.)
$1.544 trillion (31 December 2012 est.)//$1.424 trillion (31 December 2011)
GINC Capability Domains · Chapter 11
Production and Innovation
🇨🇭 Switzerland’s output, industry and the engine of prosperity
Economic Output & ProductivityBack to top ↑
Switzerland is a peaceful, prosperous, and modern market economy with low unemployment, a highly skilled labor force, and a per capita GDP among the highest in the world. Switzerland's economy benefits from a highly developed service sector, led by financial services, and a manufacturing industry that specializes in high-technology, knowledge-based production. Its economic and political stability, transparent legal system, exceptional infrastructure, efficient capital markets, and low corporate tax rates also make Switzerland one of the world's most competitive economies. The Swiss have brought their economic practices largely into conformity with the EU's to enhance their international competitiveness, but some trade protectionism remains, particularly for its small agricultural sector. The fate of the Swiss economy is tightly linked to that of its neighbors in the euro zone, which purchases half of all Swiss exports. The global financial crisis of 2008 and resulting economic downturn in 2009 stalled export demand and put Switzerland in a recession. The Swiss National Bank (SNB) during this period effectively implemented a zero-interest rate policy to boost the economy as well as prevent appreciation of the franc, and Switzerland's economy began to recover in 2010. The sovereign debt crises currently unfolding in neighboring euro-zone countries pose a significant risk to Switzerland's financial stability and are driving up demand for the Swiss franc by investors seeking a safe-haven currency. The independent SNB has upheld its zero-interest rate policy and conducted major market interventions to prevent further appreciation of the Swiss franc, but parliamentarians have urged it to do more to weaken the currency. The franc's strength has made Swiss exports less competitive and weakened the country's growth outlook; GDP growth fell below 2% per year during 2011-13. Switzerland has also come under increasing pressure from individual neighboring countries, the EU, the US, and international institutions to reform its banking secrecy laws. Consequently, the government agreed to conform to OECD regulations on administrative assistance in tax matters, including tax evasion. The government has renegotiated its double taxation agreements with numerous countries, including the US, to incorporate the OECD standard, and is considering the possibility of imposing taxes on bank deposits held by foreigners. These steps will have a lasting impact on Switzerland's long history of bank secrecy.
$371.2 billion (2013 est.)//$363.9 billion (2012 est.)//$360.1 billion (2011 est.)
2% (2013 est.)//1% (2012 est.)//1.8% (2011 est.)
$54,800 (2013 est.)//$53,300 (2012 est.)//$50,900 (2011 est.)
$646.2 billion (2013 est.)
Labour & EmploymentBack to top ↑
- Employment & Labour Force Participation
- Labour Market Institutions & Wage Setting
- Employment Services & Skills Matching
- Labour Adjustment, Transition & Formalisation
4.976 million (2013 est.)
3.2% (2013 est.)//2.9% (2012 est.)
Industrial & Sectoral BaseBack to top ↑
- Manufacturing & Advanced Industry
- Foundational & Process Industries
- Agrifood & Primary Production
- Services Economy
grains, fruits, vegetables; meat, eggs
machinery, chemicals, watches, textiles, precision instruments, tourism, banking, insurance
2.2% (2013 est.)
Structural Transformation & ComplexityBack to top ↑
Business Dynamism & EntrepreneurshipBack to top ↑
- Entrepreneurship & Firm Creation
- Risk Capital & Scale-Up Finance
- Firm Growth, Exit & Renewal
- Competition & Market Contestability
Innovation & CommercialisationBack to top ↑
- Business Innovation Capability
- Research Commercialisation & Knowledge Transfer
- Intellectual Property & Intangible Assets
- Innovation Ecosystems & Clusters
Technology Adoption & DiffusionBack to top ↑
GINC Capability Domains · Chapter 12
Trade and Investment
🇨🇭 Switzerland’s markets, capital and the terms of global exchange
Overall tradeBack to top ↑
$399B of exports to 216 partners and $379B of imports from 194 in 2024, a surplus of $20.4B.
- Exports
- $399B216 partners
- Imports
- $379B194 partners
- Balance
- +$20.4Bsurplus
- Total trade
- $778B2024
ExportsBack to top ↑
Where its exports go
The largest partners in 2024, with each one's share of the nation's exports.
| Partner | Value | Share | |
|---|---|---|---|
| Germany | $52.8B | 13% | |
| United States | $51.2B | 13% | |
| China | $46.6B | 12% | |
| India | $21.9B | 5.5% | |
| France | $19.3B | 4.8% | |
| Slovenia | $18.0B | 4.5% | |
| Italy | $16.8B | 4.2% | |
| Hong Kong | $13.1B | 3.3% | |
| United Kingdom | $12.1B | 3.0% | |
| United Arab Emirates | $11.3B | 2.8% | |
| Turkey | $10.9B | 2.7% | |
| Belgium | $8.90B | 2.2% | |
| Japan | $8.47B | 2.1% | |
| Austria | $8.09B | 2.0% | |
| Singapore | $7.63B | 1.9% | |
| Saudi Arabia | $7.31B | 1.8% | |
| Thailand | $6.38B | 1.6% | |
| Canada | $5.72B | 1.4% | |
| Netherlands | $5.57B | 1.4% | |
| Spain | $5.24B | 1.3% |
What it exports
The largest categories in 2024.
| Category | Value | Share | |
|---|---|---|---|
| Pearls, precious stones, metals, coins | $122B | 31% | |
| Pharmaceutical products | $88.9B | 22% | |
| Clocks and watches | $33.7B | 8.4% | |
| Organic chemicals | $29.8B | 7.5% | |
| Machinery, nuclear reactors, boilers | $25.3B | 6.3% | |
| Optical, photo, technical, medical apparatus | $21.3B | 5.3% | |
| Electrical, electronic equipment | $15.0B | 3.8% | |
| Plastics | $6.41B | 1.6% | |
| Mineral fuels, oils, distillation products | $5.70B | 1.4% | |
| Essential oils, perfumes, cosmetics, toiletries | $4.05B | 1.0% | |
| Coffee, tea, mate and spices | $3.98B | 1.0% | |
| Articles of iron or steel | $2.89B | 0.7% | |
| Vehicles other than railway, tramway | $2.72B | 0.7% | |
| Aluminum | $2.27B | 0.6% | |
| Aircraft, spacecraft | $2.20B | 0.6% |
ImportsBack to top ↑
Where its imports come from
The largest partners in 2024, with each one's share of the nation's imports.
| Partner | Value | Share | |
|---|---|---|---|
| Germany | $67.8B | 18% | |
| Italy | $31.2B | 8.2% | |
| United States | $29.9B | 7.9% | |
| France | $21.4B | 5.7% | |
| Slovenia | $20.4B | 5.4% | |
| China | $19.1B | 5.0% | |
| United Arab Emirates | $13.1B | 3.5% | |
| Austria | $10.6B | 2.8% | |
| United Kingdom | $8.53B | 2.3% | |
| Spain | $8.06B | 2.1% | |
| Japan | $8.00B | 2.1% | |
| Netherlands | $7.09B | 1.9% | |
| Burkina Faso | $6.33B | 1.7% | |
| Uzbekistan | $6.14B | 1.6% | |
| Hong Kong | $6.08B | 1.6% | |
| Ivory Coast | $5.50B | 1.5% | |
| Australia | $4.84B | 1.3% | |
| Zambia | $4.80B | 1.3% | |
| Canada | $4.63B | 1.2% | |
| Ghana | $4.28B | 1.1% |
What it imports
The largest categories in 2024.
| Category | Value | Share | |
|---|---|---|---|
| Pearls, precious stones, metals, coins | $128B | 34% | |
| Pharmaceutical products | $67.5B | 18% | |
| Machinery, nuclear reactors, boilers | $22.5B | 5.9% | |
| Vehicles other than railway, tramway | $18.6B | 4.9% | |
| Electrical, electronic equipment | $16.8B | 4.4% | |
| Mineral fuels, oils, distillation products | $11.6B | 3.1% | |
| Optical, photo, technical, medical apparatus | $9.78B | 2.6% | |
| Plastics | $8.27B | 2.2% | |
| Organic chemicals | $8.04B | 2.1% | |
| Copper | $5.83B | 1.5% | |
| Furniture, lighting signs, prefabricated buildings | $5.09B | 1.3% | |
| Articles of apparel, not knit or crocheted | $4.50B | 1.2% | |
| Articles of iron or steel | $4.41B | 1.2% | |
| Articles of apparel, knit or crocheted | $3.73B | 1.0% | |
| Clocks and watches | $3.71B | 1.0% |
In a list, the bar runs to the largest in that list. The line is each figure’s history from 2000, drawn to its own peak: it shows the shape of the years, and the value shows the size.
External balanceBack to top ↑
$65.6 billion (2013 est.)//$63.82 billion (2012 est.)
Trade Facilitation & LogisticsBack to top ↑
Trade Policy & Market AccessBack to top ↑
- Trade Policy & Negotiation Capability
- Market Access & Agreements Network
- Trade Law & Enforcement
- Standards, Conformity & Quality Infrastructure
Digital & Services TradeBack to top ↑
- Services Trade Capability
- Digital Trade & E-Commerce
- Data Flows & Digital Trade Governance
- Tourism & Visitor Economy
Investment Attraction & ProjectionBack to top ↑
- Investment Attraction & Facilitation
- Investment Absorption & Linkages
- Outward Investment & Global Corporate Presence
$968.9 billion (31 December 2013 est.)//$955.1 billion (31 December 2012 est.)
$1.432 trillion (31 December 2013 est.)//$1.381 trillion (31 December 2012 est.)
Export Capability & SophisticationBack to top ↑
$229.2 billion (2013 est.)//$226 billion (2012 est.)
Germany 18.5%, United States 11.61%, Italy 7.61%, France 6.96%, United Kingdom 5.67% (2013 est.)
machinery, chemicals, metals, watches, agricultural products
Global Value Chain PositionBack to top ↑
- Value Chain Participation & Integration
- Value Chain Position & Upgrading
- Regional Integration & Hub Anchoring
Economic Leverage & DependenceBack to top ↑
- Strategic Supply Security
- Concentration Risk & Revenue Stabilisation
- Economic Leverage & Coercion Resistance
$200.5 billion (2013 est.)//$197.9 billion (2012 est.)
Germany 28.19%, Italy 10.46%, France 8.49%, United States 6.08%, China 5.75%, Austria 4.4% (2013 est.)
machinery, chemicals, vehicles, metals; agricultural products, textiles
Switzerland · you are in
Historical Context
Foundations
GINC Capability Domains
Find in this brief · Switzerland