
Italy
Italy is a republic in Europe, home to 62 million people, with its capital at Rome.
Contents
12 chapters
Foundations
01–03
At a glance
- Area
- 301.3Kkm²#72 World#9 Europe
- Population
- 61.7M#23 World#3 Europe
- GDP (market)
- $2.1T
- GDP (PPP)
- $1.8T#11 World#3 Europe
- GDP per capita
- $29.6K#50 World#23 Europe
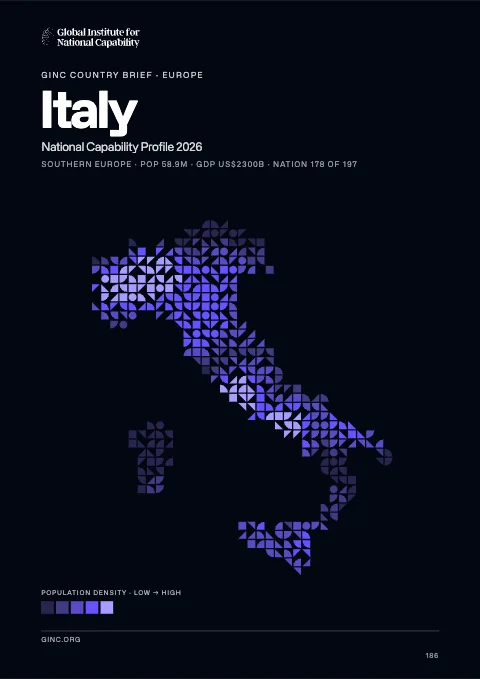
The whole brief
Italy National Capability Profile 2026
Foundations · Chapter 01
Historical Context
🇮🇹 Italy’s understanding the origins and evolution of the modern nation
BackgroundBack to top ↑
Italy became a nation-state in 1861 when the regional states of the peninsula, along with Sardinia and Sicily, were united under King Victor EMMANUEL II. An era of parliamentary government came to a close in the early 1920s when Benito MUSSOLINI established a Fascist dictatorship. His alliance with Nazi Germany led to Italy's defeat in World War II. A democratic republic replaced the monarchy in 1946 and economic revival followed. Italy is a charter member of NATO and the European Economic Community (EEC). It has been at the forefront of European economic and political unification, joining the Economic and Monetary Union in 1999. Persistent problems include sluggish economic growth, high youth and female unemployment, organized crime, corruption, and economic disparities between southern Italy and the more prosperous north.
IndependenceBack to top ↑
17 March 1861 (Kingdom of Italy proclaimed; Italy was not finally unified until 1870)
National holidayBack to top ↑
Republic Day, 2 June (1946)
Foundations · Chapter 02
Geography
🇮🇹 Italy’s territory, resources and strategic position
Location and areaBack to top ↑
Southern Europe, a peninsula extending into the central Mediterranean Sea, northeast of Tunisia
42 50 N, 12 50 E
Europe
almost twice the size of Georgia; slightly larger than Arizona
7,600 km
Terrain and resourcesBack to top ↑
mostly rugged and mountainous; some plains, coastal lowlands
coal, mercury, zinc, potash, marble, barite, asbestos, pumice, fluorspar, feldspar, pyrite (sulfur), natural gas and crude oil reserves, fish, arable land
39,510 sq km (2007)
Settlement and hazardsBack to top ↑
regional risks include landslides, mudflows, avalanches, earthquakes, volcanic eruptions, flooding; land subsidence in Venice
strategic location dominating central Mediterranean as well as southern sea and air approaches to Western Europe
OtherBack to top ↑
191.3 cu km (2011)
air pollution from industrial emissions such as sulfur dioxide; coastal and inland rivers polluted from industrial and agricultural effluents; acid rain damaging lakes; inadequate industrial waste treatment and disposal facilities
Foundations · Chapter 03
Environment
🇮🇹 Italy’s environmental conditions, resources and national resilience
ClimateBack to top ↑
predominantly Mediterranean; Alpine in far north; hot, dry in south
Emissions and pollutionBack to top ↑
Water, waste and foodBack to top ↑
Resources and agreementsBack to top ↑
GINC Capability Domains · Chapter 04
Critical Technology
🇮🇹 Italy’s technology frontiers and the pursuit of national advantage
Two counts are set side by side for 2015–2024: on the left, the papers researchers in Italy published; on the right, the patent families that began there and were filed in more than one country. First by capability group, then group by group with each group’s capabilities. The badge on a card is the nation’s place among all nations. Papers are from GINC Research Analytics, patent families from GINC Patents.
Research by capability group
#8 WorldPapers published, 2015–2024
11,120
9,612
7,589
7,121
4,728
4,416
3,227
2,823
2,049
412
Patents by capability group
#16 WorldInternational patent families, 2015–2024
1,545
1,465
1,456
1,161
1,037
883
692
657
93
42
Advanced Materials & ManufacturingBack to top ↑
Research
#10 WorldPapers published, 2015–2024
Patents
#12 WorldInternational patent families, 2015–2024
Energy TechnologiesBack to top ↑
Research
#11 WorldPapers published, 2015–2024
Patents
#11 WorldInternational patent families, 2015–2024
Semiconductors & Advanced ComputingBack to top ↑
Research
#9 WorldPapers published, 2015–2024
No research topic: Semiconductor Design & EDA · Advanced Semiconductor Fabrication · Semiconductor Equipment & Materials · Advanced Packaging & Heterogeneous Integration
Patents
#16 WorldInternational patent families, 2015–2024
Artificial IntelligenceBack to top ↑
Research
#10 WorldPapers published, 2015–2024
Patents
#19 WorldInternational patent families, 2015–2024
Quantum TechnologiesBack to top ↑
Research
#9 WorldPapers published, 2015–2024
Patents
#19 WorldInternational patent families, 2015–2024
Connectivity, Cyber & Trust TechnologiesBack to top ↑
Research
#8 WorldPapers published, 2015–2024
Patents
#17 WorldInternational patent families, 2015–2024
Sensing, Timing & NavigationBack to top ↑
Research
#5 WorldPapers published, 2015–2024
Patents
#16 WorldInternational patent families, 2015–2024
Robotics & Autonomous SystemsBack to top ↑
Research
#7 WorldPapers published, 2015–2024
No research topic: Human-Machine Interfaces
Patents
#13 WorldInternational patent families, 2015–2024
Biotechnology & Health TechnologiesBack to top ↑
Research
#6 WorldPapers published, 2015–2024
Patents
#17 WorldInternational patent families, 2015–2024
Medicine and BioTech
Clinical research and life-science invention, drawn from the same series that drive the metric pages. Each card opens the full cross-country comparison.
Space TechnologiesBack to top ↑
Research
#4 WorldPapers published, 2015–2024
Patents
#12 WorldInternational patent families, 2015–2024
GINC Capability Domains · Chapter 05
Strategic Infrastructure
🇮🇹 Italy’s energy, connectivity and the material foundations of capability
Resource InfrastructureBack to top ↑
112,000 bbl/day (2012 est.)
6,300 bbl/day (2010 est.)
1.591 million bbl/day (2010 est.)
521.3 million bbl (1 January 2013 est.)
6,600 bbl/day (2011 est.)
1.454 million bbl/day (2011 est.)
628,000 bbl/day (2010 est.)
393,300 bbl/day (2010 est.)
7.8 billion cu m (2012 est.)
68.7 billion cu m (2012 est.)
324 million cu m (2012 est.)
67.8 billion cu m (2012 est.)
62.35 billion cu m (1 January 2013 est.)
gas 20,223 km; oil 1,393 km; refined products 1,574 km (2013)
Agriculture & Food InfrastructureBack to top ↑
- Irrigation & Agricultural Water
- Livestock & Veterinary
- Fisheries & Aquaculture
- Storage, Cold Chain & Markets
Energy InfrastructureBack to top ↑
- Thermal Generation
- Nuclear Generation
- Nuclear Fuel Cycle & Radioactive Waste
- Hydropower
- Renewable Generation
- Transmission & Distribution
- System Control & Dispatch
- Storage & Fuel Supply
124.2 million kW (2012 est.)
299.3 billion kWh (2012 est.)
307.2 billion kWh (2012 est.)
2.304 billion kWh (2012 est.)
45.41 billion kWh (2012 est.)
65% of total installed capacity (2011 est.)
0% of total installed capacity (2012 est.)
18% of total installed capacity (2011 est.)
15.8% of total installed capacity (2011 est.)
400.9 million Mt (2011 est.)
Water, Sanitation & Waste InfrastructureBack to top ↑
- Dams, Reservoirs & Flood Defence
- Water Supply & Treatment
- Bulk Water Transfer & Desalination
- Wastewater & Sanitation
- Solid Waste & Recycling
Advanced ManufacturingBack to top ↑
- Materials & Inputs
- Chemicals & Hazardous Process Industry
- Production Systems
- Supply Chain & Ecosystem
- Workforce & Innovation
Transport InfrastructureBack to top ↑
- Seaports & Terminals
- Air Infrastructure
- Air Navigation & Traffic Management
- Inland Waterways & Ferries
- Rail Infrastructure
- Roads & Bridges
- Logistics, Multimodal & Border Infrastructure
- Postal & Parcel
129 (2013)
5 (2013)
2,400 km (used for commercial traffic; of limited overall value compared to road and rail) (2012)
Communications & Digital InfrastructureBack to top ↑
- Subsea Cables & International Gateways
- Core & Backbone Networks
- Mobile & Wireless Networks
- Spectrum & Broadcasting
- Data Centres, Compute & Cloud
- Data Resources
- AI Tools & Applications
21.656 million (2012)
97.225 million (2012)
29.235 million (2009)
25.662 million (2012)
.it
Financial InfrastructureBack to top ↑
- Currency & Reserves
- Payments & Settlement Systems
- Markets, Exchanges & Depositories
- Banks, Insurers & Systemic Institutions
Social InfrastructureBack to top ↑
- Health Infrastructure
- Public Health & Laboratories
- Medical Supply & Stockpiles
- Education & Skills Infrastructure
- Research & Scientific Facilities
- Housing, Community & Social Services
- Government & Public Administration
- Cultural, Community & Recreational Infrastructure
- Justice & Corrections
- Emergency Services & Civil Protection
- Hydrometeorology & Early Warning
Space, Aerospace & Defence InfrastructureBack to top ↑
GINC Capability Domains · Chapter 06
National Security
🇮🇹 Italy’s force, intelligence and the defence of the nation
Disputes and terrorismBack to top ↑
Italy's long coastline and developed economy entices tens of thousands of illegal immigrants from southeastern Europe and northern Africa
Force Generation & MobilisationBack to top ↑
Italian Armed Forces: Army (Esercito Italiano, EI), Navy (Marina Militare Italiana, MMI), Italian Air Force (Aeronautica Militare Italiana, AMI), Carabinieri Corps (Arma dei Carabinieri, CC) (2011)
18-25 years of age for voluntary military service; women may serve in any military branch; Italian citizenship required; 12-month service obligation (2013)
1.69% of GDP (2012)//1.72% of GDP (2011)//1.69% of GDP (2010)
Forces under arms
Active-duty strength on the Correlates of War series, which reaches back to 1816 and so carries a nation’s whole record of mobilisation rather than its present establishment. The card opens the full cross-country comparison.
Intelligence & AssessmentBack to top ↑
- Imagery & Geospatial Intelligence
- Signals & Cyber Intelligence
- Technical & Measurement Intelligence
- Open-Source & Financial Intelligence
- Human Intelligence & Counterintelligence
- All-Source Analysis & Warning
Joint Command, Projection & SustainmentBack to top ↑
- Command, Control & Communications
- Strategic Lift & Mobility
- Expeditionary & Peace Operations
- Operational Sustainment & War Reserves
- Defence Industrial Mobilisation
- CBRN Defence
Land PowerBack to top ↑
- Combined Arms Manoeuvre
- Land Fires
- Battlefield Aviation & Uncrewed Systems
- Special Operations & Irregular Warfare
Maritime PowerBack to top ↑
- Maritime Security & Constabulary
- Sea Denial & Undersea Warfare
- Sea Control
- Amphibious & Expeditionary Operations
Air PowerBack to top ↑
- Air Sovereignty & Policing
- Control of the Air
- Air Strike & Interdiction
- Airborne ISR, Early Warning & Battle Management
Strategic Strike & Missile DefenceBack to top ↑
Space OperationsBack to top ↑
Cyber & Electromagnetic OperationsBack to top ↑
Nuclear DeterrenceBack to top ↑
GINC Capability Domains · Chapter 07
Human Capital
🇮🇹 Italy’s population, health and the skills that sustain capability
DemographyBack to top ↑
61,680,122 (July 2014 est.)
0.3% (2014 est.)
8.84 births/1,000 population (2014 est.)
10.1 deaths/1,000 population (2014 est.)
1.42 children born/woman (2014 est.)
30.3 (2011 est.)
Migration and urbanisationBack to top ↑
4.29 migrant(s)/1,000 population (2014 est.)
ROME (capital) 3.298 million; Milan 2.909 million; Naples 2.373 million; Turin 1.613 million; Palermo 915,000; Bergamo 784,000 (2011)
Welfare and equityBack to top ↑
29.9% (2012)
31.9 (2012 est.)//27.3 (1995)
DisplacementBack to top ↑
Early Childhood DevelopmentBack to top ↑
Foundational EducationBack to top ↑
4.5% of GDP (2010)
Advanced EducationBack to top ↑
Technical & Vocational SkillsBack to top ↑
Digital & AI CompetenceBack to top ↑
Generative AI adoption
Modelled share of working-age adults using generative AI, from Microsoft telemetry scaled to each country’s 15–64 population. A measure of how fast a workforce is absorbing the technology rather than of how much of it a nation builds. The card opens the full cross-country comparison.
Lifelong Learning & ReskillingBack to top ↑
Research Talent & Knowledge CreationBack to top ↑
Population HealthBack to top ↑
4 deaths/100,000 live births (2010)
19.8% (2008)
0.3% (2009 est.)
140,000 (2009 est.)
fewer than 1,000 (2009 est.)
Health System CapabilityBack to top ↑
9.5% of GDP (2011)
3.8 physicians/1,000 population (2009)
3.5 beds/1,000 population (2010)
GINC Capability Domains · Chapter 08
Governance and Integrity
🇮🇹 Italy’s institutions, law and the integrity of the state
State structureBack to top ↑
republic
15 regions (regioni, singular - regione) and 5 autonomous regions (regioni autonome, singular - regione autonoma)
previous 1848 (originally for Kingdom of Sardinia and adopted by Kingdom of Italy in 1861); latest enacted 22 December 1947, adopted 27 December 1947, entered into force 1 January 1948; amended many times, last in 2012 (2013)
18 years of age; universal except in senatorial elections, where minimum age is 25
Political Institutions & Civic ParticipationBack to top ↑
- Electoral Management & Integrity
- Legislature & Deliberative Institutions
- Citizen Participation & Civic Space
bicameral Parliament or Parlamento consists of the Senate or Senato della Repubblica (321 seats; members elected by proportional vote with the winning coalition in each region receiving 55% of seats from that region; members to serve five-year terms; and up to 5 senators for life appointed by the president of the Republic) and the Chamber of Deputies or Camera dei Deputati (630 seats; members elected by popular vote with the winning national coalition receiving 54% of chamber seats; members to serve five-year terms); note - it has not been clarified if each president has the power to designate up to five senators or if five is the number of senators for life who might sit in the Senate
manufacturers and merchants associations - Confcommercio; Confindustria//organized farm groups - Confcoltivatori; Confagricoltura; Roman Catholic Church//three major trade union confederations - Confederazione Generale Italiana del Lavoro or CGIL [Susanna CAMUSSO] which is left wing; Confederazione Italiana dei Sindacati Lavoratori or CISL [Raffaele BONANNI], which is Roman Catholic centrist; Unione Italiana del Lavoro or UIL [Luigi ANGELETTI] which is lay centrist
Justice System & Fundamental RightsBack to top ↑
- Judicial Independence & Court Capability
- Access to Justice & Legal Services
- Fundamental Rights Protection
- Human Rights Institutions & Equality Bodies
civil law system; judicial review of legislation under certain conditions in Constitutional Court
has not submitted an ICJ jurisdiction declaration; accepts ICCt jurisdiction
Internal Security & OrderBack to top ↑
important gateway for and consumer of Latin American cocaine and Southwest Asian heroin entering the European market; money laundering by organized crime and from smuggling
Regulatory Governance & Strategic ControlsBack to top ↑
- Regulatory Quality & Better Regulation
- Regulatory Delivery & Independent Regulators
- Strategic Controls & Economic Security Administration
Government Effectiveness & Public AdministrationBack to top ↑
- Centre of Government & Policy Coordination
- Civil Service & Public Workforce
- Digital Government & Service Delivery
- Legal Identity & Civil Registration
- Statistical & Data Capability
Public Integrity & Anti-CorruptionBack to top ↑
Transparency, Oversight & AccountabilityBack to top ↑
- Right to Information & Open Government
- Independent Oversight & Supreme Audit
- Independent Media & Journalist Safety
National Resilience & Crisis ManagementBack to top ↑
GINC Capability Domains · Chapter 09
Information and Influence
🇮🇹 Italy’s identity, media and the projection of influence
Identity and cultureBack to top ↑
Italian (official), German (parts of Trentino-Alto Adige region are predominantly German-speaking), French (small French-speaking minority in Valle d'Aosta region), Slovene (Slovene-speaking minority in the Trieste-Gorizia area)
Christian 80% (overwhelmingly Roman Catholic with very small groups of Jehovah's Witnesses and Protestants), Muslim (about 800,000 to 1 million), Atheist and Agnostic 20%
Italian (includes small clusters of German-, French-, and Slovene-Italians in the north and Albanian-Italians and Greek-Italians in the south)
white, five-pointed star (Stella d'Italia)
three equal vertical bands of green (hoist side), white, and red; design inspired by the French flag brought to Italy by Napoleon in 1797; colors are those of Milan (red and white) combined with the green uniform color of the Milanese civic guard
Diplomatic Statecraft & Global NetworksBack to top ↑
- Diplomatic Network & Consular Reach
- Multilateral Leadership & Norm Setting
- Agenda-Setting & Convening
- Mediation & Crisis Diplomacy
ADB (nonregional member), AfDB (nonregional member), Australia Group, BIS, BSEC (observer), CBSS (observer), CD, CDB, CE, CEI, CERN, EAPC, EBRD, ECB, EIB, EITI (implementing country), EMU, ESA, EU, FAO, FATF, G-20, G-7, G-8, G-10, IADB, IAEA, IBRD, ICAO, ICC (national committees), ICRM, IDA, IEA, IFAD, IFC, IFRCS, IGAD (partners), IHO, ILO, IMF, IMO, IMSO, Interpol, IOC, IOM, IPU, ISO, ITSO, ITU, ITUC (NGOs), LAIA (observer), MIGA, MINURSO, MINUSMA, NATO, NEA, NSG, OAS (observer), OECD, OPCW, OSCE, Pacific Alliance (observer), Paris Club, PCA, PIF (partner), Schengen Convention, SELEC (observer), SICA (observer), UN, UNAMID, UNCTAD, UNESCO, UNHCR, UNIDO, UNIFIL, Union Latina, UNMISS, UNMOGIP, UNRWA, UNTSO, UNWTO, UPU, WCO, WHO, WIPO, WMO, WTO, ZC
Alliances & Security CooperationBack to top ↑
Development Cooperation & Global AssistanceBack to top ↑
Culture, Language & Education DiplomacyBack to top ↑
- Cultural & Language Institutes
- Creative Industries & Cultural Export Reach
- Heritage & Cultural Institutions
- Education Diplomacy & Alumni Networks
- Sports & Major Events
Diaspora & Global CommunitiesBack to top ↑
Information Environment & Strategic CommunicationBack to top ↑
- Strategic Communications & Public Diplomacy
- International Media & Broadcasting
- Information Defence & Counter-Interference
two Italian media giants dominate - the publicly owned Radiotelevisione Italiana (RAI) with 3 national terrestrial stations and privately owned Mediaset with 3 national terrestrial stations; a large number of private stations and Sky Italia - a satellite TV network; RAI operates 3 AM/FM nationwide radio stations; some 1,300 commercial radio stations (2007)
GINC Capability Domains · Chapter 10
Financial Strength
🇮🇹 Italy’s fiscal depth, reserves and the capacity to act
Monetary & Currency CapabilityBack to top ↑
- Monetary Policy & Price Stability
- Exchange Rate & External Account Management
- Currency Issuance & Digital Money
1.2% (2013 est.)//3% (2012 est.)
euros (EUR) per US dollar -//0.7634 (2013 est.)//0.7752 (2012 est.)//0.755 (2010 est.)//0.7198 (2009 est.)//0.6827 (2008 est.)
0.25% (31 December 2013)//0.75% (31 December 2012)
5.2% (31 December 2013 est.)//5.22% (31 December 2012 est.)
$1.138 trillion (31 December 2013 est.)//$1.162 trillion (31 December 2012 est.)
$2.15 trillion (31 December 2013 est.)//$2.134 trillion (31 December 2012 est.)
Fiscal Capacity & Public FinanceBack to top ↑
- Revenue Mobilisation & Tax Administration
- Public Expenditure & Budget Management
- Sovereign Debt & Treasury Management
- Public Investment Management
47.6% of GDP (2013 est.)
-3.3% of GDP (2013 est.)
133% of GDP (2013 est.)//126.9% of GDP (2012 est.)
calendar year
Financial System Depth & AccessBack to top ↑
- Banking System Capacity
- Capital Markets Depth & Development
- Long-Term & Institutional Capital
- Financial Inclusion & Household Access
- Development & Policy Finance
$3.407 trillion (31 December 2013 est.)//$3.438 trillion (31 December 2012 est.)
$480.5 billion (31 December 2012 est.)//$431.5 billion (31 December 2011)//$318.1 billion (31 December 2010 est.)
17.4% of GDP (2013 est.)//16.9% of GDP (2012 est.)//16.4% of GDP (2011 est.)
Financial Regulation & IntegrityBack to top ↑
- Prudential Regulation & Supervision
- Financial Integrity & Illicit Finance Control
- Market Conduct & Consumer Protection
- Payment & Market Infrastructure Oversight
Financial Stability & Crisis ManagementBack to top ↑
- Macroprudential & Systemic Oversight
- Crisis Management, Resolution & Deposit Insurance
- External Liquidity & Financial Safety Nets
Sovereign Capital & External Financial PowerBack to top ↑
- Official Reserves Management
- Sovereign Wealth & Public Asset Management
- Currency Internationalisation & Reserve Status
- Capital Account & Flow Management
- International Financial Centre Capability
$181.7 billion (31 December 2012 est.)//$173.3 billion (31 December 2011 est.)
$2.604 trillion (31 December 2013 est.)//$2.516 trillion (31 December 2012 est.)
GINC Capability Domains · Chapter 11
Production and Innovation
🇮🇹 Italy’s output, industry and the engine of prosperity
Economic Output & ProductivityBack to top ↑
Italy has a diversified industrial economy, which is divided into a developed industrial north, dominated by private companies, and a less-developed, highly subsidized, agricultural south, where unemployment is higher. The Italian economy is driven in large part by the manufacture of high-quality consumer goods produced by small and medium-sized enterprises, many of them family-owned. Italy also has a sizable underground economy, which by some estimates accounts for as much as 17% of GDP. These activities are most common within the agriculture, construction, and service sectors. Italy is the third-largest economy in the euro-zone, but its exceptionally high public debt and structural impediments to growth have rendered it vulnerable to scrutiny by financial markets. Public debt has increased steadily since 2007, topping 133% of GDP in 2013, but investor concerns about Italy and the broader euro-zone crisis eased in 2013, bringing down Italy's borrowing costs on sovereign government debt from euro-era records. The government still faces pressure from investors and European partners to sustain its efforts to address Italy's long-standing structural impediments to growth, such as labor market inefficiencies and widespread tax evasion. In 2013 economic growth and labor market conditions deteriorated, with growth at -1.8% and unemployment rising to 12.4%, with youth unemployment around 40%. Italy's GDP is now 8% below its 2007 pre-crisis level.
$1.805 trillion (2013 est.)//$1.838 trillion (2012 est.)//$1.883 trillion (2011 est.)
-1.8% (2013 est.)//-2.4% (2012 est.)//0.4% (2011 est.)
$29,600 (2013 est.)//$29,800 (2012 est.)//$30,100 (2011 est.)
$2.068 trillion (2013 est.)
Labour & EmploymentBack to top ↑
- Employment & Labour Force Participation
- Labour Market Institutions & Wage Setting
- Employment Services & Skills Matching
- Labour Adjustment, Transition & Formalisation
25.74 million (2013 est.)
12.4% (2013 est.)//10.7% (2012 est.)
Industrial & Sectoral BaseBack to top ↑
- Manufacturing & Advanced Industry
- Foundational & Process Industries
- Agrifood & Primary Production
- Services Economy
fruits, vegetables, grapes, potatoes, sugar beets, soybeans, grain, olives; beef, dairy products; fish
tourism, machinery, iron and steel, chemicals, food processing, textiles, motor vehicles, clothing, footwear, ceramics
-2.7% (2013 est.)
Structural Transformation & ComplexityBack to top ↑
Business Dynamism & EntrepreneurshipBack to top ↑
- Entrepreneurship & Firm Creation
- Risk Capital & Scale-Up Finance
- Firm Growth, Exit & Renewal
- Competition & Market Contestability
Innovation & CommercialisationBack to top ↑
- Business Innovation Capability
- Research Commercialisation & Knowledge Transfer
- Intellectual Property & Intangible Assets
- Innovation Ecosystems & Clusters
Technology Adoption & DiffusionBack to top ↑
GINC Capability Domains · Chapter 12
Trade and Investment
🇮🇹 Italy’s markets, capital and the terms of global exchange
Overall tradeBack to top ↑
$633B of exports to 218 partners and $589B of imports from 209 in 2024, a surplus of $43.1B.
- Exports
- $633B218 partners
- Imports
- $589B209 partners
- Balance
- +$43.1Bsurplus
- Total trade
- $1.22T2024
ExportsBack to top ↑
Where its exports go
The largest partners in 2024, with each one's share of the nation's exports.
| Partner | Value | Share | |
|---|---|---|---|
| United States | $70.5B | 11% | |
| Germany | $66.1B | 10% | |
| France | $57.1B | 9.0% | |
| United Kingdom | $31.6B | 5.0% | |
| Switzerland | $31.2B | 4.9% | |
| Spain | $30.2B | 4.8% | |
| Turkey | $19.3B | 3.0% | |
| China | $18.8B | 3.0% | |
| Poland | $18.3B | 2.9% | |
| Belgium | $17.6B | 2.8% | |
| Netherlands | $17.0B | 2.7% | |
| Austria | $13.2B | 2.1% | |
| Romania | $11.2B | 1.8% | |
| Japan | $10.9B | 1.7% | |
| Czech Republic | $8.87B | 1.4% | |
| Canada | $8.26B | 1.3% | |
| United Arab Emirates | $8.21B | 1.3% | |
| Mexico | $7.92B | 1.3% | |
| South Korea | $7.45B | 1.2% | |
| Greece | $7.41B | 1.2% |
What it exports
The largest categories in 2024.
| Category | Value | Share | |
|---|---|---|---|
| Machinery, nuclear reactors, boilers | $108B | 17% | |
| Pharmaceutical products | $55.0B | 8.7% | |
| Vehicles other than railway, tramway | $46.6B | 7.4% | |
| Electrical, electronic equipment | $41.3B | 6.5% | |
| Pearls, precious stones, metals, coins | $25.8B | 4.1% | |
| Plastics | $24.3B | 3.8% | |
| Mineral fuels, oils, distillation products | $21.4B | 3.4% | |
| Articles of iron or steel | $19.8B | 3.1% | |
| Optical, photo, technical, medical apparatus | $16.6B | 2.6% | |
| Iron and steel | $14.2B | 2.2% | |
| Articles of apparel, not knit or crocheted | $13.9B | 2.2% | |
| Beverages, spirits and vinegar | $13.8B | 2.2% | |
| Furniture, lighting signs, prefabricated buildings | $13.7B | 2.2% | |
| Articles of leather, animal gut, harness, travel good | $13.4B | 2.1% | |
| Footwear, gaiters and the like | $13.3B | 2.1% |
ImportsBack to top ↑
Where its imports come from
The largest partners in 2024, with each one's share of the nation's imports.
| Partner | Value | Share | |
|---|---|---|---|
| Germany | $84.0B | 14% | |
| China | $51.8B | 8.8% | |
| France | $50.2B | 8.5% | |
| Netherlands | $36.0B | 6.1% | |
| Spain | $34.3B | 5.8% | |
| United States | $26.8B | 4.5% | |
| Belgium | $25.9B | 4.4% | |
| Switzerland | $16.8B | 2.8% | |
| Poland | $16.5B | 2.8% | |
| Austria | $12.6B | 2.1% | |
| Turkey | $12.5B | 2.1% | |
| Algeria | $11.8B | 2.0% | |
| Czech Republic | $9.25B | 1.6% | |
| India | $9.20B | 1.6% | |
| Romania | $8.80B | 1.5% | |
| United Kingdom | $8.64B | 1.5% | |
| Azerbaijan | $8.64B | 1.5% | |
| Ireland | $7.89B | 1.3% | |
| Hungary | $7.58B | 1.3% | |
| Libya | $7.51B | 1.3% |
What it imports
The largest categories in 2024.
| Category | Value | Share | |
|---|---|---|---|
| Mineral fuels, oils, distillation products | $80.6B | 14% | |
| Vehicles other than railway, tramway | $56.2B | 9.5% | |
| Machinery, nuclear reactors, boilers | $52.4B | 8.9% | |
| Electrical, electronic equipment | $47.5B | 8.1% | |
| Pharmaceutical products | $32.0B | 5.4% | |
| Organic chemicals | $29.1B | 4.9% | |
| Plastics | $25.5B | 4.3% | |
| Iron and steel | $21.1B | 3.6% | |
| Pearls, precious stones, metals, coins | $19.8B | 3.4% | |
| Optical, photo, technical, medical apparatus | $16.5B | 2.8% | |
| Copper | $9.67B | 1.6% | |
| Articles of apparel, knit or crocheted | $9.09B | 1.5% | |
| Articles of apparel, not knit or crocheted | $8.74B | 1.5% | |
| Aluminum | $8.27B | 1.4% | |
| Articles of iron or steel | $8.21B | 1.4% |
In a list, the bar runs to the largest in that list. The line is each figure’s history from 2000, drawn to its own peak: it shows the shape of the years, and the value shows the size.
External balanceBack to top ↑
-$2.4 billion (2013 est.)//-$14.88 billion (2012 est.)
Trade Facilitation & LogisticsBack to top ↑
Trade Policy & Market AccessBack to top ↑
- Trade Policy & Negotiation Capability
- Market Access & Agreements Network
- Trade Law & Enforcement
- Standards, Conformity & Quality Infrastructure
Digital & Services TradeBack to top ↑
- Services Trade Capability
- Digital Trade & E-Commerce
- Data Flows & Digital Trade Governance
- Tourism & Visitor Economy
Investment Attraction & ProjectionBack to top ↑
- Investment Attraction & Facilitation
- Investment Absorption & Linkages
- Outward Investment & Global Corporate Presence
$466.3 billion (31 December 2013 est.)//$457.8 billion (31 December 2012 est.)
$683.6 billion (31 December 2013 est.)//$653.3 billion (31 December 2012 est.)
Export Capability & SophisticationBack to top ↑
$474 billion (2013 est.)//$478.9 billion (2012 est.)
Germany 12.63%, France 11.11%, United States 6.84%, Switzerland 5.72%, United Kingdom 4.72%, Spain 4.48% (2013 est.)
engineering products, textiles and clothing, production machinery, motor vehicles, transport equipment, chemicals; food, beverages and tobacco; minerals, nonferrous metals
Global Value Chain PositionBack to top ↑
- Value Chain Participation & Integration
- Value Chain Position & Upgrading
- Regional Integration & Hub Anchoring
Economic Leverage & DependenceBack to top ↑
- Strategic Supply Security
- Concentration Risk & Revenue Stabilisation
- Economic Leverage & Coercion Resistance
$435.8 billion (2013 est.)//$453.5 billion (2012 est.)
Germany 14.73%, France 8.4%, China 8.4%, Russia 6.35%, Netherlands 5.85%, Spain 4.54%, Belgium 4.09% (2013 est.)
engineering products, chemicals, transport equipment, energy products, minerals and nonferrous metals, textiles and clothing; food, beverages, and tobacco
Italy · you are in
Historical Context
Foundations
GINC Capability Domains
Find in this brief · Italy