
Greece
Greece is a parliamentary republic in Europe, home to 11 million people, with its capital at Athens.
Contents
12 chapters
Foundations
01–03
At a glance
- Area
- 132Kkm²#97 World#12 Europe
- Population
- 10.8M#80 World#10 Europe
- GDP (market)
- $243B
- GDP (PPP)
- $267.1B#50 World#15 Europe
- GDP per capita
- $23.6K#63 World#29 Europe
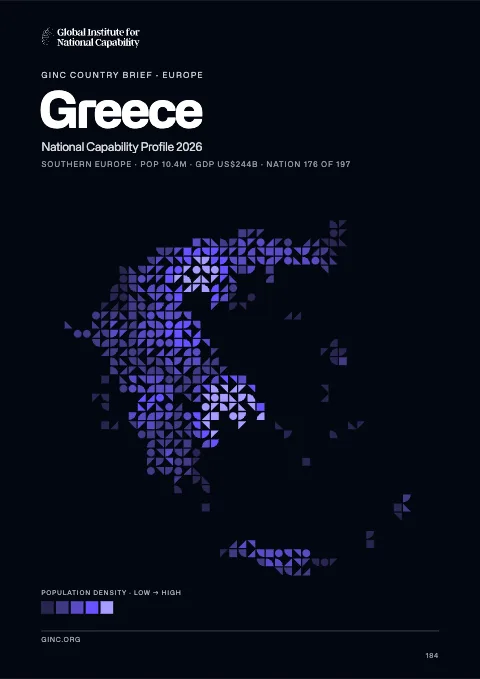
The whole brief
Greece National Capability Profile 2026
Foundations · Chapter 01
Historical Context
🇬🇷 Greece’s understanding the origins and evolution of the modern nation
BackgroundBack to top ↑
Greece achieved independence from the Ottoman Empire in 1830. During the second half of the 19th century and the first half of the 20th century, it gradually added neighboring islands and territories, most with Greek-speaking populations. In World War II, Greece was first invaded by Italy (1940) and subsequently occupied by Germany (1941-44); fighting endured in a protracted civil war between supporters of the king and other anti-communist and communist rebels. Following the latter's defeat in 1949, Greece joined NATO in 1952. In 1967, a group of military officers seized power, establishing a military dictatorship that suspended many political liberties and forced the king to flee the country. In 1974, democratic elections and a referendum created a parliamentary republic and abolished the monarchy. In 1981, Greece joined the EC (now the EU); it became the 12th member of the European Economic and Monetary Union in 2001. In 2010, the prospect of a Greek default on its euro-denominated debt created severe strains within the EMU and raised the question of whether a member country might voluntarily leave the common currency or be removed.
IndependenceBack to top ↑
1830 (from the Ottoman Empire)
National holidayBack to top ↑
Independence Day, 25 March (1821)
Foundations · Chapter 02
Geography
🇬🇷 Greece’s territory, resources and strategic position
Location and areaBack to top ↑
Southern Europe, bordering the Aegean Sea, Ionian Sea, and the Mediterranean Sea, between Albania and Turkey
39 00 N, 22 00 E
Europe
slightly smaller than Alabama
13,676 km
Terrain and resourcesBack to top ↑
mostly mountains with ranges extending into the sea as peninsulas or chains of islands
lignite, petroleum, iron ore, bauxite, lead, zinc, nickel, magnesite, marble, salt, hydropower potential
15,550 sq km (2007)
Settlement and hazardsBack to top ↑
severe earthquakes
strategic location dominating the Aegean Sea and southern approach to Turkish Straits; a peninsular country, possessing an archipelago of about 2,000 islands
OtherBack to top ↑
74.25 cu km (2011)
air pollution; water pollution
Foundations · Chapter 03
Environment
🇬🇷 Greece’s environmental conditions, resources and national resilience
ClimateBack to top ↑
temperate; mild, wet winters; hot, dry summers
Emissions and pollutionBack to top ↑
Water, waste and foodBack to top ↑
Resources and agreementsBack to top ↑
GINC Capability Domains · Chapter 04
Critical Technology
🇬🇷 Greece’s technology frontiers and the pursuit of national advantage
Two counts are set side by side for 2015–2024: on the left, the papers researchers in Greece published; on the right, the patent families that began there and were filed in more than one country. First by capability group, then group by group with each group’s capabilities. The badge on a card is the nation’s place among all nations. Papers are from GINC Research Analytics, patent families from GINC Patents.
Research by capability group
#33 WorldPapers published, 2015–2024
3,389
1,590
1,415
1,264
1,000
479
476
360
273
32
Patents by capability group
#44 WorldInternational patent families, 2015–2024
Advanced Materials & ManufacturingBack to top ↑
Research
#39 WorldPapers published, 2015–2024
Patents
#43 WorldInternational patent families, 2015–2024
Energy TechnologiesBack to top ↑
Research
#50 WorldPapers published, 2015–2024
Patents
#42 WorldInternational patent families, 2015–2024
Semiconductors & Advanced ComputingBack to top ↑
Research
#31 WorldPapers published, 2015–2024
No research topic: Semiconductor Design & EDA · Advanced Semiconductor Fabrication · Semiconductor Equipment & Materials · Advanced Packaging & Heterogeneous Integration
Patents
#39 WorldInternational patent families, 2015–2024
Artificial IntelligenceBack to top ↑
Research
#32 WorldPapers published, 2015–2024
Patents
#41 WorldInternational patent families, 2015–2024
Quantum TechnologiesBack to top ↑
Research
#38 WorldPapers published, 2015–2024
Patents
International patent families, 2015–2024
No international patent families on record for 2015–2024.
Connectivity, Cyber & Trust TechnologiesBack to top ↑
Research
#22 WorldPapers published, 2015–2024
Patents
#44 WorldInternational patent families, 2015–2024
Sensing, Timing & NavigationBack to top ↑
Research
#35 WorldPapers published, 2015–2024
Patents
#44 WorldInternational patent families, 2015–2024
Robotics & Autonomous SystemsBack to top ↑
Research
#27 WorldPapers published, 2015–2024
No research topic: Human-Machine Interfaces
Patents
#41 WorldInternational patent families, 2015–2024
Biotechnology & Health TechnologiesBack to top ↑
Research
#38 WorldPapers published, 2015–2024
Patents
#47 WorldInternational patent families, 2015–2024
Medicine and BioTech
Clinical research and life-science invention, drawn from the same series that drive the metric pages. Each card opens the full cross-country comparison.
Space TechnologiesBack to top ↑
Research
#27 WorldPapers published, 2015–2024
Patents
#44 WorldInternational patent families, 2015–2024
GINC Capability Domains · Chapter 05
Strategic Infrastructure
🇬🇷 Greece’s energy, connectivity and the material foundations of capability
Resource InfrastructureBack to top ↑
7,497 bbl/day (2012 est.)
17,020 bbl/day (2010 est.)
405,500 bbl/day (2010 est.)
10 million bbl (1 January 2013 est.)
462,000 bbl/day (2010 est.)
343,400 bbl/day (2011 est.)
183,100 bbl/day (2010 est.)
133,100 bbl/day (2010 est.)
6 million cu m (2011 est.)
4.2 billion cu m (2012 est.)
0 cu m (2011 est.)
4.376 billion cu m (2012 est.)
991.1 million cu m (1 January 2013 est.)
gas 1,329 km; oil 94 km (2013)
Agriculture & Food InfrastructureBack to top ↑
- Irrigation & Agricultural Water
- Livestock & Veterinary
- Fisheries & Aquaculture
- Storage, Cold Chain & Markets
Energy InfrastructureBack to top ↑
- Thermal Generation
- Nuclear Generation
- Nuclear Fuel Cycle & Radioactive Waste
- Hydropower
- Renewable Generation
- Transmission & Distribution
- System Control & Dispatch
- Storage & Fuel Supply
15.12 million kW (2010 est.)
56.2 billion kWh (2012 est.)
56.4 billion kWh (2010 est.)
4.122 billion kWh (2012 est.)
5.946 billion kWh (2012 est.)
69.5% of total installed capacity (2010 est.)
0% of total installed capacity (2010 est.)
16.2% of total installed capacity (2010 est.)
10.5% of total installed capacity (2010 est.)
85.6 million Mt (2012 est.)
Water, Sanitation & Waste InfrastructureBack to top ↑
- Dams, Reservoirs & Flood Defence
- Water Supply & Treatment
- Bulk Water Transfer & Desalination
- Wastewater & Sanitation
- Solid Waste & Recycling
Advanced ManufacturingBack to top ↑
- Materials & Inputs
- Chemicals & Hazardous Process Industry
- Production Systems
- Supply Chain & Ecosystem
- Workforce & Innovation
Transport InfrastructureBack to top ↑
- Seaports & Terminals
- Air Infrastructure
- Air Navigation & Traffic Management
- Inland Waterways & Ferries
- Rail Infrastructure
- Roads & Bridges
- Logistics, Multimodal & Border Infrastructure
- Postal & Parcel
77 (2013)
9 (2013)
6 km (the 6 km long Corinth Canal crosses the Isthmus of Corinth; it shortens a sea voyage by 325 km) (2012)
Communications & Digital InfrastructureBack to top ↑
- Subsea Cables & International Gateways
- Core & Backbone Networks
- Mobile & Wireless Networks
- Spectrum & Broadcasting
- Data Centres, Compute & Cloud
- Data Resources
- AI Tools & Applications
5.461 million (2012)
13.354 million (2012)
4.971 million (2009)
3.201 million (2012)
.gr
Financial InfrastructureBack to top ↑
- Currency & Reserves
- Payments & Settlement Systems
- Markets, Exchanges & Depositories
- Banks, Insurers & Systemic Institutions
Social InfrastructureBack to top ↑
- Health Infrastructure
- Public Health & Laboratories
- Medical Supply & Stockpiles
- Education & Skills Infrastructure
- Research & Scientific Facilities
- Housing, Community & Social Services
- Government & Public Administration
- Cultural, Community & Recreational Infrastructure
- Justice & Corrections
- Emergency Services & Civil Protection
- Hydrometeorology & Early Warning
Space, Aerospace & Defence InfrastructureBack to top ↑
GINC Capability Domains · Chapter 06
National Security
🇬🇷 Greece’s force, intelligence and the defence of the nation
Disputes and terrorismBack to top ↑
Greece and Turkey continue discussions to resolve their complex maritime, air, territorial, and boundary disputes in the Aegean Sea; Greece rejects the use of the name Macedonia or Republic of Macedonia; the mass migration of unemployed Albanians still remains a problem for developed countries, chiefly Greece and Italy
Force Generation & MobilisationBack to top ↑
Hellenic Army (Ellinikos Stratos, ES), Hellenic Navy (Elliniko Polemiko Navtiko, EPN), Hellenic Air Force (Elliniki Polemiki Aeroporia, EPA) (2013)
19-45 years of age for compulsory military service; during wartime the law allows for recruitment beginning January of the year of inductee's 18th birthday, thus including 17 year olds; 18 years of age for volunteers; conscript service obligation is 1 year for the Army and 9 months for the Air Force and Navy; women are eligible for voluntary military service (2014)
1.72% of GDP (2012)//2.31% of GDP (2011)//2.63% of GDP (2010)
Forces under arms
Active-duty strength on the Correlates of War series, which reaches back to 1816 and so carries a nation’s whole record of mobilisation rather than its present establishment. The card opens the full cross-country comparison.
Intelligence & AssessmentBack to top ↑
- Imagery & Geospatial Intelligence
- Signals & Cyber Intelligence
- Technical & Measurement Intelligence
- Open-Source & Financial Intelligence
- Human Intelligence & Counterintelligence
- All-Source Analysis & Warning
Joint Command, Projection & SustainmentBack to top ↑
- Command, Control & Communications
- Strategic Lift & Mobility
- Expeditionary & Peace Operations
- Operational Sustainment & War Reserves
- Defence Industrial Mobilisation
- CBRN Defence
Land PowerBack to top ↑
- Combined Arms Manoeuvre
- Land Fires
- Battlefield Aviation & Uncrewed Systems
- Special Operations & Irregular Warfare
Maritime PowerBack to top ↑
- Maritime Security & Constabulary
- Sea Denial & Undersea Warfare
- Sea Control
- Amphibious & Expeditionary Operations
Air PowerBack to top ↑
- Air Sovereignty & Policing
- Control of the Air
- Air Strike & Interdiction
- Airborne ISR, Early Warning & Battle Management
Strategic Strike & Missile DefenceBack to top ↑
Space OperationsBack to top ↑
Cyber & Electromagnetic OperationsBack to top ↑
Nuclear DeterrenceBack to top ↑
GINC Capability Domains · Chapter 07
Human Capital
🇬🇷 Greece’s population, health and the skills that sustain capability
DemographyBack to top ↑
10,775,557 (July 2014 est.)
0.01% (2014 est.)
8.8 births/1,000 population (2014 est.)
11 deaths/1,000 population (2014 est.)
1.41 children born/woman (2014 est.)
31.2 (2010 est.)
76.2%
Migration and urbanisationBack to top ↑
2.32 migrant(s)/1,000 population (2014 est.)
ATHENS (capital) 3.414 million; Thessaloniki 883,000 (2011)
Welfare and equityBack to top ↑
20% (2009 est.)
34.3 (2012 est.)//33.5 (2011 est.)
DisplacementBack to top ↑
Early Childhood DevelopmentBack to top ↑
Foundational EducationBack to top ↑
4.1% of GDP (2005)
Advanced EducationBack to top ↑
Technical & Vocational SkillsBack to top ↑
Digital & AI CompetenceBack to top ↑
Generative AI adoption
Modelled share of working-age adults using generative AI, from Microsoft telemetry scaled to each country’s 15–64 population. A measure of how fast a workforce is absorbing the technology rather than of how much of it a nation builds. The card opens the full cross-country comparison.
Lifelong Learning & ReskillingBack to top ↑
Research Talent & Knowledge CreationBack to top ↑
Population HealthBack to top ↑
3 deaths/100,000 live births (2010)
20.1% (2008)
0.1% (2009 est.)
8,800 (2009 est.)
fewer than 500 (2009 est.)
Health System CapabilityBack to top ↑
9% of GDP (2011)
6.04 physicians/1,000 population (2008)
4.9 beds/1,000 population (2009)
GINC Capability Domains · Chapter 08
Governance and Integrity
🇬🇷 Greece’s institutions, law and the integrity of the state
State structureBack to top ↑
parliamentary republic
13 regions (perifereies, singular - perifereia) and 1 autonomous monastic state* (aftonomi monastiki politeia); Agion Oros* (Mount Athos), Anatoliki Makedonia kai Thraki (East Macedonia and Thrace), Attiki (Attica), Dytiki Ellada (West Greece), Dytiki Makedonia (West Macedonia), Ionia Nisia (Ionian Islands), Ipeiros (Epirus), Kentriki Makedonia (Central Macedonia), Kriti (Crete), Notio Aigaio (South Aegean), Peloponnisos (Peloponnese), Sterea Ellada (Central Greece), Thessalia (Thessaly), Voreio Aigaio (North Aegean)
many previous; latest entered into force 11 June 1975; amended 1986, 2001, 2008 (2013)
18 years of age; universal and compulsory
Political Institutions & Civic ParticipationBack to top ↑
- Electoral Management & Integrity
- Legislature & Deliberative Institutions
- Citizen Participation & Civic Space
unicameral Hellenic Parliament or Vouli ton Ellinon (300 seats; members elected by direct popular vote to serve four-year terms)
Anticapitalist Left Cooperation for the Overthrow or ANTARSYA [Petros KONSTANTINOU]//Coalition of the Radical Left or SYRIZA [Alexis TSIPRAS]//Communist Party of Greece or KKE [Dimitris KOUTSOUMBAS]//Democratic Left or DIMAR [Fotis KOUVELIS]//Ecologist Greens [Nikos CHRYSOGELOS]//Golden Dawn [Nikolaos MICHALOLIAKOS]//Independent Greeks or ANEL [Panagiotis (Panos) KAMMENOS]//New Democracy or ND [Antonis SAMARAS]//Panhellenic Socialist Movement or PASOK [Evangelos VENIZELOS]//Popular Orthodox Rally or LAOS [Georgios KARATZAFERIS]
Supreme Administration of Civil Servants Unions or ADEDY [Spyros PAPASPYROS]//Federation of Greek Industries or SEV [Dimitris DASKALOPOULOS]//General Confederation of Greek Workers or GSEE [Ioannis PANAGOPOULOS]
Justice System & Fundamental RightsBack to top ↑
- Judicial Independence & Court Capability
- Access to Justice & Legal Services
- Fundamental Rights Protection
- Human Rights Institutions & Equality Bodies
civil legal system based on Roman law
accepts compulsory ICJ jurisdiction with reservations; accepts ICCt jurisdiction
Internal Security & OrderBack to top ↑
a gateway to Europe for traffickers smuggling cannabis and heroin from the Middle East and Southwest Asia to the West and precursor chemicals to the East; some South American cocaine transits or is consumed in Greece; money laundering related to drug trafficking and organized crime
Regulatory Governance & Strategic ControlsBack to top ↑
- Regulatory Quality & Better Regulation
- Regulatory Delivery & Independent Regulators
- Strategic Controls & Economic Security Administration
Government Effectiveness & Public AdministrationBack to top ↑
- Centre of Government & Policy Coordination
- Civil Service & Public Workforce
- Digital Government & Service Delivery
- Legal Identity & Civil Registration
- Statistical & Data Capability
Public Integrity & Anti-CorruptionBack to top ↑
Transparency, Oversight & AccountabilityBack to top ↑
- Right to Information & Open Government
- Independent Oversight & Supreme Audit
- Independent Media & Journalist Safety
National Resilience & Crisis ManagementBack to top ↑
GINC Capability Domains · Chapter 09
Information and Influence
🇬🇷 Greece’s identity, media and the projection of influence
Identity and cultureBack to top ↑
Greek (official) 99%, other (includes English and French) 1%
Greek Orthodox (official) 98%, Muslim 1.3%, other 0.7%
population: Greek 93%, other (foreign citizens) 7% (2001 census)
Greek cross (white cross on blue field; arms equal length)
nine equal horizontal stripes of blue alternating with white; a blue square bearing a white cross appears in the upper hoist-side corner; the cross symbolizes Greek Orthodoxy, the established religion of the country; there is no agreed upon meaning for the nine stripes or for the colors; the exact shade of blue has never been set by law and has varied from a light to a dark blue over time
Diplomatic Statecraft & Global NetworksBack to top ↑
- Diplomatic Network & Consular Reach
- Multilateral Leadership & Norm Setting
- Agenda-Setting & Convening
- Mediation & Crisis Diplomacy
Australia Group, BIS, BSEC, CD, CE, CERN, EAPC, EBRD, ECB, EIB, EMU, ESA, EU, FAO, FATF, IAEA, IBRD, ICAO, ICC (national committees), ICRM, IDA, IEA, IFAD, IFC, IFRCS, IGAD (partners), IHO, ILO, IMF, IMO, IMSO, Interpol, IOC, IOM, IPU, ISO, ITSO, ITU, ITUC (NGOs), MIGA, NATO, NEA, NSG, OAS (observer), OECD, OIF, OPCW, OSCE, PCA, Schengen Convention, SELEC, UN, UNCTAD, UNESCO, UNHCR, UNIDO, UNIFIL, UNMISS, UNWTO, UPU, WCO, WFTU (NGOs), WHO, WIPO, WMO, WTO, ZC
Alliances & Security CooperationBack to top ↑
Development Cooperation & Global AssistanceBack to top ↑
Culture, Language & Education DiplomacyBack to top ↑
- Cultural & Language Institutes
- Creative Industries & Cultural Export Reach
- Heritage & Cultural Institutions
- Education Diplomacy & Alumni Networks
- Sports & Major Events
Diaspora & Global CommunitiesBack to top ↑
Information Environment & Strategic CommunicationBack to top ↑
- Strategic Communications & Public Diplomacy
- International Media & Broadcasting
- Information Defence & Counter-Interference
Broadcast media dominated by the private sector; roughly 150 private TV channels, about ten of which broadcast nation-wide; 1 government owned terrestrial TV channel with national coverage; 3 privately owned satellite channels; multi-channel satellite and cable TV services available; upwards of 1,500 radio stations, all of them privately owned; government owned broadcaster has 2 national radio stations (2014)
GINC Capability Domains · Chapter 10
Financial Strength
🇬🇷 Greece’s fiscal depth, reserves and the capacity to act
Monetary & Currency CapabilityBack to top ↑
- Monetary Policy & Price Stability
- Exchange Rate & External Account Management
- Currency Issuance & Digital Money
-0.8% (2013 est.)//1.5% (2012 est.)
euros (EUR) per US dollar -//0.7634 (2013 est.)//0.7752 (2012 est.)//0.755 (2010 est.)//0.7198 (2009 est.)//0.6827 (2008 est.)
0.75% (31 December 2013)//1.5% (31 December 2010)
7.1% (31 December 2013 est.)//7.33% (31 December 2012 est.)
$112.1 billion (31 December 2013 est.)//$116.2 billion (31 December 2012 est.)
$247.4 billion (31 December 2013 est.)//$250 billion (31 December 2012 est.)
Fiscal Capacity & Public FinanceBack to top ↑
- Revenue Mobilisation & Tax Administration
- Public Expenditure & Budget Management
- Sovereign Debt & Treasury Management
- Public Investment Management
43.7% of GDP (2013 est.)
-4% of GDP (2013 est.)
175% of GDP (2013 est.)//156.9% of GDP (2012 est.)
calendar year
Financial System Depth & AccessBack to top ↑
- Banking System Capacity
- Capital Markets Depth & Development
- Long-Term & Institutional Capital
- Financial Inclusion & Household Access
- Development & Policy Finance
$325.1 billion (31 December 2013 est.)//$343.9 billion (31 December 2012 est.)
$44.58 billion (31 December 2012 est.)//$33.65 billion (31 December 2011)//$NA (31 December 2010 est.)
12.2% of GDP (2013 est.)//10.2% of GDP (2012 est.)//6.2% of GDP (2011 est.)
Financial Regulation & IntegrityBack to top ↑
- Prudential Regulation & Supervision
- Financial Integrity & Illicit Finance Control
- Market Conduct & Consumer Protection
- Payment & Market Infrastructure Oversight
Financial Stability & Crisis ManagementBack to top ↑
- Macroprudential & Systemic Oversight
- Crisis Management, Resolution & Deposit Insurance
- External Liquidity & Financial Safety Nets
Sovereign Capital & External Financial PowerBack to top ↑
- Official Reserves Management
- Sovereign Wealth & Public Asset Management
- Currency Internationalisation & Reserve Status
- Capital Account & Flow Management
- International Financial Centre Capability
$7.255 billion (31 December 2012 est.)//$7.255 billion (31 December 2012 est.)
$568.7 billion (30 September 2013 est.)//$577.2 billion (2012)
GINC Capability Domains · Chapter 11
Production and Innovation
🇬🇷 Greece’s output, industry and the engine of prosperity
Economic Output & ProductivityBack to top ↑
Greece has a capitalist economy with a public sector accounting for about 40% of GDP and with per capita GDP about two-thirds that of the leading euro-zone economies. Tourism provides 18% of GDP. Immigrants make up nearly one-fifth of the work force, mainly in agricultural and unskilled jobs. Greece is a major beneficiary of EU aid, equal to about 3.3% of annual GDP. The Greek economy averaged growth of about 4% per year between 2003 and 2007, but the economy went into recession in 2009 as a result of the world financial crisis, tightening credit conditions, and Athens' failure to address a growing budget deficit. By 2013 the economy had contracted 26%, compared with the pre-crisis level of 2007. Greece met the EU's Growth and Stability Pact budget deficit criterion of no more than 3% of GDP in 2007-08, but violated it in 2009, with the deficit reaching 15% of GDP. Austerity measures have reduced the deficit to about 4% in 2013, including government debt payments. Deteriorating public finances, inaccurate and misreported statistics, and consistent underperformance on reforms prompted major credit rating agencies to downgrade Greece's international debt rating in late 2009, and led the country into a financial crisis. Under intense pressure from the EU and international market participants, the government adopted a medium-term austerity program that includes cutting government spending, decreasing tax evasion, overhauling the health-care and pension systems, and reforming the labor and product markets. Athens, however, faces long-term challenges to continue pushing through unpopular reforms in the face of widespread unrest from the country's powerful labor unions and the general public. In April 2010 a leading credit agency assigned Greek debt its lowest possible credit rating; in May 2010, the International Monetary Fund and Euro-Zone governments provided Greece emergency short- and medium-term loans worth $147 billion so that the country could make debt repayments to creditors. In exchange for the largest bailout ever assembled, the government announced combined spending cuts and tax increases totaling $40 billion over three years, on top of the tough austerity measures already taken. Greece, however, struggled to meet 2010 targets set by the EU and the IMF, especially after Eurostat - the EU's statistical office - revised upward Greece's deficit and debt numbers for 2009 and 2010. European leaders and the IMF agreed in October 2011 to provide Athens a second bailout package of $169 billion. The second deal however, called for holders of Greek government bonds to write down a significant portion of their holdings. As Greek banks held a significant portion of sovereign debt, the banking system was adversely affected by the write down and €41 billion of the second bailout package was set aside to ensure the banking system was adequately capitalized. In exchange for the second loan Greece promised to introduce an additional $7.8 billion in austerity measures during 2013-15. However, the massive austerity cuts have prolonged Greece's economic recession and depressed tax revenues. Throughout 2013, Greece's lenders called on Athens to step up efforts to increase tax collection, dismiss public servants, privatize public enterprises, and rein in health spending. In June 2013 Prime Minister Antonis SAMARAS's efforts to meet bailout conditions led to the departure of one party, the Democratic Left, from the governing coalition when his government made the controversial decision to shut down and restructure the state-owned television and radio company. Subsequent reluctance to institute further cuts and delays in meeting public sector reform targets prompted Greek lenders to withhold bailout fund disbursements until December 2013. However, investor confidence began to show signs of strengthening by the end of 2013 as leading macroeconomic indicators suggested the economy’s freefall had been arrested.
$267.1 billion (2013 est.)//$277.7 billion (2012 est.)//$296.6 billion (2011 est.)
-3.8% (2013 est.)//-6.4% (2012 est.)//-7.1% (2011 est.)
$23,600 (2013 est.)//$24,600 (2012 est.)//$26,200 (2011 est.)
$243.3 billion (2013 est.)
Labour & EmploymentBack to top ↑
- Employment & Labour Force Participation
- Labour Market Institutions & Wage Setting
- Employment Services & Skills Matching
- Labour Adjustment, Transition & Formalisation
4.918 million (2013 est.)
27.9% (2013 est.)//24.3% (2012 est.)
Industrial & Sectoral BaseBack to top ↑
- Manufacturing & Advanced Industry
- Foundational & Process Industries
- Agrifood & Primary Production
- Services Economy
wheat, corn, barley, sugar beets, olives, tomatoes, wine, tobacco, potatoes; beef, dairy products
tourism, food and tobacco processing, textiles, chemicals, metal products; mining, petroleum
-3.5% (2013 est.)
Structural Transformation & ComplexityBack to top ↑
Business Dynamism & EntrepreneurshipBack to top ↑
- Entrepreneurship & Firm Creation
- Risk Capital & Scale-Up Finance
- Firm Growth, Exit & Renewal
- Competition & Market Contestability
Innovation & CommercialisationBack to top ↑
- Business Innovation Capability
- Research Commercialisation & Knowledge Transfer
- Intellectual Property & Intangible Assets
- Innovation Ecosystems & Clusters
Technology Adoption & DiffusionBack to top ↑
GINC Capability Domains · Chapter 12
Trade and Investment
🇬🇷 Greece’s markets, capital and the terms of global exchange
Overall tradeBack to top ↑
$51.4B of exports to 210 partners and $91.2B of imports from 194 in 2024, a deficit of $39.8B.
- Exports
- $51.4B210 partners
- Imports
- $91.2B194 partners
- Balance
- −$39.8Bdeficit
- Total trade
- $143B2024
ExportsBack to top ↑
Where its exports go
The largest partners in 2024, with each one's share of the nation's exports.
| Partner | Value | Share | |
|---|---|---|---|
| Italy | $4.92B | 9.6% | |
| Germany | $3.43B | 6.7% | |
| Cyprus | $3.13B | 6.1% | |
| United States | $2.36B | 4.6% | |
| Romania | $2.17B | 4.2% | |
| United Kingdom | $2.09B | 4.1% | |
| Bulgaria | $1.76B | 3.4% | |
| Ukraine | $1.61B | 3.1% | |
| Lebanon | $1.57B | 3.1% | |
| Turkey | $1.46B | 2.8% | |
| France | $1.42B | 2.8% | |
| Gibraltar | $1.34B | 2.6% | |
| Spain | $1.33B | 2.6% | |
| Libya | $1.19B | 2.3% | |
| Poland | $1.17B | 2.3% | |
| Netherlands | $1.16B | 2.3% | |
| South Korea | $1.10B | 2.1% | |
| North Macedonia | $1.04B | 2.0% | |
| Israel | $1.01B | 2.0% | |
| Egypt | $974M | 1.9% |
What it exports
The largest categories in 2024.
| Category | Value | Share | |
|---|---|---|---|
| Mineral fuels, oils, distillation products | $15.3B | 30% | |
| Pharmaceutical products | $3.25B | 6.3% | |
| Aluminum | $2.76B | 5.4% | |
| Electrical, electronic equipment | $2.33B | 4.5% | |
| Vegetable, fruit, nut food preparations | $1.78B | 3.5% | |
| Machinery, nuclear reactors, boilers | $1.70B | 3.3% | |
| Dairy products, eggs, honey, edible products | $1.60B | 3.1% | |
| Plastics | $1.59B | 3.1% | |
| Tobacco and manufactures tobacco substitutes | $1.59B | 3.1% | |
| Edible fruits, nuts, peel of citrus fruit, melons | $1.55B | 3.0% | |
| Animal, vegetable fats and oils, cleavage products | $1.27B | 2.5% | |
| Copper | $1.03B | 2.0% | |
| Fish, crustaceans, molluscs, aquatics invertebrates | $1.00B | 1.9% | |
| Articles of iron or steel | $964M | 1.9% | |
| Optical, photo, technical, medical apparatus | $820M | 1.6% |
ImportsBack to top ↑
Where its imports come from
The largest partners in 2024, with each one's share of the nation's imports.
| Partner | Value | Share | |
|---|---|---|---|
| Germany | $9.42B | 10% | |
| China | $8.10B | 8.9% | |
| Italy | $7.41B | 8.1% | |
| Iraq | $5.41B | 5.9% | |
| Netherlands | $4.91B | 5.4% | |
| Turkey | $4.59B | 5.0% | |
| France | $4.31B | 4.7% | |
| Kazakhstan | $4.23B | 4.6% | |
| Spain | $3.26B | 3.6% | |
| Bulgaria | $2.71B | 3.0% | |
| Libya | $2.62B | 2.9% | |
| Belgium | $2.34B | 2.6% | |
| United States | $2.29B | 2.5% | |
| Russia | $1.90B | 2.1% | |
| Poland | $1.72B | 1.9% | |
| Saudi Arabia | $1.65B | 1.8% | |
| South Korea | $1.38B | 1.5% | |
| Egypt | $1.31B | 1.4% | |
| India | $1.20B | 1.3% | |
| Azerbaijan | $1.18B | 1.3% |
What it imports
The largest categories in 2024.
| Category | Value | Share | |
|---|---|---|---|
| Mineral fuels, oils, distillation products | $24.0B | 26% | |
| Electrical, electronic equipment | $7.00B | 7.7% | |
| Machinery, nuclear reactors, boilers | $6.60B | 7.2% | |
| Vehicles other than railway, tramway | $5.08B | 5.6% | |
| Pharmaceutical products | $4.23B | 4.6% | |
| Plastics | $3.25B | 3.6% | |
| Organic chemicals | $2.43B | 2.7% | |
| Iron and steel | $2.02B | 2.2% | |
| Aluminum | $1.94B | 2.1% | |
| Meat and edible meat offal | $1.81B | 2.0% | |
| Optical, photo, technical, medical apparatus | $1.75B | 1.9% | |
| Paper and paperboard, articles of pulp, paper and board | $1.51B | 1.7% | |
| Dairy products, eggs, honey, edible products | $1.46B | 1.6% | |
| Ships, boats, and other floating structures | $1.43B | 1.6% | |
| Copper | $1.25B | 1.4% |
In a list, the bar runs to the largest in that list. The line is each figure’s history from 2000, drawn to its own peak: it shows the shape of the years, and the value shows the size.
External balanceBack to top ↑
$2.021 billion (2013 est.)//-$5.933 billion (2012 est.)
Trade Facilitation & LogisticsBack to top ↑
Trade Policy & Market AccessBack to top ↑
- Trade Policy & Negotiation Capability
- Market Access & Agreements Network
- Trade Law & Enforcement
- Standards, Conformity & Quality Infrastructure
Digital & Services TradeBack to top ↑
- Services Trade Capability
- Digital Trade & E-Commerce
- Data Flows & Digital Trade Governance
- Tourism & Visitor Economy
Investment Attraction & ProjectionBack to top ↑
- Investment Attraction & Facilitation
- Investment Absorption & Linkages
- Outward Investment & Global Corporate Presence
$40.1 billion (31 December 2013 est.)//$37.8 billion (31 December 2012 est.)
$43.31 billion (31 December 2013 est.)//$43.46 billion (31 December 2012 est.)
Export Capability & SophisticationBack to top ↑
$30.39 billion (2013 est.)//$28.31 billion (2012 est.)
Turkey 11.6%, Italy 9.9%, Germany 6.5%, Bulgaria 4.9% (2013 est.)
food and beverages, manufactured goods, petroleum products, chemicals, textiles
Global Value Chain PositionBack to top ↑
- Value Chain Participation & Integration
- Value Chain Position & Upgrading
- Regional Integration & Hub Anchoring
Economic Leverage & DependenceBack to top ↑
- Strategic Supply Security
- Concentration Risk & Revenue Stabilisation
- Economic Leverage & Coercion Resistance
$50.58 billion (2013 est.)//$53.53 billion (2012 est.)
Russia 13.8%, Germany 9.5%, Italy 7.9%, Iraq 7.8%, Netherlands 4.7%, France 4.5%, China 4.5% (2013 est.)
machinery, transport equipment, fuels, chemicals
Greece · you are in
Historical Context
Foundations
GINC Capability Domains
Find in this brief · Greece