
South Korea
South Korea is a republic in East and Southeast Asia, home to 49 million people, with its capital at Seoul.
Contents
12 chapters
Foundations
01–03
At a glance
- Area
- 99.7Kkm²#109 World#13 E & SE Asia
- Population
- 49M#26 World#7 E & SE Asia
- GDP (market)
- $1.2T
- GDP (PPP)
- $1.7T#12 World#2 E & SE Asia
- GDP per capita
- $33.2K#41 World#7 E & SE Asia
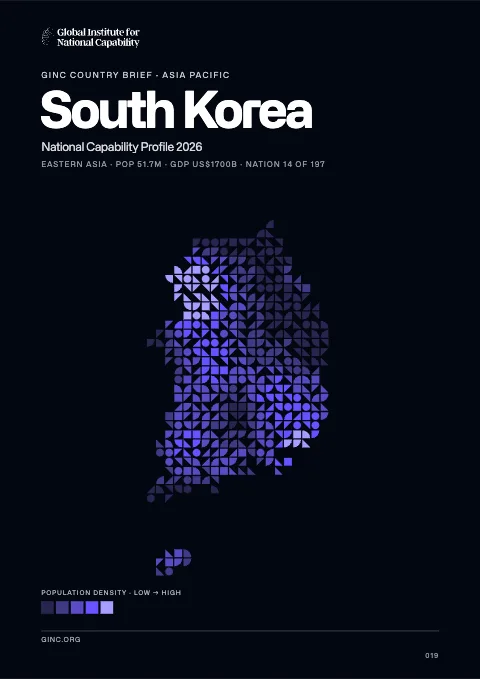
The whole brief
South Korea National Capability Profile 2026
Foundations · Chapter 01
Historical Context
🇰🇷 South Korea’s understanding the origins and evolution of the modern nation
BackgroundBack to top ↑
An independent kingdom for much of its long history, Korea was occupied by Japan beginning in 1905 following the Russo-Japanese War. In 1910, Tokyo formally annexed the entire Peninsula. Korea regained its independence following Japan's surrender to the United States in 1945. After World War II, a democratic-based government (Republic of Korea, ROK) was set up in the southern half of the Korean Peninsula while a communist-style government was installed in the north (Democratic People's Republic of Korea, DPRK). During the Korean War (1950-53), US troops and UN forces fought alongside ROK soldiers to defend South Korea from a DPRK invasion supported by China and the Soviet Union. A 1953 armistice split the peninsula along a demilitarized zone at about the 38th parallel. PARK Chung-hee took over leadership of the country in a 1961 coup. During his regime, from 1961 to 1979, South Korea achieved rapid economic growth, with per capita income rising to roughly 17 times the level of North Korea. South Korea held its first free presidential election under a revised democratic constitution in 1987, with former ROK Army general ROH Tae-woo winning a close race. In 1993, KIM Young-sam (1993-98) became the first civilian president of South Korea's new democratic era. President KIM Dae-jung (1998-2003) won the Nobel Peace Prize in 2000 for his contributions to South Korean democracy and his "Sunshine" policy of engagement with North Korea. President PARK Geun-hye, daughter of former ROK President PARK Chung-hee, took office in February 2013 and is South Korea's first female leader. South Korea holds a non-permanent seat (2013-14) on the UN Security Council and will host the 2018 Winter Olympic Games. Serious tensions with North Korea have punctuated inter-Korean relations in recent years, including the North's attacks on a South Korean ship and island in 2010, nuclear and missile tests, and its temporary closure of the inter-Korean Kaesong Industrial Complex in 2013.
IndependenceBack to top ↑
15 August 1945 (from Japan)
National holidayBack to top ↑
Liberation Day, 15 August (1945)
Foundations · Chapter 02
Geography
🇰🇷 South Korea’s territory, resources and strategic position
Location and areaBack to top ↑
Eastern Asia, southern half of the Korean Peninsula bordering the Sea of Japan and the Yellow Sea
37 00 N, 127 30 E
Asia
slightly smaller than Pennsylvania; slightly larger than Indiana
2,413 km
Terrain and resourcesBack to top ↑
mostly hills and mountains; wide coastal plains in west and south
coal, tungsten, graphite, molybdenum, lead, hydropower potential
8,804 sq km (2003)
Settlement and hazardsBack to top ↑
occasional typhoons bring high winds and floods; low-level seismic activity common in southwest
strategic location on Korea Strait
OtherBack to top ↑
69.7 cu km (2011)
air pollution in large cities; acid rain; water pollution from the discharge of sewage and industrial effluents; drift net fishing
Foundations · Chapter 03
Environment
🇰🇷 South Korea’s environmental conditions, resources and national resilience
ClimateBack to top ↑
temperate, with rainfall heavier in summer than winter
Emissions and pollutionBack to top ↑
Water, waste and foodBack to top ↑
Resources and agreementsBack to top ↑
GINC Capability Domains · Chapter 04
Critical Technology
🇰🇷 South Korea’s technology frontiers and the pursuit of national advantage
Two counts are set side by side for 2015–2024: on the left, the papers researchers in South Korea published; on the right, the patent families that began there and were filed in more than one country. First by capability group, then group by group with each group’s capabilities. The badge on a card is the nation’s place among all nations. Papers are from GINC Research Analytics, patent families from GINC Patents.
Research by capability group
#7 WorldPapers published, 2015–2024
12,465
12,321
10,592
7,045
3,460
3,149
2,894
2,460
1,593
132
Patents by capability group
#4 WorldInternational patent families, 2015–2024
39,885
39,171
33,029
29,676
15,572
11,334
11,165
8,522
563
504
Advanced Materials & ManufacturingBack to top ↑
Research
#9 WorldPapers published, 2015–2024
Patents
#5 WorldInternational patent families, 2015–2024
Energy TechnologiesBack to top ↑
Research
#4 WorldPapers published, 2015–2024
Patents
#3 WorldInternational patent families, 2015–2024
Semiconductors & Advanced ComputingBack to top ↑
Research
#8 WorldPapers published, 2015–2024
No research topic: Semiconductor Design & EDA · Advanced Semiconductor Fabrication · Semiconductor Equipment & Materials · Advanced Packaging & Heterogeneous Integration
Patents
#3 WorldInternational patent families, 2015–2024
Artificial IntelligenceBack to top ↑
Research
#8 WorldPapers published, 2015–2024
Patents
#4 WorldInternational patent families, 2015–2024
Quantum TechnologiesBack to top ↑
Research
#15 WorldPapers published, 2015–2024
Patents
#5 WorldInternational patent families, 2015–2024
Connectivity, Cyber & Trust TechnologiesBack to top ↑
Research
#9 WorldPapers published, 2015–2024
Patents
#4 WorldInternational patent families, 2015–2024
Sensing, Timing & NavigationBack to top ↑
Research
#10 WorldPapers published, 2015–2024
Patents
#5 WorldInternational patent families, 2015–2024
Robotics & Autonomous SystemsBack to top ↑
Research
#8 WorldPapers published, 2015–2024
No research topic: Human-Machine Interfaces
Patents
#4 WorldInternational patent families, 2015–2024
Biotechnology & Health TechnologiesBack to top ↑
Research
#15 WorldPapers published, 2015–2024
Patents
#4 WorldInternational patent families, 2015–2024
Medicine and BioTech
Clinical research and life-science invention, drawn from the same series that drive the metric pages. Each card opens the full cross-country comparison.
Space TechnologiesBack to top ↑
Research
#12 WorldPapers published, 2015–2024
Patents
#5 WorldInternational patent families, 2015–2024
GINC Capability Domains · Chapter 05
Strategic Infrastructure
🇰🇷 South Korea’s energy, connectivity and the material foundations of capability
Resource InfrastructureBack to top ↑
0 bbl/day (2012 est.)
0 bbl/day (2010 est.)
2.59 million bbl/day (2012 est.)
0 bbl
2.83 million bbl/day (2012 est.)
2.301 million bbl/day (2012 est.)
944,700 bbl/day (2010 est.)
794,000 bbl/day (2010 est.)
424.9 million cu m (2012 est.)
49.66 billion cu m (2012 est.)
0 cu m (2012 est.)
47.34 billion cu m (2012 est.)
5.269 billion cu m (1 January 2013 est.)
gas 2,216 km; oil 16 km; refined products 889 km (2013)
Agriculture & Food InfrastructureBack to top ↑
- Irrigation & Agricultural Water
- Livestock & Veterinary
- Fisheries & Aquaculture
- Storage, Cold Chain & Markets
Energy InfrastructureBack to top ↑
- Thermal Generation
- Nuclear Generation
- Nuclear Fuel Cycle & Radioactive Waste
- Hydropower
- Renewable Generation
- Transmission & Distribution
- System Control & Dispatch
- Storage & Fuel Supply
84.66 million kW (2010 est.)
485.1 billion kWh (2011 est.)
449.5 billion kWh (2010 est.)
0 kWh (2012 est.)
0 kWh (2012 est.)
74.5% of total installed capacity (2010 est.)
21.9% of total installed capacity (2010 est.)
2% of total installed capacity (2010 est.)
1.5% of total installed capacity (2010 est.)
611 million Mt (2011 est.)
Water, Sanitation & Waste InfrastructureBack to top ↑
- Dams, Reservoirs & Flood Defence
- Water Supply & Treatment
- Bulk Water Transfer & Desalination
- Wastewater & Sanitation
- Solid Waste & Recycling
Advanced ManufacturingBack to top ↑
- Materials & Inputs
- Chemicals & Hazardous Process Industry
- Production Systems
- Supply Chain & Ecosystem
- Workforce & Innovation
Transport InfrastructureBack to top ↑
- Seaports & Terminals
- Air Infrastructure
- Air Navigation & Traffic Management
- Inland Waterways & Ferries
- Rail Infrastructure
- Roads & Bridges
- Logistics, Multimodal & Border Infrastructure
- Postal & Parcel
111 (2013)
466 (2013)
1,600 km (most navigable only by small craft) (2011)
Communications & Digital InfrastructureBack to top ↑
- Subsea Cables & International Gateways
- Core & Backbone Networks
- Mobile & Wireless Networks
- Spectrum & Broadcasting
- Data Centres, Compute & Cloud
- Data Resources
- AI Tools & Applications
30.1 million (2012)
53.625 million (2012)
39.4 million (2009)
315,697 (2012)
.kr
Financial InfrastructureBack to top ↑
- Currency & Reserves
- Payments & Settlement Systems
- Markets, Exchanges & Depositories
- Banks, Insurers & Systemic Institutions
Social InfrastructureBack to top ↑
- Health Infrastructure
- Public Health & Laboratories
- Medical Supply & Stockpiles
- Education & Skills Infrastructure
- Research & Scientific Facilities
- Housing, Community & Social Services
- Government & Public Administration
- Cultural, Community & Recreational Infrastructure
- Justice & Corrections
- Emergency Services & Civil Protection
- Hydrometeorology & Early Warning
Space, Aerospace & Defence InfrastructureBack to top ↑
GINC Capability Domains · Chapter 06
National Security
🇰🇷 South Korea’s force, intelligence and the defence of the nation
Disputes and terrorismBack to top ↑
Military Demarcation Line within the 4-km-wide Demilitarized Zone has separated North from South Korea since 1953; periodic incidents with North Korea in the Yellow Sea over the Northern Limit Line, which South Korea claims as a maritime boundary; South Korea and Japan claim Liancourt Rocks (Tok-do/Take-shima), occupied by South Korea since 1954
Force Generation & MobilisationBack to top ↑
Republic of Korea Army; Navy (includes Marine Corps); Air Force (2011)
20-30 years of age for compulsory military service, with middle school education required; conscript service obligation - 21 months (Army, Marines), 23 months (Navy), 24 months (Air Force); 18-26 years of age for voluntary military service; women, in service since 1950, admitted to 7 service branches, including infantry, but excluded from artillery, armor, anti-air, and chaplaincy corps; HIV-positive individuals are exempt from military service (2012)
2.8% of GDP (2012)//2.77% of GDP (2011)//2.8% of GDP (2010)
Forces under arms
Active-duty strength on the Correlates of War series, which reaches back to 1816 and so carries a nation’s whole record of mobilisation rather than its present establishment. The card opens the full cross-country comparison.
Intelligence & AssessmentBack to top ↑
- Imagery & Geospatial Intelligence
- Signals & Cyber Intelligence
- Technical & Measurement Intelligence
- Open-Source & Financial Intelligence
- Human Intelligence & Counterintelligence
- All-Source Analysis & Warning
Joint Command, Projection & SustainmentBack to top ↑
- Command, Control & Communications
- Strategic Lift & Mobility
- Expeditionary & Peace Operations
- Operational Sustainment & War Reserves
- Defence Industrial Mobilisation
- CBRN Defence
Land PowerBack to top ↑
- Combined Arms Manoeuvre
- Land Fires
- Battlefield Aviation & Uncrewed Systems
- Special Operations & Irregular Warfare
Maritime PowerBack to top ↑
- Maritime Security & Constabulary
- Sea Denial & Undersea Warfare
- Sea Control
- Amphibious & Expeditionary Operations
Air PowerBack to top ↑
- Air Sovereignty & Policing
- Control of the Air
- Air Strike & Interdiction
- Airborne ISR, Early Warning & Battle Management
Strategic Strike & Missile DefenceBack to top ↑
Space OperationsBack to top ↑
Cyber & Electromagnetic OperationsBack to top ↑
Nuclear DeterrenceBack to top ↑
GINC Capability Domains · Chapter 07
Human Capital
🇰🇷 South Korea’s population, health and the skills that sustain capability
DemographyBack to top ↑
49,039,986 (July 2014 est.)
0.16% (2014 est.)
8.26 births/1,000 population (2014 est.)
6.63 deaths/1,000 population (2014 est.)
1.25 children born/woman (2014 est.)
30.3 (2011 est.)
80%
Migration and urbanisationBack to top ↑
0 migrant(s)/1,000 population (2014 est.)
SEOUL (capital) 9.736 million; Busan (Pusan) 3.372 million; Incheon (Inch'on) 2.622 million; Daegu (Taegu) 2.447 million; Daejon (Taejon) 1.538 million; Gwangju (Kwangju) 1.503 million (2011)
Welfare and equityBack to top ↑
16% (2009 est.)
31.1 (2011 est.)//35.8 (2000)
Early Childhood DevelopmentBack to top ↑
Foundational EducationBack to top ↑
5% of GDP (2009)
Advanced EducationBack to top ↑
Technical & Vocational SkillsBack to top ↑
Digital & AI CompetenceBack to top ↑
Generative AI adoption
Modelled share of working-age adults using generative AI, from Microsoft telemetry scaled to each country’s 15–64 population. A measure of how fast a workforce is absorbing the technology rather than of how much of it a nation builds. The card opens the full cross-country comparison.
Lifelong Learning & ReskillingBack to top ↑
Research Talent & Knowledge CreationBack to top ↑
Population HealthBack to top ↑
16 deaths/100,000 live births (2010)
7.7% (2008)
less than 0.1% (2009 est.)
9,500 (2009 est.)
fewer than 500 (2009 est.)
Health System CapabilityBack to top ↑
7.2% of GDP (2011)
2.02 physicians/1,000 population (2010)
10.3 beds/1,000 population (2009)
GINC Capability Domains · Chapter 08
Governance and Integrity
🇰🇷 South Korea’s institutions, law and the integrity of the state
State structureBack to top ↑
republic
9 provinces (do, singular and plural), 6 metropolitan cities (gwangyoksi, singular and plural), 1 special city, and 1 special self-governing city
effective 17 July 1948; amended several times, last in 1987 (2013)
19 years of age; universal
Political Institutions & Civic ParticipationBack to top ↑
- Electoral Management & Integrity
- Legislature & Deliberative Institutions
- Citizen Participation & Civic Space
unicameral National Assembly or Gukhoe (300 seats; 246 members elected in single-seat constituencies, 54 elected by proportional representation; members serve four-year terms)
Justice Party [CHEON Ho-sun]//Liberty Forward Party or LFP (merged with NFP in October 2012)//New Frontier Party (NFP) or Saenuri (formerly Grand National Party) [HWANG Woo-yea]//New Politics Alliance for Diplomacy or NPAD [KIM Han-gil and AHN Cheol-soo] (merger of the Democratic Party or DP (formerly DUP) [Kim Han-gil] and the New Political Vision Party or NPVP [AHN Cheol-soo] in March 2014)//Progressive Justice Party or PJP [ROH Hoe-chan and CHO Joon-ho]//Unified Progressive Party or UPP [LEE Jung-hee]
Catholic Priests' Association for Justice//Citizen's Coalition for Economic Justice//Federation of Korean Industries//Federation of Korean Trade Unions//Korean Confederation of Trade Unions//Korean Veterans' Association//Lawyers for a Democratic Society//National Council of Churches//People's Solidarity for Participatory Democracy
Justice System & Fundamental RightsBack to top ↑
- Judicial Independence & Court Capability
- Access to Justice & Legal Services
- Fundamental Rights Protection
- Human Rights Institutions & Equality Bodies
mixed legal system combining European civil law, Anglo-American law, and Chinese classical thought
has not submitted an ICJ jurisdiction declaration; accepts ICCt jurisdiction
Internal Security & OrderBack to top ↑
Regulatory Governance & Strategic ControlsBack to top ↑
- Regulatory Quality & Better Regulation
- Regulatory Delivery & Independent Regulators
- Strategic Controls & Economic Security Administration
Government Effectiveness & Public AdministrationBack to top ↑
- Centre of Government & Policy Coordination
- Civil Service & Public Workforce
- Digital Government & Service Delivery
- Legal Identity & Civil Registration
- Statistical & Data Capability
Public Integrity & Anti-CorruptionBack to top ↑
Transparency, Oversight & AccountabilityBack to top ↑
- Right to Information & Open Government
- Independent Oversight & Supreme Audit
- Independent Media & Journalist Safety
National Resilience & Crisis ManagementBack to top ↑
GINC Capability Domains · Chapter 09
Information and Influence
🇰🇷 South Korea’s identity, media and the projection of influence
Identity and cultureBack to top ↑
Korean, English (widely taught in junior high and high school)
Christian 31.6% (Protestant 24%, Roman Catholic 7.6%), Buddhist 24.2%, other or unknown 0.9%, none 43.3% (2010 survey)
homogeneous (except for about 20,000 Chinese)
taegeuk (yin yang symbol)
white with a red (top) and blue yin-yang symbol in the center; there is a different black trigram from the ancient I Ching (Book of Changes) in each corner of the white field; the South Korean national flag is called Taegukki; white is a traditional Korean color and represents peace and purity; the blue section represents the negative cosmic forces of the yin, while the red symbolizes the opposite positive forces of the yang; each trigram (kwae) denotes one of the four universal elements, which together express the principle of movement and harmony
Diplomatic Statecraft & Global NetworksBack to top ↑
- Diplomatic Network & Consular Reach
- Multilateral Leadership & Norm Setting
- Agenda-Setting & Convening
- Mediation & Crisis Diplomacy
ADB, AfDB (nonregional member), APEC, ARF, ASEAN (dialogue partner), Australia Group, BIS, CD, CICA, CP, EAS, EBRD, FAO, FATF, G-20, IADB, IAEA, IBRD, ICAO, ICC (national committees), ICRM, IDA, IEA, IFAD, IFC, IFRCS, IHO, ILO, IMF, IMO, IMSO, Interpol, IOC, IOM, IPU, ISO, ITSO, ITU, ITUC (NGOs), LAIA (observer), MIGA, MINURSO, NEA, NSG, OAS (observer), OECD, OPCW, OSCE (partner), Pacific Alliance (observer), Paris Club (associate), PCA, PIF (partner), SAARC (observer), SICA (observer), UN, UN Security Council (temporary), UNAMID, UNCTAD, UNESCO, UNHCR, UNIDO, UNIFIL, UNISFA, UNMIL, UNMISS, UNMOGIP, UNOCI, UNWTO, UPU, WCO, WHO, WIPO, WMO, WTO, ZC
Alliances & Security CooperationBack to top ↑
Development Cooperation & Global AssistanceBack to top ↑
Culture, Language & Education DiplomacyBack to top ↑
- Cultural & Language Institutes
- Creative Industries & Cultural Export Reach
- Heritage & Cultural Institutions
- Education Diplomacy & Alumni Networks
- Sports & Major Events
Diaspora & Global CommunitiesBack to top ↑
Information Environment & Strategic CommunicationBack to top ↑
- Strategic Communications & Public Diplomacy
- International Media & Broadcasting
- Information Defence & Counter-Interference
multiple national TV networks with 2 of the 3 largest networks publicly operated; the largest privately owned network, Seoul Broadcasting Service (SBS), has ties with other commercial TV networks; cable and satellite TV subscription services available; publicly operated radio broadcast networks and many privately owned radio broadcasting networks, each with multiple affiliates, and independent local stations (2010)
GINC Capability Domains · Chapter 10
Financial Strength
🇰🇷 South Korea’s fiscal depth, reserves and the capacity to act
Monetary & Currency CapabilityBack to top ↑
- Monetary Policy & Price Stability
- Exchange Rate & External Account Management
- Currency Issuance & Digital Money
1.1% (2013 est.)//2.2% (2012 est.)
South Korean won (KRW) per US dollar -//1,107.3 (2013 est.)//1,126.47 (2012 est.)//1,156.1 (2010 est.)//1,276.93 (2009)//1,101.7 (2008)
2.5% (31 December 2013)//2.75% (31 December 2012)
4.7% (31 December 2013 est.)//5.39% (31 December 2012 est.)
$465.2 billion (31 December 2013 est.)//$426 billion (31 December 2012 est.)
$1.764 trillion (31 December 2013 est.)//$1.664 trillion (31 December 2012 est.)
Fiscal Capacity & Public FinanceBack to top ↑
- Revenue Mobilisation & Tax Administration
- Public Expenditure & Budget Management
- Sovereign Debt & Treasury Management
- Public Investment Management
24.7% of GDP (2013 est.)
0.7% of GDP (2013 est.)
35.8% of GDP (2013 est.)//35.5% of GDP (2012 est.)
calendar year
Financial System Depth & AccessBack to top ↑
- Banking System Capacity
- Capital Markets Depth & Development
- Long-Term & Institutional Capital
- Financial Inclusion & Household Access
- Development & Policy Finance
$1.266 trillion (31 December 2013 est.)//NA% (31 December 2012 est.)
$1.068 trillion (31 December 2013 est.)//$1.078 trillion (28 December 2012)//$904.7 billion (29December 2011 est.)
31.9% of GDP (2013 est.)//31.4% of GDP (2012 est.)//31.9% of GDP (2011 est.)
Financial Regulation & IntegrityBack to top ↑
- Prudential Regulation & Supervision
- Financial Integrity & Illicit Finance Control
- Market Conduct & Consumer Protection
- Payment & Market Infrastructure Oversight
Financial Stability & Crisis ManagementBack to top ↑
- Macroprudential & Systemic Oversight
- Crisis Management, Resolution & Deposit Insurance
- External Liquidity & Financial Safety Nets
Sovereign Capital & External Financial PowerBack to top ↑
- Official Reserves Management
- Sovereign Wealth & Public Asset Management
- Currency Internationalisation & Reserve Status
- Capital Account & Flow Management
- International Financial Centre Capability
$341.8 billion (31 December 2013 est.)//$327 billion (31 December 2012 est.)
$430.9 billion (31 December 2013 est.)//$425.1 billion (31 December 2012 est.)
GINC Capability Domains · Chapter 11
Production and Innovation
🇰🇷 South Korea’s output, industry and the engine of prosperity
Economic Output & ProductivityBack to top ↑
South Korea over the past four decades has demonstrated incredible growth and global integration to become a high-tech industrialized economy. In the 1960s, GDP per capita was comparable with levels in the poorer countries of Africa and Asia. In 2004, South Korea joined the trillion-dollar club of world economies, and is currently the world's 12th largest economy. Initially, a system of close government and business ties, including directed credit and import restrictions, made this success possible. The government promoted the import of raw materials and technology at the expense of consumer goods, and encouraged savings and investment over consumption. The Asian financial crisis of 1997-98 exposed longstanding weaknesses in South Korea's development model including high debt/equity ratios and massive short-term foreign borrowing. GDP plunged by 6.9% in 1998, and then recovered by 9% in 1999-2000. South Korea adopted numerous economic reforms following the crisis, including greater openness to foreign investment and imports. Growth moderated to about 4% annually between 2003 and 2007. South Korea's export focused economy was hit hard by the 2008 global economic downturn, but quickly rebounded in subsequent years, reaching 6.3% growth in 2010. The US-Korea Free Trade Agreement was ratified by both governments in 2011 and went into effect in March 2012. Throughout 2012 and 2013 the economy experienced sluggish growth because of market slowdowns in the United States, China, and the Eurozone. The administration in 2014 is likely to face the challenge of balancing heavy reliance on exports with developing domestic-oriented sectors, such as services. The South Korean economy's long term challenges include a rapidly aging population, inflexible labor market, dominance of large conglomerates (chaebols), and heavy reliance on exports, which comprise about half of GDP.
$1.666 trillion (2013 est.)//$1.62 trillion (2012 est.)//$1.587 trillion (2011 est.)
2.8% (2013 est.)//2% (2012 est.)//3.7% (2011 est.)
$33,200 (2013 est.)//$32,400 (2012 est.)//$31,900 (2011 est.)
$1.198 trillion (2013 est.)
Labour & EmploymentBack to top ↑
- Employment & Labour Force Participation
- Labour Market Institutions & Wage Setting
- Employment Services & Skills Matching
- Labour Adjustment, Transition & Formalisation
25.86 million (2013 est.)
3.2% (2013 est.)//3.2% (2012 est.)
Industrial & Sectoral BaseBack to top ↑
- Manufacturing & Advanced Industry
- Foundational & Process Industries
- Agrifood & Primary Production
- Services Economy
rice, root crops, barley, vegetables, fruit; cattle, pigs, chickens, milk, eggs; fish
electronics, telecommunications, automobile production, chemicals, shipbuilding, steel
2.5% (2013 est.)
Structural Transformation & ComplexityBack to top ↑
Business Dynamism & EntrepreneurshipBack to top ↑
- Entrepreneurship & Firm Creation
- Risk Capital & Scale-Up Finance
- Firm Growth, Exit & Renewal
- Competition & Market Contestability
Innovation & CommercialisationBack to top ↑
- Business Innovation Capability
- Research Commercialisation & Knowledge Transfer
- Intellectual Property & Intangible Assets
- Innovation Ecosystems & Clusters
Technology Adoption & DiffusionBack to top ↑
GINC Capability Domains · Chapter 12
Trade and Investment
🇰🇷 South Korea’s markets, capital and the terms of global exchange
Overall tradeBack to top ↑
$764B of exports to 218 partners and $624B of imports from 222 in 2024, a surplus of $140B.
- Exports
- $764B218 partners
- Imports
- $624B222 partners
- Balance
- +$140Bsurplus
- Total trade
- $1.39T2024
ExportsBack to top ↑
Where its exports go
The largest partners in 2024, with each one's share of the nation's exports.
| Partner | Value | Share | |
|---|---|---|---|
| China | $155B | 20% | |
| United States | $135B | 18% | |
| Vietnam | $58.3B | 7.6% | |
| Taiwan | $41.9B | 5.5% | |
| Hong Kong | $36.6B | 4.8% | |
| Singapore | $29.5B | 3.9% | |
| Japan | $28.7B | 3.8% | |
| India | $21.2B | 2.8% | |
| Mexico | $19.3B | 2.5% | |
| Australia | $16.6B | 2.2% | |
| Germany | $13.3B | 1.7% | |
| Malaysia | $11.9B | 1.6% | |
| Canada | $11.7B | 1.5% | |
| Philippines | $10.1B | 1.3% | |
| Poland | $9.32B | 1.2% | |
| Turkey | $9.19B | 1.2% | |
| Thailand | $9.06B | 1.2% | |
| Indonesia | $8.89B | 1.2% | |
| France | $8.10B | 1.1% | |
| United Kingdom | $7.79B | 1.0% |
What it exports
The largest categories in 2024.
| Category | Value | Share | |
|---|---|---|---|
| Electrical, electronic equipment | $268B | 35% | |
| Vehicles other than railway, tramway | $94.3B | 12% | |
| Machinery, nuclear reactors, boilers | $90.0B | 12% | |
| Mineral fuels, oils, distillation products | $54.2B | 7.1% | |
| Plastics | $37.8B | 4.9% | |
| Ships, boats, and other floating structures | $28.3B | 3.7% | |
| Iron and steel | $24.2B | 3.2% | |
| Organic chemicals | $23.7B | 3.1% | |
| Optical, photo, technical, medical apparatus | $15.1B | 2.0% | |
| Pharmaceutical products | $12.8B | 1.7% | |
| Essential oils, perfumes, cosmetics, toiletries | $10.0B | 1.3% | |
| Articles of iron or steel | $9.75B | 1.3% | |
| Miscellaneous chemical products | $8.58B | 1.1% | |
| Rubbers | $8.55B | 1.1% | |
| Inorganic chemicals, precious metal compound, isotope | $6.67B | 0.9% |
ImportsBack to top ↑
Where its imports come from
The largest partners in 2024, with each one's share of the nation's imports.
| Partner | Value | Share | |
|---|---|---|---|
| China | $139B | 22% | |
| United States | $71.4B | 11% | |
| Japan | $46.8B | 7.5% | |
| Saudi Arabia | $31.5B | 5.0% | |
| Taiwan | $29.8B | 4.8% | |
| Australia | $29.4B | 4.7% | |
| Vietnam | $28.4B | 4.6% | |
| Germany | $21.7B | 3.5% | |
| United Arab Emirates | $17.9B | 2.9% | |
| Qatar | $14.1B | 2.3% | |
| Indonesia | $12.6B | 2.0% | |
| Malaysia | $12.6B | 2.0% | |
| Singapore | $10.8B | 1.7% | |
| Iraq | $9.03B | 1.4% | |
| Kuwait | $8.81B | 1.4% | |
| Netherlands | $8.39B | 1.3% | |
| France | $8.02B | 1.3% | |
| Italy | $7.45B | 1.2% | |
| Mexico | $7.37B | 1.2% | |
| Russia | $6.87B | 1.1% |
What it imports
The largest categories in 2024.
| Category | Value | Share | |
|---|---|---|---|
| Mineral fuels, oils, distillation products | $160B | 26% | |
| Electrical, electronic equipment | $120B | 19% | |
| Machinery, nuclear reactors, boilers | $66.3B | 11% | |
| Optical, photo, technical, medical apparatus | $22.4B | 3.6% | |
| Vehicles other than railway, tramway | $19.8B | 3.2% | |
| Ores slag and ash | $19.5B | 3.1% | |
| Organic chemicals | $14.1B | 2.3% | |
| Iron and steel | $13.9B | 2.2% | |
| Plastics | $13.7B | 2.2% | |
| Inorganic chemicals, precious metal compound, isotope | $9.76B | 1.6% | |
| Pharmaceutical products | $9.18B | 1.5% | |
| Aluminum | $8.67B | 1.4% | |
| Articles of iron or steel | $8.00B | 1.3% | |
| Miscellaneous chemical products | $7.84B | 1.3% | |
| Articles of apparel, not knit or crocheted | $7.60B | 1.2% |
In a list, the bar runs to the largest in that list. The line is each figure’s history from 2000, drawn to its own peak: it shows the shape of the years, and the value shows the size.
External balanceBack to top ↑
$55.69 billion (2013 est.)//$43.34 billion (2012 est.)
Trade Facilitation & LogisticsBack to top ↑
Trade Policy & Market AccessBack to top ↑
- Trade Policy & Negotiation Capability
- Market Access & Agreements Network
- Trade Law & Enforcement
- Standards, Conformity & Quality Infrastructure
Digital & Services TradeBack to top ↑
- Services Trade Capability
- Digital Trade & E-Commerce
- Data Flows & Digital Trade Governance
- Tourism & Visitor Economy
Investment Attraction & ProjectionBack to top ↑
- Investment Attraction & Facilitation
- Investment Absorption & Linkages
- Outward Investment & Global Corporate Presence
$152.3 billion (31 December 2013 est.)//$147.2 billion (31 December 2012 est.)
$223.2 billion (31 December 2013 est.)//$196.4 billion (31 December 2012 est.)
Export Capability & SophisticationBack to top ↑
$557.3 billion (2013 est.)//$547.9 billion (2012 est.)
China 24.5%, US 10.7%, Japan 7.1%, Hong Kong 6%, Singapore 4.2% (2012 est.)
semiconductors, wireless telecommunications equipment, motor vehicles, auto parts, computers, display, home appliances, wire telecommunication equipment, steel, ships, petrochemicals
Global Value Chain PositionBack to top ↑
- Value Chain Participation & Integration
- Value Chain Position & Upgrading
- Regional Integration & Hub Anchoring
Economic Leverage & DependenceBack to top ↑
- Strategic Supply Security
- Concentration Risk & Revenue Stabilisation
- Economic Leverage & Coercion Resistance
$516.6 billion (2013 est.)//$519.6 billion (2012 est.)
China 15.6%, Japan 12.4%, US 8.3%, Saudi Arabia 7.6%, Qatar 4.9%, Australia 4.4% (2011 est.)
machinery, electronics and electronic equipment, oil, steel, optical instruments, transport equipment, organic chemicals, plastics
South Korea · you are in
Historical Context
Foundations
GINC Capability Domains
Find in this brief · South Korea