
Philippines
Philippines is a republic in East and Southeast Asia, home to 108 million people, with its capital at Manila.
Contents
12 chapters
Foundations
01–03
At a glance
- Area
- 300Kkm²#73 World#9 E & SE Asia
- Population
- 107.7M#12 World#3 E & SE Asia
- GDP (market)
- $272B
- GDP (PPP)
- $454.3B#31 World#7 E & SE Asia
- GDP per capita
- $4.7K#166 World#13 E & SE Asia
The whole brief
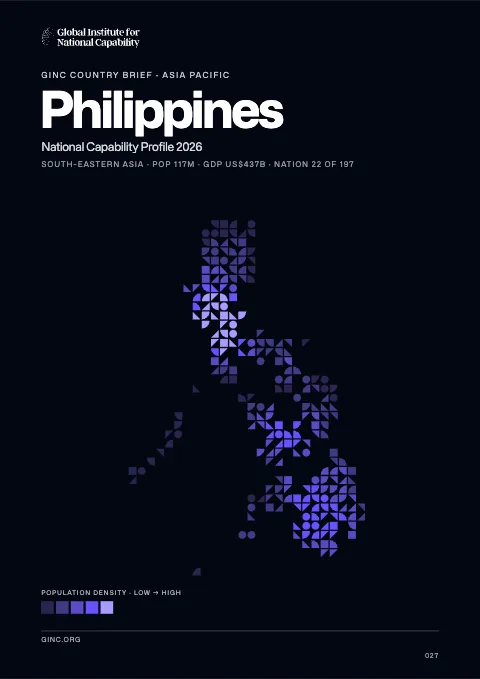
Philippines National Capability Profile 2026
Foundations · Chapter 01
Historical Context
🇵🇭 the Philippines’ understanding the origins and evolution of the modern nation
BackgroundBack to top ↑
The Philippine Islands became a Spanish colony during the 16th century; they were ceded to the US in 1898 following the Spanish-American War. In 1935 the Philippines became a self-governing commonwealth. Manuel QUEZON was elected president and was tasked with preparing the country for independence after a 10-year transition. In 1942 the islands fell under Japanese occupation during World War II, and US forces and Filipinos fought together during 1944-45 to regain control. On 4 July 1946 the Republic of the Philippines attained its independence. A 20-year rule by Ferdinand MARCOS ended in 1986, when a "people power" movement in Manila ("EDSA 1") forced him into exile and installed Corazon AQUINO as president. Her presidency was hampered by several coup attempts that prevented a return to full political stability and economic development. Fidel RAMOS was elected president in 1992. His administration was marked by increased stability and by progress on economic reforms. In 1992, the US closed its last military bases on the islands. Joseph ESTRADA was elected president in 1998. He was succeeded by his vice-president, Gloria MACAPAGAL-ARROYO, in January 2001 after ESTRADA's stormy impeachment trial on corruption charges broke down and another "people power" movement ("EDSA 2") demanded his resignation. MACAPAGAL-ARROYO was elected to a six-year term as president in May 2004. Her presidency was marred by several corruption allegations but the Philippine economy was one of the few to avoid contraction following the 2008 global financial crisis, expanding each year of her administration. Benigno AQUINO III was elected to a six-year term as president in May 2010. The Philippine Government faces threats from several groups, some of which are on the US Government's Foreign Terrorist Organization list. Manila has waged a decades-long struggle against ethnic Moro insurgencies in the southern Philippines, which has led to a peace accord with the Moro National Liberation Front and ongoing peace talks with the Moro Islamic Liberation Front. The decades-long Maoist-inspired New People's Army insurgency also operates through much of the country. The Philippines faces increased tension with China over disputed territorial and maritime claims in the South China Sea.
IndependenceBack to top ↑
12 June 1898 (independence proclaimed from Spain); 4 July 1946 (from the US)
National holidayBack to top ↑
Independence Day, 12 June (1898); note - 12 June 1898 was date of declaration of independence from Spain; 4 July 1946 was date of independence from the US
Foundations · Chapter 02
Geography
🇵🇭 the Philippines’ territory, resources and strategic position
Location and areaBack to top ↑
Southeastern Asia, archipelago between the Philippine Sea and the South China Sea, east of Vietnam
13 00 N, 122 00 E
Southeast Asia
slightly less than twice the size of Georgia; slightly larger than Arizona
0 km
36,289 km
Terrain and resourcesBack to top ↑
mostly mountains with narrow to extensive coastal lowlands
timber, petroleum, nickel, cobalt, silver, gold, salt, copper
18,790 sq km (2006)
Settlement and hazardsBack to top ↑
astride typhoon belt, usually affected by 15 and struck by five to six cyclonic storms each year; landslides; active volcanoes; destructive earthquakes; tsunamis
the Philippine archipelago is made up of 7,107 islands; favorably located in relation to many of Southeast Asia's main water bodies: the South China Sea, Philippine Sea, Sulu Sea, Celebes Sea, and Luzon Strait
OtherBack to top ↑
479 cu km (2011)
uncontrolled deforestation especially in watershed areas; soil erosion; air and water pollution in major urban centers; coral reef degradation; increasing pollution of coastal mangrove swamps that are important fish breeding grounds
Foundations · Chapter 03
Environment
🇵🇭 the Philippines’ environmental conditions, resources and national resilience
ClimateBack to top ↑
tropical marine; northeast monsoon (November to April); southwest monsoon (May to October)
Emissions and pollutionBack to top ↑
Water, waste and foodBack to top ↑
Resources and agreementsBack to top ↑
GINC Capability Domains · Chapter 04
Critical Technology
🇵🇭 the Philippines’ technology frontiers and the pursuit of national advantage
Two counts are set side by side for 2015–2024: on the left, the papers researchers in the Philippines published; on the right, the patent families that began there and were filed in more than one country. First by capability group, then group by group with each group’s capabilities. The badge on a card is the nation’s place among all nations. Papers are from GINC Research Analytics, patent families from GINC Patents.
Research by capability group
#62 WorldPapers published, 2015–2024
1,292
507
275
231
145
141
96
36
19
7
Patents by capability group
#57 WorldInternational patent families, 2015–2024
Advanced Materials & ManufacturingBack to top ↑
Research
#74 WorldPapers published, 2015–2024
Patents
#71 WorldInternational patent families, 2015–2024
Energy TechnologiesBack to top ↑
Research
#73 WorldPapers published, 2015–2024
Patents
#68 WorldInternational patent families, 2015–2024
Semiconductors & Advanced ComputingBack to top ↑
Research
#75 WorldPapers published, 2015–2024
No research topic: Semiconductor Design & EDA · Advanced Semiconductor Fabrication · Semiconductor Equipment & Materials · Advanced Packaging & Heterogeneous Integration
Patents
#34 WorldInternational patent families, 2015–2024
Artificial IntelligenceBack to top ↑
Research
#55 WorldPapers published, 2015–2024
Patents
#65 WorldInternational patent families, 2015–2024
Quantum TechnologiesBack to top ↑
Research
#93 WorldPapers published, 2015–2024
Patents
International patent families, 2015–2024
No international patent families on record for 2015–2024.
Connectivity, Cyber & Trust TechnologiesBack to top ↑
Research
#73 WorldPapers published, 2015–2024
Patents
#48 WorldInternational patent families, 2015–2024
Sensing, Timing & NavigationBack to top ↑
Research
#63 WorldPapers published, 2015–2024
Patents
#68 WorldInternational patent families, 2015–2024
Robotics & Autonomous SystemsBack to top ↑
Research
#67 WorldPapers published, 2015–2024
No research topic: Human-Machine Interfaces
Patents
#65 WorldInternational patent families, 2015–2024
Biotechnology & Health TechnologiesBack to top ↑
Research
#53 WorldPapers published, 2015–2024
Patents
#62 WorldInternational patent families, 2015–2024
Medicine and BioTech
Clinical research and life-science invention, drawn from the same series that drive the metric pages. Each card opens the full cross-country comparison.
Space TechnologiesBack to top ↑
Research
#55 WorldPapers published, 2015–2024
Patents
#53 WorldInternational patent families, 2015–2024
GINC Capability Domains · Chapter 05
Strategic Infrastructure
🇵🇭 the Philippines’ energy, connectivity and the material foundations of capability
Resource InfrastructureBack to top ↑
25,240 bbl/day (2012 est.)
20,090 bbl/day (2010 est.)
182,000 bbl/day (2010 est.)
138.5 million bbl (1 January 2013 est.)
181,300 bbl/day (2010 est.)
315,600 bbl/day (2011 est.)
17,810 bbl/day (2010 est.)
147,900 bbl/day (2010 est.)
3.91 billion cu m (2012 est.)
2.86 billion cu m (2010 est.)
0 cu m (2011 est.)
0 cu m (2011 est.)
98.54 billion cu m (1 January 2013 est.)
gas 567 km; oil 138 km; refined products 185 km (2013)
Agriculture & Food InfrastructureBack to top ↑
- Irrigation & Agricultural Water
- Livestock & Veterinary
- Fisheries & Aquaculture
- Storage, Cold Chain & Markets
Energy InfrastructureBack to top ↑
- Thermal Generation
- Nuclear Generation
- Nuclear Fuel Cycle & Radioactive Waste
- Hydropower
- Renewable Generation
- Transmission & Distribution
- System Control & Dispatch
- Storage & Fuel Supply
16.36 million kW (2010 est.)
67.45 billion kWh (2011 est.)
56.84 billion kWh (2010 est.)
0 kWh (2012 est.)
0 kWh (2012 est.)
66.9% of total installed capacity (2010 est.)
0% of total installed capacity (2010 est.)
20.8% of total installed capacity (2010 est.)
12.3% of total installed capacity (2010 est.)
81.15 million Mt (2011 est.)
Water, Sanitation & Waste InfrastructureBack to top ↑
- Dams, Reservoirs & Flood Defence
- Water Supply & Treatment
- Bulk Water Transfer & Desalination
- Wastewater & Sanitation
- Solid Waste & Recycling
Advanced ManufacturingBack to top ↑
- Materials & Inputs
- Chemicals & Hazardous Process Industry
- Production Systems
- Supply Chain & Ecosystem
- Workforce & Innovation
Transport InfrastructureBack to top ↑
- Seaports & Terminals
- Air Infrastructure
- Air Navigation & Traffic Management
- Inland Waterways & Ferries
- Rail Infrastructure
- Roads & Bridges
- Logistics, Multimodal & Border Infrastructure
- Postal & Parcel
247 (2013)
2 (2013)
3,219 km (limited to vessels with draft less than 1.5 m) (2011)
the International Maritime Bureau reports the territorial and offshore waters in the South China Sea as high risk for piracy and armed robbery against ships; numerous commercial vessels have been attacked and hijacked both at anchor and while underway; hijacked vessels are often disguised and cargo diverted to ports in East Asia; crews have been murdered or cast adrift
Communications & Digital InfrastructureBack to top ↑
- Subsea Cables & International Gateways
- Core & Backbone Networks
- Mobile & Wireless Networks
- Spectrum & Broadcasting
- Data Centres, Compute & Cloud
- Data Resources
- AI Tools & Applications
3.939 million (2012)
103 million (2012)
8.278 million (2009)
425,812 (2012)
.ph
Financial InfrastructureBack to top ↑
- Currency & Reserves
- Payments & Settlement Systems
- Markets, Exchanges & Depositories
- Banks, Insurers & Systemic Institutions
Social InfrastructureBack to top ↑
- Health Infrastructure
- Public Health & Laboratories
- Medical Supply & Stockpiles
- Education & Skills Infrastructure
- Research & Scientific Facilities
- Housing, Community & Social Services
- Government & Public Administration
- Cultural, Community & Recreational Infrastructure
- Justice & Corrections
- Emergency Services & Civil Protection
- Hydrometeorology & Early Warning
Space, Aerospace & Defence InfrastructureBack to top ↑
GINC Capability Domains · Chapter 06
National Security
🇵🇭 the Philippines’ force, intelligence and the defence of the nation
Disputes and terrorismBack to top ↑
Philippines claims sovereignty over Scarborough Reef (also claimed by China together with Taiwan) and over certain of the Spratly Islands, known locally as the Kalayaan (Freedom) Islands, also claimed by China, Malaysia, Taiwan, and Vietnam; the 2002 "Declaration on the Conduct of Parties in the South China Sea," has eased tensions in the Spratly Islands but falls short of a legally binding "code of conduct" desired by several of the disputants; in March 2005, the national oil companies of China, the Philippines, and Vietnam signed a joint accord to conduct marine seismic activities in the Spratly Islands; Philippines retains a dormant claim to Malaysia's Sabah State in northern Borneo based on the Sultanate of Sulu's granting the Philippines Government power of attorney to pursue a sovereignty claim on his behalf; maritime delimitation negotiations continue with Palau
Force Generation & MobilisationBack to top ↑
Armed Forces of the Philippines (AFP): Army, Navy (includes Marine Corps), Air Force (2013)
17-23 years of age (officers 20-24) for voluntary military service; no conscription; applicants must be single male or female Philippine citizens with either 72 college credit hours (enlisted) or a baccalaureate degree (officers) (2013)
1.19% of GDP (2012)//1.21% of GDP (2011)//1.19% of GDP (2010)
Forces under arms
Active-duty strength on the Correlates of War series, which reaches back to 1816 and so carries a nation’s whole record of mobilisation rather than its present establishment. The card opens the full cross-country comparison.
Intelligence & AssessmentBack to top ↑
- Imagery & Geospatial Intelligence
- Signals & Cyber Intelligence
- Technical & Measurement Intelligence
- Open-Source & Financial Intelligence
- Human Intelligence & Counterintelligence
- All-Source Analysis & Warning
Joint Command, Projection & SustainmentBack to top ↑
- Command, Control & Communications
- Strategic Lift & Mobility
- Expeditionary & Peace Operations
- Operational Sustainment & War Reserves
- Defence Industrial Mobilisation
- CBRN Defence
Land PowerBack to top ↑
- Combined Arms Manoeuvre
- Land Fires
- Battlefield Aviation & Uncrewed Systems
- Special Operations & Irregular Warfare
Maritime PowerBack to top ↑
- Maritime Security & Constabulary
- Sea Denial & Undersea Warfare
- Sea Control
- Amphibious & Expeditionary Operations
Air PowerBack to top ↑
- Air Sovereignty & Policing
- Control of the Air
- Air Strike & Interdiction
- Airborne ISR, Early Warning & Battle Management
Strategic Strike & Missile DefenceBack to top ↑
Space OperationsBack to top ↑
Cyber & Electromagnetic OperationsBack to top ↑
Nuclear DeterrenceBack to top ↑
GINC Capability Domains · Chapter 07
Human Capital
🇵🇭 the Philippines’ population, health and the skills that sustain capability
DemographyBack to top ↑
107,668,231 (July 2014 est.)
1.81% (2014 est.)
24.24 births/1,000 population (2014 est.)
4.92 deaths/1,000 population (2014 est.)
3.06 children born/woman (2014 est.)
23.1
48.9% (2011)
Migration and urbanisationBack to top ↑
-1.23 migrant(s)/1,000 population (2014 est.)
MANILA (capital) 11.862 million; Davao 1.565 million; Cebu City 855,000; Zamboanga 884,000 (2011)
Welfare and equityBack to top ↑
26.5% (2009 est.)
44.8 (2009)//46.6 (2003)
DisplacementBack to top ↑
Early Childhood DevelopmentBack to top ↑
20.2% (2011)
Foundational EducationBack to top ↑
2.7% of GDP (2009)
Advanced EducationBack to top ↑
Technical & Vocational SkillsBack to top ↑
Digital & AI CompetenceBack to top ↑
Generative AI adoption
Modelled share of working-age adults using generative AI, from Microsoft telemetry scaled to each country’s 15–64 population. A measure of how fast a workforce is absorbing the technology rather than of how much of it a nation builds. The card opens the full cross-country comparison.
Lifelong Learning & ReskillingBack to top ↑
Research Talent & Knowledge CreationBack to top ↑
Population HealthBack to top ↑
99 deaths/100,000 live births (2010)
6.3% (2008)
0.1% (2012 est.)
14,800 (2012 est.)
300 (2012 est.)
Health System CapabilityBack to top ↑
4.1% of GDP (2011)
1.15 physicians/1,000 population (2004)
1 beds/1,000 population (2011)
GINC Capability Domains · Chapter 08
Governance and Integrity
🇵🇭 the Philippines’ institutions, law and the integrity of the state
State structureBack to top ↑
republic
80 provinces and 39 chartered cities
several previous; latest ratified 2 February 1987, effective 11 February 1987 (2013)
18 years of age; universal
Political Institutions & Civic ParticipationBack to top ↑
- Electoral Management & Integrity
- Legislature & Deliberative Institutions
- Citizen Participation & Civic Space
bicameral Congress or Kongreso consists of the Senate or Senado (24 seats - one-half elected every three years; members elected at large by popular vote to serve six-year terms) and the House of Representatives or Kapulungan Ng Nga Kinatawan (287 seats - 230 members in one tier representing districts and 57 sectoral party-list members in a second tier representing special minorities elected on the basis of one seat for every 2% of the total vote but with each party limited to three seats); a party represented in one tier may not hold seats in the other tier; all House members are elected by popular vote to serve three-year terms
Laban ng Demokratikong Pilipino (Struggle of Filipino Democrats) or LDP [Edgardo ANGARA]//Lakas ng EDSA-Christian Muslim Democrats or Lakas-CMD [Manuel "Mar" ROXAS]//Liberal Party or LP [Manuel ROXAS]//Nacionalista Party or NP [Manuel "Manny" VILLAR]//Nationalist People's Coalition or NPC [Frisco SAN JUAN]//PDP-Laban [Aquilino PIMENTEL]//People's Reform Party [Miriam Defensor SANTIAGO]//Puwersa ng Masang Pilipino (Force of the Philippine Masses) or PMP [Joseph ESTRADA]//
Black and White Movement [Vicente ROMANO]//Kilosbayan [Jovito SALONGA]
Justice System & Fundamental RightsBack to top ↑
- Judicial Independence & Court Capability
- Access to Justice & Legal Services
- Fundamental Rights Protection
- Human Rights Institutions & Equality Bodies
mixed legal system of civil, common, Islamic, and customary law
accepts compulsory ICJ jurisdiction with reservations; accepts ICCt jurisdiction
Internal Security & OrderBack to top ↑
domestic methamphetamine production has been a growing problem in recent years despite government crackdowns; major consumer of amphetamines; longstanding marijuana producer mainly in rural areas where Manila's control is limited
Regulatory Governance & Strategic ControlsBack to top ↑
- Regulatory Quality & Better Regulation
- Regulatory Delivery & Independent Regulators
- Strategic Controls & Economic Security Administration
Government Effectiveness & Public AdministrationBack to top ↑
- Centre of Government & Policy Coordination
- Civil Service & Public Workforce
- Digital Government & Service Delivery
- Legal Identity & Civil Registration
- Statistical & Data Capability
Public Integrity & Anti-CorruptionBack to top ↑
Transparency, Oversight & AccountabilityBack to top ↑
- Right to Information & Open Government
- Independent Oversight & Supreme Audit
- Independent Media & Journalist Safety
National Resilience & Crisis ManagementBack to top ↑
GINC Capability Domains · Chapter 09
Information and Influence
🇵🇭 the Philippines’ identity, media and the projection of influence
Identity and cultureBack to top ↑
Filipino (official; based on Tagalog) and English (official); eight major dialects - Tagalog, Cebuano, Ilocano, Hiligaynon or Ilonggo, Bicol, Waray, Pampango, and Pangasinan
Catholic 82.9% (Roman Catholic 80.9%, Aglipayan 2%), Muslim 5%, Evangelical 2.8%, Iglesia ni Kristo 2.3%, other Christian 4.5%, other 1.8%, unspecified 0.6%, none 0.1% (2000 census)
Tagalog 28.1%, Cebuano 13.1%, Ilocano 9%, Bisaya/Binisaya 7.6%, Hiligaynon Ilonggo 7.5%, Bikol 6%, Waray 3.4%, other 25.3% (2000 census)
Philippine eagle
two equal horizontal bands of blue (top) and red; a white equilateral triangle is based on the hoist side; the center of the triangle displays a yellow sun with eight primary rays; each corner of the triangle contains a small, yellow, five-pointed star; blue stands for peace and justice, red symbolizes courage, the white equal-sided triangle represents equality; the rays recall the first eight provinces that sought independence from Spain, while the stars represent the three major geographical divisions of the country: Luzon, Visayas, and Mindanao; the design of the flag dates to 1897
Diplomatic Statecraft & Global NetworksBack to top ↑
- Diplomatic Network & Consular Reach
- Multilateral Leadership & Norm Setting
- Agenda-Setting & Convening
- Mediation & Crisis Diplomacy
ADB, APEC, APT, ARF, ASEAN, BIS, CD, CICA (observer), CP, EAS, FAO, G-24, G-77, IAEA, IBRD, ICAO, ICC (national committees), ICRM, IDA, IFAD, IFC, IFRCS, IHO, ILO, IMF, IMO, IMSO, Interpol, IOC, IOM, IPU, ISO, ITSO, ITU, ITUC (NGOs), MIGA, MINUSTAH, NAM, OAS (observer), OPCW, PCA, PIF (partner), UN, UNCTAD, UNDOF, UNESCO, UNHCR, UNIDO, Union Latina, UNISFA, UNMIL, UNMISS, UNMIT, UNMOGIP, UNOCI, UNWTO, UPU, WCO, WFTU (NGOs), WHO, WIPO, WMO, WTO
Alliances & Security CooperationBack to top ↑
Development Cooperation & Global AssistanceBack to top ↑
Culture, Language & Education DiplomacyBack to top ↑
- Cultural & Language Institutes
- Creative Industries & Cultural Export Reach
- Heritage & Cultural Institutions
- Education Diplomacy & Alumni Networks
- Sports & Major Events
Diaspora & Global CommunitiesBack to top ↑
Information Environment & Strategic CommunicationBack to top ↑
- Strategic Communications & Public Diplomacy
- International Media & Broadcasting
- Information Defence & Counter-Interference
multiple national private TV and radio networks; multi-channel satellite and cable TV systems available; more than 350 TV stations - 4 major TV networks operating nationwide with 1 being government-owned; some 1100 cable TV providers and some 1,200 radio stations broadcasting; the Philippines is scheduled to complete the switch from analog to digital broadcasting by the end of 2015 (2012)
GINC Capability Domains · Chapter 10
Financial Strength
🇵🇭 the Philippines’ fiscal depth, reserves and the capacity to act
Monetary & Currency CapabilityBack to top ↑
- Monetary Policy & Price Stability
- Exchange Rate & External Account Management
- Currency Issuance & Digital Money
2.8% (2013 est.)//3.2% (2012 est.)
Philippine pesos (PHP) per US dollar -//42.69 (2013 est.)//42.229 (2012 est.)//45.11 (2010 est.)//47.68 (2009)//44.439 (2008)
5.3% (31 December 2012 est.)//5.6% (31 December 2011 est.)
5.8% (31 December 2013 est.)//5.68% (31 December 2012 est.)
$43.67 billion (31 December 2013 est.)//$39.01 billion (31 December 2012 est.)
$137.7 billion (31 December 2013 est.)//$121.6 billion (31 December 2012 est.)
Fiscal Capacity & Public FinanceBack to top ↑
- Revenue Mobilisation & Tax Administration
- Public Expenditure & Budget Management
- Sovereign Debt & Treasury Management
- Public Investment Management
14.3% of GDP (2013 est.)
-1.8% of GDP (2013 est.)
50.2% of GDP (2013 est.)//51.5% of GDP (2012 est.)
calendar year
Financial System Depth & AccessBack to top ↑
- Banking System Capacity
- Capital Markets Depth & Development
- Long-Term & Institutional Capital
- Financial Inclusion & Household Access
- Development & Policy Finance
$150.3 billion (31 December 2013 est.)//$129.4 billion (31 December 2012 est.)
$266.3 billion (31 December 2012)//$198.4 billion (31 December 2011)//$202.2 billion (31 December 2010)
22.9% of GDP (2013 est.)//21.3% of GDP (2012 est.)//23.6% of GDP (2011 est.)
Financial Regulation & IntegrityBack to top ↑
- Prudential Regulation & Supervision
- Financial Integrity & Illicit Finance Control
- Market Conduct & Consumer Protection
- Payment & Market Infrastructure Oversight
Financial Stability & Crisis ManagementBack to top ↑
- Macroprudential & Systemic Oversight
- Crisis Management, Resolution & Deposit Insurance
- External Liquidity & Financial Safety Nets
Sovereign Capital & External Financial PowerBack to top ↑
- Official Reserves Management
- Sovereign Wealth & Public Asset Management
- Currency Internationalisation & Reserve Status
- Capital Account & Flow Management
- International Financial Centre Capability
$85.04 billion (31 December 2013 est.)//$83.83 billion (31 December 2012 est.)
$72.81 billion (31 December 2013 est.)//$NA (31 December 2012 est.)
GINC Capability Domains · Chapter 11
Production and Innovation
🇵🇭 the Philippines’ output, industry and the engine of prosperity
Economic Output & ProductivityBack to top ↑
The economy has weathered global economic and financial downturns better than its regional peers due to minimal exposure to troubled international securities, lower dependence on exports, relatively resilient domestic consumption, large remittances from four- to five-million overseas Filipino workers, and a rapidly expanding business process outsourcing industry. The current account balance had recorded consecutive surpluses since 2003; international reserves are at record highs; the banking system is stable; and the stock market was Asia's second best-performer in 2012. Efforts to improve tax administration and expenditure management have helped ease the Philippines' tight fiscal situation and reduce high debt levels. The Philippines has received several credit rating upgrades on its sovereign debt, and has had little difficulty tapping domestic and international markets to finance its deficits. Economic growth in the Philippines averaged 4.5% during the MACAPAGAL-ARROYO administration, but poverty worsened during her term. Growth has accelerated under the AQUINO government, but with limited progress thus far in bringing down unemployment, which hovers around 7%, and improving the quality of jobs. Underemployment is nearly 20% and more than 40% of the employed are estimated to be working in the informal sector. The AQUINO administration has been working to boost the budgets for education, health, cash transfers to the poor, and other social spending programs, and is relying on the private sector to help fund major infrastructure projects under its Public-Private Partnership program. Long term challenges include reforming governance and the judicial system, building infrastructure, improving regulatory predictability, and the ease of doing business, attracting higher levels of local and foreign investments. The Philippine Constitution and the other laws continue to restrict foreign ownership in important activities/sectors (such as land ownership and public utilities).
$454.3 billion (2013 est.)//$425.3 billion (2012 est.)//$398.2 billion (2011 est.)
6.8% (2013 est.)//6.8% (2012 est.)//3.6% (2011 est.)
$4,700 (2013 est.)//$4,400 (2012 est.)//$4,200 (2011 est.)
$272.2 billion (2013 est.)
Labour & EmploymentBack to top ↑
- Employment & Labour Force Participation
- Labour Market Institutions & Wage Setting
- Employment Services & Skills Matching
- Labour Adjustment, Transition & Formalisation
41.33 million (2013 est.)
7.4% (2013 est.)//7% (2012 est.)
Industrial & Sectoral BaseBack to top ↑
- Manufacturing & Advanced Industry
- Foundational & Process Industries
- Agrifood & Primary Production
- Services Economy
sugarcane, coconuts, rice, corn, bananas, cassava (manioc, tapioca), pineapples, mangoes; pork, eggs, beef; fish
electronics assembly, garments, footwear, pharmaceuticals, chemicals, wood products, food processing, petroleum refining, fishing
9% (2013 est.)
Structural Transformation & ComplexityBack to top ↑
Business Dynamism & EntrepreneurshipBack to top ↑
- Entrepreneurship & Firm Creation
- Risk Capital & Scale-Up Finance
- Firm Growth, Exit & Renewal
- Competition & Market Contestability
Innovation & CommercialisationBack to top ↑
- Business Innovation Capability
- Research Commercialisation & Knowledge Transfer
- Intellectual Property & Intangible Assets
- Innovation Ecosystems & Clusters
Technology Adoption & DiffusionBack to top ↑
GINC Capability Domains · Chapter 12
Trade and Investment
🇵🇭 the Philippines’ markets, capital and the terms of global exchange
Overall tradeBack to top ↑
$99.4B of exports to 197 partners and $139B of imports from 203 in 2024, a deficit of $39.2B.
- Exports
- $99.4B197 partners
- Imports
- $139B203 partners
- Balance
- −$39.2Bdeficit
- Total trade
- $238B2024
ExportsBack to top ↑
Where its exports go
The largest partners in 2024, with each one's share of the nation's exports.
| Partner | Value | Share | |
|---|---|---|---|
| China | $18.7B | 19% | |
| United States | $14.2B | 14% | |
| Hong Kong | $11.4B | 12% | |
| Japan | $10.5B | 11% | |
| Germany | $4.66B | 4.7% | |
| South Korea | $4.47B | 4.5% | |
| Singapore | $4.18B | 4.2% | |
| Thailand | $3.28B | 3.3% | |
| Mexico | $3.26B | 3.3% | |
| Netherlands | $2.77B | 2.8% | |
| Malaysia | $2.24B | 2.3% | |
| Taiwan | $2.18B | 2.2% | |
| Indonesia | $1.77B | 1.8% | |
| Vietnam | $1.65B | 1.7% | |
| Switzerland | $1.58B | 1.6% | |
| India | $1.56B | 1.6% | |
| Canada | $1.23B | 1.2% | |
| France | $983M | 1.0% | |
| United Kingdom | $978M | 1.0% | |
| Australia | $694M | 0.7% |
What it exports
The largest categories in 2024.
| Category | Value | Share | |
|---|---|---|---|
| Electrical, electronic equipment | $47.6B | 48% | |
| Machinery, nuclear reactors, boilers | $16.1B | 16% | |
| Pearls, precious stones, metals, coins | $3.58B | 3.6% | |
| Ores slag and ash | $3.47B | 3.5% | |
| Optical, photo, technical, medical apparatus | $3.18B | 3.2% | |
| Animal, vegetable fats and oils, cleavage products | $2.39B | 2.4% | |
| Edible fruits, nuts, peel of citrus fruit, melons | $2.28B | 2.3% | |
| Copper | $2.13B | 2.1% | |
| Mineral fuels, oils, distillation products | $1.71B | 1.7% | |
| Wood and articles of wood, wood charcoal | $1.05B | 1.1% | |
| Articles of leather, animal gut, harness, travel good | $944M | 1.0% | |
| Plastics | $866M | 0.9% | |
| Vegetable, fruit, nut food preparations | $818M | 0.8% | |
| Vehicles other than railway, tramway | $797M | 0.8% | |
| Rubbers | $788M | 0.8% |
ImportsBack to top ↑
Where its imports come from
The largest partners in 2024, with each one's share of the nation's imports.
| Partner | Value | Share | |
|---|---|---|---|
| China | $37.3B | 27% | |
| Indonesia | $11.6B | 8.3% | |
| Japan | $10.5B | 7.5% | |
| South Korea | $10.1B | 7.3% | |
| United States | $8.85B | 6.4% | |
| Thailand | $7.88B | 5.7% | |
| Malaysia | $6.13B | 4.4% | |
| Singapore | $6.12B | 4.4% | |
| Vietnam | $5.72B | 4.1% | |
| Taiwan | $4.27B | 3.1% | |
| Australia | $3.28B | 2.4% | |
| India | $2.40B | 1.7% | |
| Hong Kong | $2.29B | 1.7% | |
| Brazil | $2.23B | 1.6% | |
| Germany | $2.21B | 1.6% | |
| Saudi Arabia | $2.08B | 1.5% | |
| United Arab Emirates | $1.49B | 1.1% | |
| France | $1.22B | 0.9% | |
| Italy | $1.02B | 0.7% | |
| Canada | $1.01B | 0.7% |
What it imports
The largest categories in 2024.
| Category | Value | Share | |
|---|---|---|---|
| Electrical, electronic equipment | $27.9B | 20% | |
| Mineral fuels, oils, distillation products | $19.5B | 14% | |
| Machinery, nuclear reactors, boilers | $11.7B | 8.5% | |
| Vehicles other than railway, tramway | $10.3B | 7.4% | |
| Plastics | $5.14B | 3.7% | |
| Cereals | $4.86B | 3.5% | |
| Iron and steel | $3.96B | 2.9% | |
| Ores slag and ash | $3.39B | 2.4% | |
| Articles of iron or steel | $2.88B | 2.1% | |
| Optical, photo, technical, medical apparatus | $2.86B | 2.1% | |
| Meat and edible meat offal | $2.47B | 1.8% | |
| Residues, wastes of food industry, animal fodder | $2.27B | 1.6% | |
| Pharmaceutical products | $2.18B | 1.6% | |
| Miscellaneous edible preparations | $2.10B | 1.5% | |
| Paper and paperboard, articles of pulp, paper and board | $1.95B | 1.4% |
In a list, the bar runs to the largest in that list. The line is each figure’s history from 2000, drawn to its own peak: it shows the shape of the years, and the value shows the size.
External balanceBack to top ↑
$7.512 billion (2013 est.)//$7.126 billion (2012 est.)
Trade Facilitation & LogisticsBack to top ↑
Trade Policy & Market AccessBack to top ↑
- Trade Policy & Negotiation Capability
- Market Access & Agreements Network
- Trade Law & Enforcement
- Standards, Conformity & Quality Infrastructure
Digital & Services TradeBack to top ↑
- Services Trade Capability
- Digital Trade & E-Commerce
- Data Flows & Digital Trade Governance
- Tourism & Visitor Economy
Investment Attraction & ProjectionBack to top ↑
- Investment Attraction & Facilitation
- Investment Absorption & Linkages
- Outward Investment & Global Corporate Presence
$33.28 billion (31 December 2013 est.)//$30.38 billion (31 December 2012 est.)
$9.435 billion (31 December 2013 est.)//$8.435 billion (31 December 2012 est.)
Export Capability & SophisticationBack to top ↑
$47.45 billion (2013 est.)//$46.28 billion (2012 est.)
Japan 19%, US 14.2%, China 11.8%, Singapore 9.3%, Hong Kong 9.2%, South Korea 5.5%, Thailand 4.7% (2012)
semiconductors and electronic products, transport equipment, garments, copper products, petroleum products, coconut oil, fruits
Global Value Chain PositionBack to top ↑
- Value Chain Participation & Integration
- Value Chain Position & Upgrading
- Regional Integration & Hub Anchoring
Economic Leverage & DependenceBack to top ↑
- Strategic Supply Security
- Concentration Risk & Revenue Stabilisation
- Economic Leverage & Coercion Resistance
$63.91 billion (2013 est.)//$61.49 billion (2012 est.)
US 11.5%, China 10.8%, Japan 10.4%, South Korea 7.3%, Singapore 7.1%, Thailand 5.6%, Saudi Arabia 5.6%, Indonesia 4.4%, Malaysia 4% (2012)
electronic products, mineral fuels, machinery and transport equipment, iron and steel, textile fabrics, grains, chemicals, plastic
Philippines · you are in
Historical Context
Foundations
GINC Capability Domains
Find in this brief · Philippines