
Australia
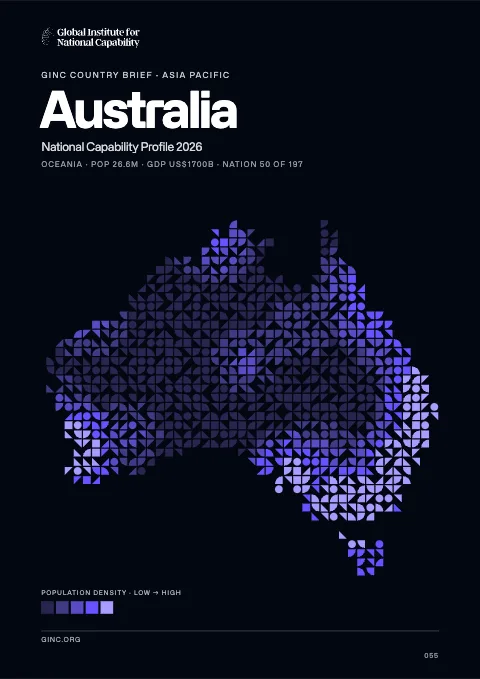
Australia is a federal parliamentary democracy and a Commonwealth realm in Oceania, home to 23 million people, with its capital at Canberra, and the world’s 6th-largest country by area.
Contents
12 chapters
Foundations
01–03
At a glance
- Area
- 7.7Mkm²#6 World#1 Oceania
- Population
- 22.5M#55 World#1 Oceania
- GDP (market)
- $1.5T
- GDP (PPP)
- $998.3B#17 World#1 Oceania
- GDP per capita
- $43K#21 World#1 Oceania
The whole brief
Australia National Capability Profile 2026
Foundations · Chapter 01
Historical Context
🇦🇺 Australia’s understanding the origins and evolution of the modern nation
BackgroundBack to top ↑
Prehistoric settlers arrived on the continent from Southeast Asia at least 40,000 years before the first Europeans began exploration in the 17th century. No formal territorial claims were made until 1770, when Capt. James COOK took possession of the east coast in the name of Great Britain (all of Australia was claimed as British territory in 1829 with the creation of the colony of Western Australia). Six colonies were created in the late 18th and 19th centuries; they federated and became the Commonwealth of Australia in 1901. The new country took advantage of its natural resources to rapidly develop agricultural and manufacturing industries and to make a major contribution to the Allied effort in World Wars I and II. In recent decades, Australia has become an internationally competitive, advanced market economy due in large part to economic reforms adopted in the 1980s and its location in one of the fastest growing regions of the world economy. Long-term concerns include aging of the population, pressure on infrastructure, and environmental issues such as floods, droughts, and bushfires. Australia is the driest inhabited continent on earth, making it particularly vulnerable to the challenges of climate change. Australia is home to 10 per cent of the world's biodiversity, and a great number of its flora and fauna exist nowhere else in the world. In January 2013, Australia assumed a nonpermanent seat on the UN Security Council for the 2013-14 term.
IndependenceBack to top ↑
1 January 1901 (from the federation of UK colonies)
National holidayBack to top ↑
Australia Day (commemorates the arrival of the First Fleet of Australian settlers), 26 January (1788); ANZAC Day (commemorates the anniversary of the landing of troops of the Australian and New Zealand Army Corps during World War I at Gallipoli, Turkey), 25 April (1915)
Foundations · Chapter 02
Geography
🇦🇺 Australia’s territory, resources and strategic position
Location and areaBack to top ↑
Oceania, continent between the Indian Ocean and the South Pacific Ocean
27 00 S, 133 00 E
Oceania
slightly smaller than the US contiguous 48 states
0 km
25,760 km
Terrain and resourcesBack to top ↑
mostly low plateau with deserts; fertile plain in southeast
bauxite, coal, iron ore, copper, tin, gold, silver, uranium, nickel, tungsten, rare earth elements, mineral sands, lead, zinc, diamonds, natural gas, petroleum
25,460 sq km (2006)
Settlement and hazardsBack to top ↑
cyclones along the coast; severe droughts; forest fires
world's smallest continent but sixth-largest country; the largest country in Oceania, the largest country entirely in the Southern Hemisphere, and the largest country without land borders; the only continent without glaciers; population concentrated along the eastern and southeastern coasts; the invigorating sea breeze known as the "Fremantle Doctor" affects the city of Perth on the west coast and is one of the most consistent winds in the world
OtherBack to top ↑
492 cu km (2011)
soil erosion from overgrazing, industrial development, urbanization, and poor farming practices; soil salinity rising due to the use of poor quality water; desertification; clearing for agricultural purposes threatens the natural habitat of many unique animal and plant species; the Great Barrier Reef off the northeast coast, the largest coral reef in the world, is threatened by increased shipping and its popularity as a tourist site; limited natural freshwater resources
Foundations · Chapter 03
Environment
🇦🇺 Australia’s environmental conditions, resources and national resilience
ClimateBack to top ↑
generally arid to semiarid; temperate in south and east; tropical in north
Emissions and pollutionBack to top ↑
Water, waste and foodBack to top ↑
Resources and agreementsBack to top ↑
GINC Capability Domains · Chapter 04
Critical Technology
🇦🇺 Australia’s technology frontiers and the pursuit of national advantage
Two counts are set side by side for 2015–2024: on the left, the papers researchers in Australia published; on the right, the patent families that began there and were filed in more than one country. First by capability group, then group by group with each group’s capabilities. The badge on a card is the nation’s place among all nations. Papers are from GINC Research Analytics, patent families from GINC Patents.
Research by capability group
#11 WorldPapers published, 2015–2024
12,623
7,580
6,463
5,979
3,655
2,868
2,409
2,116
786
121
Patents by capability group
#19 WorldInternational patent families, 2015–2024
1,633
1,338
977
863
763
690
478
240
94
44
Advanced Materials & ManufacturingBack to top ↑
Research
#11 WorldPapers published, 2015–2024
Patents
#17 WorldInternational patent families, 2015–2024
Energy TechnologiesBack to top ↑
Research
#8 WorldPapers published, 2015–2024
Patents
#18 WorldInternational patent families, 2015–2024
Semiconductors & Advanced ComputingBack to top ↑
Research
#19 WorldPapers published, 2015–2024
No research topic: Semiconductor Design & EDA · Advanced Semiconductor Fabrication · Semiconductor Equipment & Materials · Advanced Packaging & Heterogeneous Integration
Patents
#19 WorldInternational patent families, 2015–2024
Artificial IntelligenceBack to top ↑
Research
#7 WorldPapers published, 2015–2024
Patents
#17 WorldInternational patent families, 2015–2024
Quantum TechnologiesBack to top ↑
Research
#10 WorldPapers published, 2015–2024
Patents
#15 WorldInternational patent families, 2015–2024
Connectivity, Cyber & Trust TechnologiesBack to top ↑
Research
#10 WorldPapers published, 2015–2024
Patents
#18 WorldInternational patent families, 2015–2024
Sensing, Timing & NavigationBack to top ↑
Research
#12 WorldPapers published, 2015–2024
Patents
#18 WorldInternational patent families, 2015–2024
Robotics & Autonomous SystemsBack to top ↑
Research
#12 WorldPapers published, 2015–2024
No research topic: Human-Machine Interfaces
Patents
#16 WorldInternational patent families, 2015–2024
Biotechnology & Health TechnologiesBack to top ↑
Research
#9 WorldPapers published, 2015–2024
Patents
#15 WorldInternational patent families, 2015–2024
Medicine and BioTech
Clinical research and life-science invention, drawn from the same series that drive the metric pages. Each card opens the full cross-country comparison.
Space TechnologiesBack to top ↑
Research
#13 WorldPapers published, 2015–2024
Patents
#20 WorldInternational patent families, 2015–2024
GINC Capability Domains · Chapter 05
Strategic Infrastructure
🇦🇺 Australia’s energy, connectivity and the material foundations of capability
Resource InfrastructureBack to top ↑
519,100 bbl/day (2012 est.)
314,100 bbl/day (2010 est.)
475,900 bbl/day (2010 est.)
1.433 billion bbl (1 January 2013 est.)
675,200 bbl/day (2010 est.)
1.023 million bbl/day (2011 est.)
70,810 bbl/day (2010 est.)
304,100 bbl/day (2010 est.)
48.24 billion cu m (2012 est.)
33.39 billion cu m (2010 est.)
30.27 billion cu m (2012 est.)
10.92 billion cu m (2012 est.)
1.219 trillion cu m (1 January 2013 est.)
condensate/gas 637 km; gas 30,054 km; liquid petroleum gas 240 km; oil 3,609 km; oil/gas/water 110 km; refined products 72 km (2013)
Agriculture & Food InfrastructureBack to top ↑
- Irrigation & Agricultural Water
- Livestock & Veterinary
- Fisheries & Aquaculture
- Storage, Cold Chain & Markets
Energy InfrastructureBack to top ↑
- Thermal Generation
- Nuclear Generation
- Nuclear Fuel Cycle & Radioactive Waste
- Hydropower
- Renewable Generation
- Transmission & Distribution
- System Control & Dispatch
- Storage & Fuel Supply
59.13 million kW (2010 est.)
225.5 billion kWh (2011 est.)
213.5 billion kWh (2010 est.)
0 kWh (2012 est.)
0 kWh (2012 est.)
78.7% of total installed capacity (2010 est.)
0% of total installed capacity (2010 est.)
13.6% of total installed capacity (2010 est.)
5.1% of total installed capacity (2010 est.)
392.3 million Mt (2011 est.)
Water, Sanitation & Waste InfrastructureBack to top ↑
- Dams, Reservoirs & Flood Defence
- Water Supply & Treatment
- Bulk Water Transfer & Desalination
- Wastewater & Sanitation
- Solid Waste & Recycling
Advanced ManufacturingBack to top ↑
- Materials & Inputs
- Chemicals & Hazardous Process Industry
- Production Systems
- Supply Chain & Ecosystem
- Workforce & Innovation
Transport InfrastructureBack to top ↑
- Seaports & Terminals
- Air Infrastructure
- Air Navigation & Traffic Management
- Inland Waterways & Ferries
- Rail Infrastructure
- Roads & Bridges
- Logistics, Multimodal & Border Infrastructure
- Postal & Parcel
480 (2013)
1 (2013)
2,000 km (mainly used for recreation on Murray and Murray-Darling river systems) (2011)
Communications & Digital InfrastructureBack to top ↑
- Subsea Cables & International Gateways
- Core & Backbone Networks
- Mobile & Wireless Networks
- Spectrum & Broadcasting
- Data Centres, Compute & Cloud
- Data Resources
- AI Tools & Applications
10.47 million (2012)
24.4 million (2012)
15.81 million (2009)
17.081 million (2012)
.au
Financial InfrastructureBack to top ↑
- Currency & Reserves
- Payments & Settlement Systems
- Markets, Exchanges & Depositories
- Banks, Insurers & Systemic Institutions
Social InfrastructureBack to top ↑
- Health Infrastructure
- Public Health & Laboratories
- Medical Supply & Stockpiles
- Education & Skills Infrastructure
- Research & Scientific Facilities
- Housing, Community & Social Services
- Government & Public Administration
- Cultural, Community & Recreational Infrastructure
- Justice & Corrections
- Emergency Services & Civil Protection
- Hydrometeorology & Early Warning
Space, Aerospace & Defence InfrastructureBack to top ↑
GINC Capability Domains · Chapter 06
National Security
🇦🇺 Australia’s force, intelligence and the defence of the nation
Disputes and terrorismBack to top ↑
In 2007, Australia and Timor-Leste agreed to a 50-year development zone and revenue sharing arrangement and deferred a maritime boundary; Australia asserts land and maritime claims to Antarctica; Australia's 2004 submission to the Commission on the Limits of the Continental Shelf (CLCS) extends its continental margins over 3.37 million square kilometers, expanding its seabed roughly 30 percent beyond its claimed exclusive economic zone; all borders between Indonesia and Australia have been agreed upon bilaterally, but a 1997 treaty that would settle the last of their maritime and Exclusive Economic Zone (EEZ) boundary has yet to be ratified by Indonesia's legislature; Indonesian groups challenge Australia's claim to Ashmore Reef; Australia closed parts of the Ashmore and Cartier reserve to Indonesian traditional fishing
Force Generation & MobilisationBack to top ↑
Australian Defense Force (ADF): Australian Army; Royal Australian Navy (includes Naval Aviation Force); Royal Australian Air Force; Joint Operations Command (JOC) (2013)
17 years of age for voluntary military service (with parental consent); no conscription; women allowed to serve in most combat roles, except the Army special forces (2013)
1.71% of GDP (2012)//1.84% of GDP (2011)//1.71% of GDP (2010)
Forces under arms
Active-duty strength on the Correlates of War series, which reaches back to 1816 and so carries a nation’s whole record of mobilisation rather than its present establishment. The card opens the full cross-country comparison.
Intelligence & AssessmentBack to top ↑
- Imagery & Geospatial Intelligence
- Signals & Cyber Intelligence
- Technical & Measurement Intelligence
- Open-Source & Financial Intelligence
- Human Intelligence & Counterintelligence
- All-Source Analysis & Warning
Joint Command, Projection & SustainmentBack to top ↑
- Command, Control & Communications
- Strategic Lift & Mobility
- Expeditionary & Peace Operations
- Operational Sustainment & War Reserves
- Defence Industrial Mobilisation
- CBRN Defence
Land PowerBack to top ↑
- Combined Arms Manoeuvre
- Land Fires
- Battlefield Aviation & Uncrewed Systems
- Special Operations & Irregular Warfare
Maritime PowerBack to top ↑
- Maritime Security & Constabulary
- Sea Denial & Undersea Warfare
- Sea Control
- Amphibious & Expeditionary Operations
Air PowerBack to top ↑
- Air Sovereignty & Policing
- Control of the Air
- Air Strike & Interdiction
- Airborne ISR, Early Warning & Battle Management
Strategic Strike & Missile DefenceBack to top ↑
Space OperationsBack to top ↑
Cyber & Electromagnetic OperationsBack to top ↑
Nuclear DeterrenceBack to top ↑
GINC Capability Domains · Chapter 07
Human Capital
🇦🇺 Australia’s population, health and the skills that sustain capability
DemographyBack to top ↑
22,507,617 (July 2014 est.)
1.09% (2014 est.)
12.19 births/1,000 population (2014 est.)
7.07 deaths/1,000 population (2014 est.)
1.77 children born/woman (2014 est.)
30.5 (2006 est.)
72.3%
Migration and urbanisationBack to top ↑
5.74 migrant(s)/1,000 population (2014 est.)
Sydney 4.543 million; Melbourne 3.961 million; Brisbane 2.039 million; Perth 1.649 million; Adelaide 1.198 million; CANBERRA (capital) 399,000 (2011)
Welfare and equityBack to top ↑
NA%
30.3 (2008)//35.2 (1994)
DisplacementBack to top ↑
Early Childhood DevelopmentBack to top ↑
0.2% (2007)
Foundational EducationBack to top ↑
5.6% of GDP (2010)
Advanced EducationBack to top ↑
Technical & Vocational SkillsBack to top ↑
Digital & AI CompetenceBack to top ↑
Generative AI adoption
Modelled share of working-age adults using generative AI, from Microsoft telemetry scaled to each country’s 15–64 population. A measure of how fast a workforce is absorbing the technology rather than of how much of it a nation builds. The card opens the full cross-country comparison.
Lifelong Learning & ReskillingBack to top ↑
Research Talent & Knowledge CreationBack to top ↑
Population HealthBack to top ↑
7 deaths/100,000 live births (2010)
26.8% (2008)
0.1% (2009 est.)
20,000 (2009 est.)
fewer than 100 (2009 est.)
Health System CapabilityBack to top ↑
9% of GDP (2011)
3.85 physicians/1,000 population (2010)
3.9 beds/1,000 population (2010)
GINC Capability Domains · Chapter 08
Governance and Integrity
🇦🇺 Australia’s institutions, law and the integrity of the state
State structureBack to top ↑
federal parliamentary democracy and a Commonwealth realm
6 states and 2 territories*; Australian Capital Territory*, New South Wales, Northern Territory*, Queensland, South Australia, Tasmania, Victoria, Western Australia
Ashmore and Cartier Islands, Christmas Island, Cocos (Keeling) Islands, Coral Sea Islands, Heard Island and McDonald Islands, Macquarie Island, Norfolk Island
9 July 1900; effective 1 January 1901; amended several times, last in 1977; note - a referendum to amend the constitution to reflect the Aboriginal and Torres Strait Islander Peoples Recognition Act 2013 is to be completed by the end of 2014 (2013)
18 years of age; universal and compulsory
Political Institutions & Civic ParticipationBack to top ↑
- Electoral Management & Integrity
- Legislature & Deliberative Institutions
- Citizen Participation & Civic Space
bicameral Federal Parliament consists of the Senate (76 seats; 12 members from each of the six states and 2 from each of the two mainland territories; one-half of state members are elected every three years by popular vote to serve six-year terms while all territory members are elected every three years) and the House of Representatives (150 seats; members elected by popular vote to serve terms of up to three-years; no state can have fewer than 5 representatives)
Australian Greens Party [Christine MILNE]//Australian Labor Party [Bill SHORTEN]//Country Liberal Party [Terry MILLS]//Family First Party [Steve FIELDING]//Katter's Australian Party [Bob KATTER]//Liberal National Party of Queensland [Campbell NEWMAN]//Liberal Party [Tony ABBOTT]//National Party of Australia [Warren TRUSS]//Palmer United Party [Clive PALMER]
Justice System & Fundamental RightsBack to top ↑
- Judicial Independence & Court Capability
- Access to Justice & Legal Services
- Fundamental Rights Protection
- Human Rights Institutions & Equality Bodies
common law system based on the English model
accepts compulsory ICJ jurisdiction with reservations; accepts ICCt jurisdiction
Internal Security & OrderBack to top ↑
Tasmania is one of the world's major suppliers of licit opiate products; government maintains strict controls over areas of opium poppy cultivation and output of poppy straw concentrate; major consumer of cocaine and amphetamines
Regulatory Governance & Strategic ControlsBack to top ↑
- Regulatory Quality & Better Regulation
- Regulatory Delivery & Independent Regulators
- Strategic Controls & Economic Security Administration
Government Effectiveness & Public AdministrationBack to top ↑
- Centre of Government & Policy Coordination
- Civil Service & Public Workforce
- Digital Government & Service Delivery
- Legal Identity & Civil Registration
- Statistical & Data Capability
Public Integrity & Anti-CorruptionBack to top ↑
Transparency, Oversight & AccountabilityBack to top ↑
- Right to Information & Open Government
- Independent Oversight & Supreme Audit
- Independent Media & Journalist Safety
National Resilience & Crisis ManagementBack to top ↑
GINC Capability Domains · Chapter 09
Information and Influence
🇦🇺 Australia’s identity, media and the projection of influence
Identity and cultureBack to top ↑
English 76.8%, Mandarin 1.6%, Italian 1.4%, Arabic 1.3%, Greek 1.2%, Cantonese 1.2%, Vietnamese 1.1%, other 10.4%, unspecified 5% (2011 est.)
Protestant 28.8% (Anglican 17.1%, Uniting Church 5.0%, Presbyterian and Reformed 2.8%, Baptist, 1.6%, Lutheran 1.2%, Pentecostal 1.1%), Catholic 25.3%, Eastern Orthodox 2.6%, other Christian 4.5%, Buddhist 2.5%, Muslim 2.2%, Hindu 1.3%, other 8.4%, unspecified 2.2%, none 22.3%
white 92%, Asian 7%, aboriginal and other 1%
Southern Cross constellation (five, seven-pointed stars); kangaroo; emu
blue with the flag of the UK in the upper hoist-side quadrant and a large seven-pointed star in the lower hoist-side quadrant known as the Commonwealth or Federation Star, representing the federation of the colonies of Australia in 1901; the star depicts one point for each of the six original states and one representing all of Australia's internal and external territories; on the fly half is a representation of the Southern Cross constellation in white with one small, five-pointed star and four larger, seven-pointed stars
Diplomatic Statecraft & Global NetworksBack to top ↑
- Diplomatic Network & Consular Reach
- Multilateral Leadership & Norm Setting
- Agenda-Setting & Convening
- Mediation & Crisis Diplomacy
ADB, ANZUS, APEC, ARF, ASEAN (dialogue partner), Australia Group, BIS, C, CD, CP, EAS, EBRD, EITI (implementing country), FAO, FATF, G-20, IAEA, IBRD, ICAO, ICC (national committees), ICRM, IDA, IEA, IFC, IFRCS, IHO, ILO, IMF, IMO, IMSO, Interpol, IOC, IOM, IPU, ISO, ITSO, ITU, ITUC (NGOs), MIGA, NEA, NSG, OECD, OPCW, OSCE (partner), Pacific Alliance (observer), Paris Club, PCA, PIF, SAARC (observer), SICA (observer), Sparteca, SPC, UN, UN Security Council (temporary), UNCTAD, UNESCO, UNHCR, UNMISS, UNMIT, UNRWA, UNTSO, UNWTO, UPU, WCO, WFTU (NGOs), WHO, WIPO, WMO, WTO, ZC
Alliances & Security CooperationBack to top ↑
Development Cooperation & Global AssistanceBack to top ↑
Culture, Language & Education DiplomacyBack to top ↑
- Cultural & Language Institutes
- Creative Industries & Cultural Export Reach
- Heritage & Cultural Institutions
- Education Diplomacy & Alumni Networks
- Sports & Major Events
Diaspora & Global CommunitiesBack to top ↑
Information Environment & Strategic CommunicationBack to top ↑
- Strategic Communications & Public Diplomacy
- International Media & Broadcasting
- Information Defence & Counter-Interference
the Australian Broadcasting Corporation (ABC) runs multiple national and local radio networks and TV stations, as well as Australia Network, a TV service that broadcasts throughout the Asia-Pacific region and is the main public broadcaster; Special Broadcasting Service (SBS), a second large public broadcaster, operates radio and TV networks broadcasting in multiple languages; several large national commercial TV networks, a large number of local commercial TV stations, and hundreds of commercial radio stations are accessible; cable and satellite systems are available (2008)
GINC Capability Domains · Chapter 10
Financial Strength
🇦🇺 Australia’s fiscal depth, reserves and the capacity to act
Monetary & Currency CapabilityBack to top ↑
- Monetary Policy & Price Stability
- Exchange Rate & External Account Management
- Currency Issuance & Digital Money
2.4% (2013 est.)//1.8% (2012 est.)
Australian dollars (AUD) per US dollar -//1.031 (2013 est.)//0.9658 (2012 est.)//1.0902 (2010)//1.2822 (2009)//1.2059 (2008)
3% (February 2013 est.)//4.35% (31 December 2010 est.)
6.2% (31 December 2013 est.)//6.98% (31 December 2012 est.)
$526.5 billion (31 December 2013 est.)//$534.8 billion (31 December 2012 est.)
$1.661 trillion (31 December 2013 est.)//$1.648 trillion (31 December 2012 est.)
Fiscal Capacity & Public FinanceBack to top ↑
- Revenue Mobilisation & Tax Administration
- Public Expenditure & Budget Management
- Sovereign Debt & Treasury Management
- Public Investment Management
33.2% of GDP (2013 est.)
-1.3% of GDP (2013 est.)
32.6% of GDP (2013 est.)//32.4% of GDP (2012 est.)
1 July - 30 June
Financial System Depth & AccessBack to top ↑
- Banking System Capacity
- Capital Markets Depth & Development
- Long-Term & Institutional Capital
- Financial Inclusion & Household Access
- Development & Policy Finance
$2.222 trillion (31 December 2013 est.)//$2.255 trillion (31 December 2012 est.)
$NA (31 December 2012 est.)//$1.198 trillion (31 December 2011)//$1.455 trillion (31 December 2010 est.)
24.4% of GDP (2013 est.)//25.2% of GDP (2012 est.)//25.1% of GDP (2011 est.)
Financial Regulation & IntegrityBack to top ↑
- Prudential Regulation & Supervision
- Financial Integrity & Illicit Finance Control
- Market Conduct & Consumer Protection
- Payment & Market Infrastructure Oversight
Financial Stability & Crisis ManagementBack to top ↑
- Macroprudential & Systemic Oversight
- Crisis Management, Resolution & Deposit Insurance
- External Liquidity & Financial Safety Nets
Sovereign Capital & External Financial PowerBack to top ↑
- Official Reserves Management
- Sovereign Wealth & Public Asset Management
- Currency Internationalisation & Reserve Status
- Capital Account & Flow Management
- International Financial Centre Capability
$48.8 billion (31 December 2013 est.)//$49.15 billion (31 December 2012 est.)
$1.506 trillion (31 December 2013 est.)//$1.497 trillion (31 December 2012 est.)
GINC Capability Domains · Chapter 11
Production and Innovation
🇦🇺 Australia’s output, industry and the engine of prosperity
Economic Output & ProductivityBack to top ↑
The Australian economy has experienced continuous growth and features low unemployment, contained inflation, very low public debt, and a strong and stable financial system. By 2012, Australia had experienced more than 20 years of continued economic growth, averaging 3.5% a year. Demand for resources and energy from Asia and especially China has grown rapidly, creating a channel for resources investments and growth in commodity exports. The high Australian dollar has hurt the manufacturing sector, while the services sector is the largest part of the Australian economy, accounting for about 70% of GDP and 75% of jobs. Australia was comparatively unaffected by the global financial crisis as the banking system has remained strong and inflation is under control. Australia has benefited from a dramatic surge in its terms of trade in recent years, stemming from rising global commodity prices. Australia is a significant exporter of natural resources, energy, and food. Australia's abundant and diverse natural resources attract high levels of foreign investment and include extensive reserves of coal, iron, copper, gold, natural gas, uranium, and renewable energy sources. A series of major investments, such as the US$40 billion Gorgon Liquid Natural Gas project, will significantly expand the resources sector. Australia is an open market with minimal restrictions on imports of goods and services. The process of opening up has increased productivity, stimulated growth, and made the economy more flexible and dynamic. Australia plays an active role in the World Trade Organization, APEC, the G20, and other trade forums. Australia has bilateral free trade agreements (FTAs) with Chile, Malaysia, New Zealand, Singapore, Thailand, and the US, has a regional FTA with ASEAN and New Zealand, is negotiating agreements with China, India, Indonesia, Japan, and the Republic of Korea, as well as with its Pacific neighbors and the Gulf Cooperation Council countries, and is also working on the Trans-Pacific Partnership Agreement with Brunei Darussalam, Canada, Chile, Malaysia, Mexico, New Zealand, Peru, Singapore, the US, and Vietnam.
$998.3 billion (2013 est.)//$974.2 billion (2012 est.)//$939.7 billion (2011 est.)
2.5% (2013 est.)//3.7% (2012 est.)//2.4% (2011 est.)
$43,000 (2013 est.)//$42,500 (2012 est.)//$41,700 (2011 est.)
$1.488 trillion (2013 est.)
Labour & EmploymentBack to top ↑
- Employment & Labour Force Participation
- Labour Market Institutions & Wage Setting
- Employment Services & Skills Matching
- Labour Adjustment, Transition & Formalisation
12.44 million (2013 est.)
5.7% (2013 est.)//5.2% (2012 est.)
Industrial & Sectoral BaseBack to top ↑
- Manufacturing & Advanced Industry
- Foundational & Process Industries
- Agrifood & Primary Production
- Services Economy
wheat, barley, sugarcane, fruits; cattle, sheep, poultry
mining, industrial and transportation equipment, food processing, chemicals, steel
3.2% (2013 est.)
Structural Transformation & ComplexityBack to top ↑
Business Dynamism & EntrepreneurshipBack to top ↑
- Entrepreneurship & Firm Creation
- Risk Capital & Scale-Up Finance
- Firm Growth, Exit & Renewal
- Competition & Market Contestability
Innovation & CommercialisationBack to top ↑
- Business Innovation Capability
- Research Commercialisation & Knowledge Transfer
- Intellectual Property & Intangible Assets
- Innovation Ecosystems & Clusters
Technology Adoption & DiffusionBack to top ↑
GINC Capability Domains · Chapter 12
Trade and Investment
🇦🇺 Australia’s markets, capital and the terms of global exchange
Overall tradeBack to top ↑
$363B of exports to 209 partners and $289B of imports from 209 in 2024, a surplus of $74.3B.
- Exports
- $363B209 partners
- Imports
- $289B209 partners
- Balance
- +$74.3Bsurplus
- Total trade
- $652B2024
ExportsBack to top ↑
Where its exports go
The largest partners in 2024, with each one's share of the nation's exports.
| Partner | Value | Share | |
|---|---|---|---|
| China | $132B | 36% | |
| Japan | $49.3B | 14% | |
| South Korea | $29.4B | 8.1% | |
| India | $18.1B | 5.0% | |
| United States | $15.4B | 4.2% | |
| Taiwan | $14.5B | 4.0% | |
| Indonesia | $10.1B | 2.8% | |
| United Kingdom | $8.02B | 2.2% | |
| Singapore | $7.75B | 2.1% | |
| Hong Kong | $7.60B | 2.1% | |
| Malaysia | $7.29B | 2.0% | |
| Vietnam | $6.87B | 1.9% | |
| Thailand | $5.40B | 1.5% | |
| New Zealand | $5.18B | 1.4% | |
| Switzerland | $4.84B | 1.3% | |
| Germany | $3.76B | 1.0% | |
| United Arab Emirates | $3.60B | 1.0% | |
| Philippines | $3.28B | 0.9% | |
| Canada | $2.06B | 0.6% | |
| Netherlands | $1.77B | 0.5% |
What it exports
The largest categories in 2024.
| Category | Value | Share | |
|---|---|---|---|
| Mineral fuels, oils, distillation products | $116B | 32% | |
| Ores slag and ash | $105B | 29% | |
| Pearls, precious stones, metals, coins | $37.1B | 10% | |
| Meat and edible meat offal | $14.1B | 3.9% | |
| Cereals | $8.29B | 2.3% | |
| Inorganic chemicals, precious metal compound, isotope | $7.99B | 2.2% | |
| Aluminum | $4.71B | 1.3% | |
| Machinery, nuclear reactors, boilers | $4.47B | 1.2% | |
| Copper | $4.36B | 1.2% | |
| Salt, sulphur, earth, stone, plaster, lime and cement | $4.22B | 1.2% | |
| Oil seed, oleaginous fruits, grain, seed, fruits | $3.86B | 1.1% | |
| Optical, photo, technical, medical apparatus | $3.75B | 1.0% | |
| Pharmaceutical products | $3.14B | 0.9% | |
| Electrical, electronic equipment | $2.86B | 0.8% | |
| Edible vegetables and certain roots and tubers | $2.68B | 0.7% |
ImportsBack to top ↑
Where its imports come from
The largest partners in 2024, with each one's share of the nation's imports.
| Partner | Value | Share | |
|---|---|---|---|
| China | $75.2B | 26% | |
| United States | $34.2B | 12% | |
| Japan | $17.1B | 5.9% | |
| South Korea | $16.6B | 5.8% | |
| Thailand | $14.0B | 4.8% | |
| Germany | $12.6B | 4.4% | |
| Malaysia | $11.5B | 4.0% | |
| Singapore | $10.0B | 3.5% | |
| Vietnam | $7.87B | 2.7% | |
| India | $7.81B | 2.7% | |
| Taiwan | $6.27B | 2.2% | |
| Italy | $6.18B | 2.1% | |
| Indonesia | $5.40B | 1.9% | |
| United Kingdom | $5.38B | 1.9% | |
| France | $5.38B | 1.9% | |
| New Zealand | $5.17B | 1.8% | |
| Mexico | $3.02B | 1.0% | |
| Switzerland | $2.84B | 1.0% | |
| Papua New Guinea | $2.69B | 0.9% | |
| Canada | $2.56B | 0.9% |
What it imports
The largest categories in 2024.
| Category | Value | Share | |
|---|---|---|---|
| Vehicles other than railway, tramway | $43.1B | 15% | |
| Machinery, nuclear reactors, boilers | $41.4B | 14% | |
| Mineral fuels, oils, distillation products | $37.8B | 13% | |
| Electrical, electronic equipment | $31.9B | 11% | |
| Pharmaceutical products | $10.9B | 3.8% | |
| Optical, photo, technical, medical apparatus | $10.1B | 3.5% | |
| Pearls, precious stones, metals, coins | $8.71B | 3.0% | |
| Plastics | $7.94B | 2.7% | |
| Articles of iron or steel | $6.84B | 2.4% | |
| Furniture, lighting signs, prefabricated buildings | $5.46B | 1.9% | |
| Aircraft, spacecraft | $4.26B | 1.5% | |
| Articles of apparel, knit or crocheted | $4.24B | 1.5% | |
| Rubbers | $4.08B | 1.4% | |
| Articles of apparel, not knit or crocheted | $4.05B | 1.4% | |
| Fertilizers | $3.82B | 1.3% |
In a list, the bar runs to the largest in that list. The line is each figure’s history from 2000, drawn to its own peak: it shows the shape of the years, and the value shows the size.
External balanceBack to top ↑
-$44.9 billion (2013 est.)//-$57.14 billion (2012 est.)
Trade Facilitation & LogisticsBack to top ↑
Trade Policy & Market AccessBack to top ↑
- Trade Policy & Negotiation Capability
- Market Access & Agreements Network
- Trade Law & Enforcement
- Standards, Conformity & Quality Infrastructure
Digital & Services TradeBack to top ↑
- Services Trade Capability
- Digital Trade & E-Commerce
- Data Flows & Digital Trade Governance
- Tourism & Visitor Economy
Investment Attraction & ProjectionBack to top ↑
- Investment Attraction & Facilitation
- Investment Absorption & Linkages
- Outward Investment & Global Corporate Presence
$661.6 billion (31 December 2013 est.)//$610.8 billion (31 December 2012 est.)
$440.1 billion (31 December 2013 est.)//$426 billion (31 December 2012 est.)
Export Capability & SophisticationBack to top ↑
$251.7 billion (2013 est.)//$257.9 billion (2012 est.)
China 29.5%, Japan 19.3%, South Korea 8%, India 4.9% (2012)
coal, iron ore, gold, meat, wool, alumina, wheat, machinery and transport equipment
Global Value Chain PositionBack to top ↑
- Value Chain Participation & Integration
- Value Chain Position & Upgrading
- Regional Integration & Hub Anchoring
Economic Leverage & DependenceBack to top ↑
- Strategic Supply Security
- Concentration Risk & Revenue Stabilisation
- Economic Leverage & Coercion Resistance
$245.8 billion (2013 est.)//$263 billion (2012 est.)
China 18.4%, US 11.7%, Japan 7.9%, Singapore 6%, Germany 4.6%, Thailand 4.2%, South Korea 4.1% (2012)
machinery and transport equipment, computers and office machines, telecommunication equipment and parts; crude oil and petroleum products
Australia · you are in
Historical Context
Foundations
GINC Capability Domains
Find in this brief · Australia