
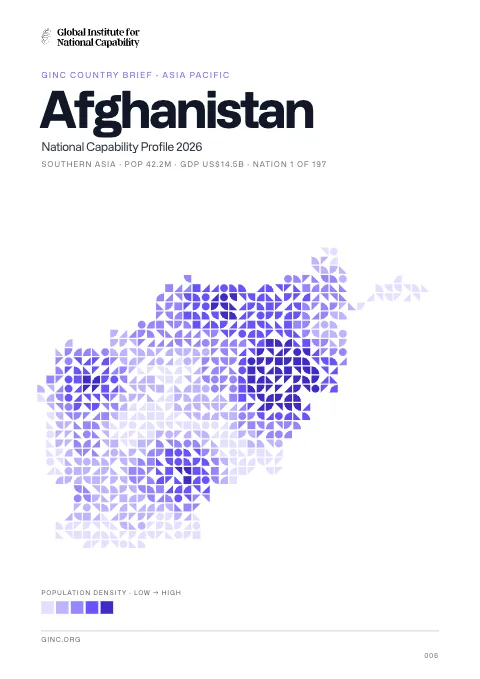
Afghanistan
Afghanistan is a landlocked Islamic republic in South Asia, home to 32 million people, with its capital at Kabul.
Contents
12 chapters
Foundations
01–03
At a glance
- Area
- 652.2Kkm²#41 World#2 South Asia
- Population
- 31.8M#40 World#3 South Asia
- GDP (market)
- $20.6B
- GDP (PPP)
- $45.3B#100 World#4 South Asia
- GDP per capita
- $1.1K#215 World#7 South Asia
The whole brief
Afghanistan National Capability Profile 2026
Foundations · Chapter 01
Historical Context
🇦🇫 Afghanistan’s understanding the origins and evolution of the modern nation
BackgroundBack to top ↑
Ahmad Shah DURRANI unified the Pashtun tribes and founded Afghanistan in 1747. The country served as a buffer between the British and Russian Empires until it won independence from notional British control in 1919. A brief experiment in democracy ended in a 1973 coup and a 1978 communist counter-coup. The Soviet Union invaded in 1979 to support the tottering Afghan communist regime, touching off a long and destructive war. The USSR withdrew in 1989 under relentless pressure by internationally supported anti-communist mujahedin rebels. A series of subsequent civil wars saw Kabul finally fall in 1996 to the Taliban, a hardline Pakistani-sponsored movement that emerged in 1994 to end the country's civil war and anarchy. Following the 11 September 2001 terrorist attacks, a US, Allied, and anti-Taliban Northern Alliance military action toppled the Taliban for sheltering Osama BIN LADIN. The UN-sponsored Bonn Conference in 2001 established a process for political reconstruction that included the adoption of a new constitution, a presidential election in 2004, and National Assembly elections in 2005. In December 2004, Hamid KARZAI became the first democratically elected president of Afghanistan and the National Assembly was inaugurated the following December. KARZAI was re-elected in August 2009 for a second term. Despite gains toward building a stable central government, a resurgent Taliban and continuing provincial instability - particularly in the south and the east - remain serious challenges for the Afghan Government.
IndependenceBack to top ↑
19 August 1919 (from UK control over Afghan foreign affairs)
National holidayBack to top ↑
Independence Day, 19 August (1919)
Foundations · Chapter 02
Geography
🇦🇫 Afghanistan’s territory, resources and strategic position
Location and areaBack to top ↑
Southern Asia, north and west of Pakistan, east of Iran
33 00 N, 65 00 E
Asia
almost six time the size of Virginia; slightly smaller than Texas
0 km (landlocked)
none (landlocked)
Terrain and resourcesBack to top ↑
mostly rugged mountains; plains in north and southwest
natural gas, petroleum, coal, copper, chromite, talc, barites, sulfur, lead, zinc, iron ore, salt, precious and semiprecious stones
32,080 sq km (2003)
Settlement and hazardsBack to top ↑
damaging earthquakes occur in Hindu Kush mountains; flooding; droughts
landlocked; the Hindu Kush mountains that run northeast to southwest divide the northern provinces from the rest of the country; the highest peaks are in the northern Vakhan (Wakhan Corridor)
OtherBack to top ↑
65.33 cu km (2011)
limited natural freshwater resources; inadequate supplies of potable water; soil degradation; overgrazing; deforestation (much of the remaining forests are being cut down for fuel and building materials); desertification; air and water pollution
Foundations · Chapter 03
Environment
🇦🇫 Afghanistan’s environmental conditions, resources and national resilience
ClimateBack to top ↑
arid to semiarid; cold winters and hot summers
Emissions and pollutionBack to top ↑
Water, waste and foodBack to top ↑
Resources and agreementsBack to top ↑
GINC Capability Domains · Chapter 04
Critical Technology
🇦🇫 Afghanistan’s technology frontiers and the pursuit of national advantage
Two counts are set side by side for 2015–2024: on the left, the papers researchers in Afghanistan published; on the right, the patent families that began there and were filed in more than one country. First by capability group, then group by group with each group’s capabilities. The badge on a card is the nation’s place among all nations. Papers are from GINC Research Analytics, patent families from GINC Patents.
Research by capability group
#124 WorldPapers published, 2015–2024
Patents by capability group
International patent families, 2015–2024
No international patent families on record for 2015–2024.
Advanced Materials & ManufacturingBack to top ↑
Research
#134 WorldPapers published, 2015–2024
Patents
International patent families, 2015–2024
No international patent families on record for 2015–2024.
Energy TechnologiesBack to top ↑
Research
#119 WorldPapers published, 2015–2024
Patents
International patent families, 2015–2024
No international patent families on record for 2015–2024.
Semiconductors & Advanced ComputingBack to top ↑
Research
#136 WorldPapers published, 2015–2024
No research topic: Semiconductor Design & EDA · Advanced Semiconductor Fabrication · Semiconductor Equipment & Materials · Advanced Packaging & Heterogeneous Integration
Patents
International patent families, 2015–2024
No international patent families on record for 2015–2024.
Artificial IntelligenceBack to top ↑
Research
#112 WorldPapers published, 2015–2024
Patents
International patent families, 2015–2024
No international patent families on record for 2015–2024.
Quantum TechnologiesBack to top ↑
Research
#111 WorldPapers published, 2015–2024
Patents
International patent families, 2015–2024
No international patent families on record for 2015–2024.
Connectivity, Cyber & Trust TechnologiesBack to top ↑
Research
#114 WorldPapers published, 2015–2024
Patents
International patent families, 2015–2024
No international patent families on record for 2015–2024.
Sensing, Timing & NavigationBack to top ↑
Research
#132 WorldPapers published, 2015–2024
Patents
International patent families, 2015–2024
No international patent families on record for 2015–2024.
Robotics & Autonomous SystemsBack to top ↑
Research
#138 WorldPapers published, 2015–2024
No research topic: Human-Machine Interfaces
Patents
International patent families, 2015–2024
No international patent families on record for 2015–2024.
Biotechnology & Health TechnologiesBack to top ↑
Research
#124 WorldPapers published, 2015–2024
Patents
International patent families, 2015–2024
No international patent families on record for 2015–2024.
Medicine and BioTech
Clinical research and life-science invention, drawn from the same series that drive the metric pages. Each card opens the full cross-country comparison.
Space TechnologiesBack to top ↑
- Space Launch & Reusable Systems
- Advanced Propulsion & Hypersonic Systems
- Satellite & Constellation Technologies
GINC Capability Domains · Chapter 05
Strategic Infrastructure
🇦🇫 Afghanistan’s energy, connectivity and the material foundations of capability
Resource InfrastructureBack to top ↑
1,950 bbl/day (2012 est.)
0 bbl/day (2010 est.)
0 bbl/day (2010 est.)
NA bbl (1 January 2013 est.)
0 bbl/day (2010 est.)
4,229 bbl/day (2011 est.)
0 bbl/day (2010 est.)
36,250 bbl/day (2010 est.)
140 million cu m (2011 est.)
140 million cu m (2010 est.)
0 cu m (2011 est.)
0 cu m (2011 est.)
49.55 billion cu m (1 January 2013 est.)
gas 466 km (2013)
Agriculture & Food InfrastructureBack to top ↑
- Irrigation & Agricultural Water
- Livestock & Veterinary
- Fisheries & Aquaculture
- Storage, Cold Chain & Markets
Energy InfrastructureBack to top ↑
- Thermal Generation
- Nuclear Generation
- Nuclear Fuel Cycle & Radioactive Waste
- Hydropower
- Renewable Generation
- Transmission & Distribution
- System Control & Dispatch
- Storage & Fuel Supply
489,100 kW (2010 est.)
986.1 million kWh (2010 est.)
2.489 billion kWh (2010 est.)
0 kWh (2012 est.)
1.572 billion kWh (2010 est.)
23.5% of total installed capacity (2010 est.)
0% of total installed capacity (2010 est.)
76.5% of total installed capacity (2010 est.)
0% of total installed capacity (2010 est.)
6.589 million Mt (2011 est.)
Water, Sanitation & Waste InfrastructureBack to top ↑
- Dams, Reservoirs & Flood Defence
- Water Supply & Treatment
- Bulk Water Transfer & Desalination
- Wastewater & Sanitation
- Solid Waste & Recycling
Advanced ManufacturingBack to top ↑
- Materials & Inputs
- Chemicals & Hazardous Process Industry
- Production Systems
- Supply Chain & Ecosystem
- Workforce & Innovation
Transport InfrastructureBack to top ↑
- Seaports & Terminals
- Air Infrastructure
- Air Navigation & Traffic Management
- Inland Waterways & Ferries
- Rail Infrastructure
- Roads & Bridges
- Logistics, Multimodal & Border Infrastructure
- Postal & Parcel
52 (2013)
9 (2013)
1,200 km; (chiefly Amu Darya, which handles vessels up to 500 DWT) (2011)
Communications & Digital InfrastructureBack to top ↑
- Subsea Cables & International Gateways
- Core & Backbone Networks
- Mobile & Wireless Networks
- Spectrum & Broadcasting
- Data Centres, Compute & Cloud
- Data Resources
- AI Tools & Applications
13,500 (2012)
18 million (2012)
1 million (2009)
223 (2012)
.af
Financial InfrastructureBack to top ↑
- Currency & Reserves
- Payments & Settlement Systems
- Markets, Exchanges & Depositories
- Banks, Insurers & Systemic Institutions
Social InfrastructureBack to top ↑
- Health Infrastructure
- Public Health & Laboratories
- Medical Supply & Stockpiles
- Education & Skills Infrastructure
- Research & Scientific Facilities
- Housing, Community & Social Services
- Government & Public Administration
- Cultural, Community & Recreational Infrastructure
- Justice & Corrections
- Emergency Services & Civil Protection
- Hydrometeorology & Early Warning
Space, Aerospace & Defence InfrastructureBack to top ↑
GINC Capability Domains · Chapter 06
National Security
🇦🇫 Afghanistan’s force, intelligence and the defence of the nation
Disputes and terrorismBack to top ↑
Afghan, Coalition, and Pakistan military meet periodically to clarify the alignment of the boundary on the ground and on maps; Afghan and Iranian commissioners have discussed boundary monument densification and resurvey; Iran protests Afghanistan's restricting flow of dammed Helmand River tributaries during drought; Pakistan has sent troops across and built fences along some remote tribal areas of its treaty-defined Durand Line border with Afghanistan which serve as bases for foreign terrorists and other illegal activities; Russia remains concerned about the smuggling of poppy derivatives from Afghanistan through Central Asian countries
Force Generation & MobilisationBack to top ↑
Afghan Armed Forces: Afghan National Army (ANA, includes Afghan Air Force (AAF)) (2011)
18 is the legal minimum age for voluntary military service; no conscription (2012)
NA% (2012)//4.74% of GDP (2011)//NA% (2010)
Forces under arms
Active-duty strength on the Correlates of War series, which reaches back to 1816 and so carries a nation’s whole record of mobilisation rather than its present establishment. The card opens the full cross-country comparison.
Intelligence & AssessmentBack to top ↑
- Imagery & Geospatial Intelligence
- Signals & Cyber Intelligence
- Technical & Measurement Intelligence
- Open-Source & Financial Intelligence
- Human Intelligence & Counterintelligence
- All-Source Analysis & Warning
Joint Command, Projection & SustainmentBack to top ↑
- Command, Control & Communications
- Strategic Lift & Mobility
- Expeditionary & Peace Operations
- Operational Sustainment & War Reserves
- Defence Industrial Mobilisation
- CBRN Defence
Land PowerBack to top ↑
- Combined Arms Manoeuvre
- Land Fires
- Battlefield Aviation & Uncrewed Systems
- Special Operations & Irregular Warfare
Maritime PowerBack to top ↑
- Maritime Security & Constabulary
- Sea Denial & Undersea Warfare
- Sea Control
- Amphibious & Expeditionary Operations
Air PowerBack to top ↑
- Air Sovereignty & Policing
- Control of the Air
- Air Strike & Interdiction
- Airborne ISR, Early Warning & Battle Management
Strategic Strike & Missile DefenceBack to top ↑
Space OperationsBack to top ↑
Cyber & Electromagnetic OperationsBack to top ↑
Nuclear DeterrenceBack to top ↑
GINC Capability Domains · Chapter 07
Human Capital
🇦🇫 Afghanistan’s population, health and the skills that sustain capability
DemographyBack to top ↑
31,822,848 (July 2014 est.)
2.29% (2014 est.)
38.84 births/1,000 population (2014 est.)
14.12 deaths/1,000 population (2014 est.)
5.43 children born/woman (2014 est.)
20.1
21.8% (2010)
Migration and urbanisationBack to top ↑
-1.83 migrant(s)/1,000 population (2014 est.)
KABUL (capital) 3.097 million (2011)
Welfare and equityBack to top ↑
36% (FY08/09)
DisplacementBack to top ↑
Early Childhood DevelopmentBack to top ↑
32.9% (2004)
Foundational EducationBack to top ↑
NA
Advanced EducationBack to top ↑
Technical & Vocational SkillsBack to top ↑
Digital & AI CompetenceBack to top ↑
Generative AI adoption
Modelled share of working-age adults using generative AI, from Microsoft telemetry scaled to each country’s 15–64 population. A measure of how fast a workforce is absorbing the technology rather than of how much of it a nation builds. The card opens the full cross-country comparison.
Lifelong Learning & ReskillingBack to top ↑
Research Talent & Knowledge CreationBack to top ↑
Population HealthBack to top ↑
460 deaths/100,000 live births (2010)
2.2% (2008)
0.1% (2012 est.)
4,300 (2012 est.)
300 (2012 est.)
Health System CapabilityBack to top ↑
9.6% of GDP (2011)
0.19 physicians/1,000 population (2010)
0.4 beds/1,000 population (2010)
GINC Capability Domains · Chapter 08
Governance and Integrity
🇦🇫 Afghanistan’s institutions, law and the integrity of the state
State structureBack to top ↑
Islamic republic
34 provinces (welayat, singular - welayat); Badakhshan, Badghis, Baghlan, Balkh, Bamyan, Daykundi, Farah, Faryab, Ghazni, Ghor, Helmand, Herat, Jowzjan, Kabul, Kandahar, Kapisa, Khost, Kunar, Kunduz, Laghman, Logar, Nangarhar, Nimroz, Nuristan, Paktika, Paktiya, Panjshir, Parwan, Samangan, Sar-e Pul, Takhar, Uruzgan, Wardak, Zabul
several previous; latest drafted 14 December 2003 - 4 January 2004, signed 16 January 2004, ratified 26 January 2004 (2012)
18 years of age; universal
Political Institutions & Civic ParticipationBack to top ↑
- Electoral Management & Integrity
- Legislature & Deliberative Institutions
- Citizen Participation & Civic Space
the bicameral National Assembly consists of the Meshrano Jirga or House of Elders (102 seats, two-thirds of members elected from provincial councils for four-year terms, and one-third nominated by the president for five-year terms) and the Wolesi Jirga or House of People (no more than 250 seats; members directly elected for five-year terms)
note - the Ministry of Justice licensed 84 political parties as of December 2012
Justice System & Fundamental RightsBack to top ↑
- Judicial Independence & Court Capability
- Access to Justice & Legal Services
- Fundamental Rights Protection
- Human Rights Institutions & Equality Bodies
mixed legal system of civil, customary, and Islamic law
has not submitted an ICJ jurisdiction declaration; accepts ICCt jurisdiction
Internal Security & OrderBack to top ↑
world's largest producer of opium; poppy cultivation increased 57 percent, from 115,000 hectares in 2011 to 180,000 hectares in 2012; despite the increase in area under cultivation, the effects of poor weather and crop disease resulted in lower yield so potential opium production remained stable at 4,300 mt in 2012 compared to 4,400 mt in 2011; the Taliban and other antigovernment groups participate in and profit from the opiate trade, which is a key source of revenue for the Taliban inside Afghanistan; widespread corruption and instability impede counterdrug efforts; most of the heroin consumed in Europe and Eurasia is derived from Afghan opium; Afghanistan is also struggling to respond to a burgeoning domestic opiate addiction problem; vulnerable to drug money laundering through informal financial networks; regional source of hashish (2013)
Regulatory Governance & Strategic ControlsBack to top ↑
- Regulatory Quality & Better Regulation
- Regulatory Delivery & Independent Regulators
- Strategic Controls & Economic Security Administration
Government Effectiveness & Public AdministrationBack to top ↑
- Centre of Government & Policy Coordination
- Civil Service & Public Workforce
- Digital Government & Service Delivery
- Legal Identity & Civil Registration
- Statistical & Data Capability
Public Integrity & Anti-CorruptionBack to top ↑
Transparency, Oversight & AccountabilityBack to top ↑
- Right to Information & Open Government
- Independent Oversight & Supreme Audit
- Independent Media & Journalist Safety
National Resilience & Crisis ManagementBack to top ↑
GINC Capability Domains · Chapter 09
Information and Influence
🇦🇫 Afghanistan’s identity, media and the projection of influence
Identity and cultureBack to top ↑
Afghan Persian or Dari (official) 50%, Pashto (official) 35%, Turkic languages (primarily Uzbek and Turkmen) 11%, 30 minor languages (primarily Balochi and Pashai) 4%, much bilingualism, but Dari functions as the lingua franca
Sunni Muslim 80%, Shia Muslim 19%, other 1%
Pashtun 42%, Tajik 27%, Hazara 9%, Uzbek 9%, Aimak 4%, Turkmen 3%, Baloch 2%, other 4%
lion
three equal vertical bands of black (hoist side), red, and green, with the national emblem in white centered on the red band and slightly overlapping the other two bands; the center of the emblem features a mosque with pulpit and flags on either side, below the mosque are numerals for the solar year 1298 (1919 in the Gregorian calendar, the year of Afghan independence from the UK); this central image is circled by a border consisting of sheaves of wheat on the left and right, in the upper-center is an Arabic inscription of the Shahada (Muslim creed) below which are rays of the rising sun over the Takbir (Arabic expression meaning "God is great"), and at bottom center is a scroll bearing the name Afghanistan; black signifies the past, red is for the blood shed for independence, and green can represent either hope for the future, agricultural prosperity, or Islam
Diplomatic Statecraft & Global NetworksBack to top ↑
- Diplomatic Network & Consular Reach
- Multilateral Leadership & Norm Setting
- Agenda-Setting & Convening
- Mediation & Crisis Diplomacy
ADB, CICA, CP, ECO, EITI (candidate country), FAO, G-77, IAEA, IBRD, ICAO, ICC (NGOs), ICRM, IDA, IDB, IFAD, IFC, IFRCS, ILO, IMF, Interpol, IOC, IOM, IPU, ISO (correspondent), ITSO, ITU, MIGA, MINUSMA, NAM, OIC, OPCW, OSCE (partner), SAARC, SACEP, SCO (observer), UN, UNCTAD, UNESCO, UNIDO, UNWTO, UPU, WCO, WFTU (NGOs), WHO, WIPO, WMO, WTO
Alliances & Security CooperationBack to top ↑
Development Cooperation & Global AssistanceBack to top ↑
Culture, Language & Education DiplomacyBack to top ↑
- Cultural & Language Institutes
- Creative Industries & Cultural Export Reach
- Heritage & Cultural Institutions
- Education Diplomacy & Alumni Networks
- Sports & Major Events
Diaspora & Global CommunitiesBack to top ↑
Information Environment & Strategic CommunicationBack to top ↑
- Strategic Communications & Public Diplomacy
- International Media & Broadcasting
- Information Defence & Counter-Interference
state-owned broadcaster, Radio Television Afghanistan (RTA), operates a series of radio and television stations in Kabul and the provinces; an estimated 150 private radio stations, 50 TV stations, and about a dozen international broadcasters are available (2007)
GINC Capability Domains · Chapter 10
Financial Strength
🇦🇫 Afghanistan’s fiscal depth, reserves and the capacity to act
Monetary & Currency CapabilityBack to top ↑
- Monetary Policy & Price Stability
- Exchange Rate & External Account Management
- Currency Issuance & Digital Money
6.8% (2012 est.)//5.7% (2011 est.)
afghanis (AFA) per US dollar -//50.92 (2012 est.)//46.75 (2011 est.)//46.45 (2010)
15% (31 December 2012 est.)//15.15% (31 December 2011 est.)
$6.121 billion (31 December 2012 est.)//$5.928 billion (31 December 2011 est.)
$6.499 billion (31 December 2012 est.)//$6.351 billion (31 December 2011 est.)
Fiscal Capacity & Public FinanceBack to top ↑
- Revenue Mobilisation & Tax Administration
- Public Expenditure & Budget Management
- Sovereign Debt & Treasury Management
- Public Investment Management
11.3% of GDP (2012 est.)
-8.7% of GDP (2012 est.)
21 December - 20 December
Financial System Depth & AccessBack to top ↑
- Banking System Capacity
- Capital Markets Depth & Development
- Long-Term & Institutional Capital
- Financial Inclusion & Household Access
- Development & Policy Finance
$-819.6 million (31 December 2012 est.)//$-520.2 million (31 December 2011 est.)
$NA
Financial Regulation & IntegrityBack to top ↑
- Prudential Regulation & Supervision
- Financial Integrity & Illicit Finance Control
- Market Conduct & Consumer Protection
- Payment & Market Infrastructure Oversight
Financial Stability & Crisis ManagementBack to top ↑
- Macroprudential & Systemic Oversight
- Crisis Management, Resolution & Deposit Insurance
- External Liquidity & Financial Safety Nets
Sovereign Capital & External Financial PowerBack to top ↑
- Official Reserves Management
- Sovereign Wealth & Public Asset Management
- Currency Internationalisation & Reserve Status
- Capital Account & Flow Management
- International Financial Centre Capability
$5.983 billion (31 December 2012 est.)//$5.268 billion (31 December 2011 est.)
$1.28 billion (FY10/11)//$2.7 billion (FY08/09)
GINC Capability Domains · Chapter 11
Production and Innovation
🇦🇫 Afghanistan’s output, industry and the engine of prosperity
Economic Output & ProductivityBack to top ↑
Afghanistan's economy is recovering from decades of conflict. The economy has improved significantly since the fall of the Taliban regime in 2001 largely because of the infusion of international assistance, the recovery of the agricultural sector, and service sector growth. Despite the progress of the past few years, Afghanistan is extremely poor, landlocked, and highly dependent on foreign aid. Much of the population continues to suffer from shortages of housing, clean water, electricity, medical care, and jobs. Criminality, insecurity, weak governance, lack of infrastructure, and the Afghan Government's difficulty in extending rule of law to all parts of the country pose challenges to future economic growth. Afghanistan's living standards are among the lowest in the world. The international community remains committed to Afghanistan's development, pledging over $67 billion at nine donors' conferences between 2003-10. In July 2012, the donors at the Tokyo conference pledged an additional $16 billion in civilian aid through 2015. Despite this help, the Government of Afghanistan will need to overcome a number of challenges, including low revenue collection, anemic job creation, high levels of corruption, weak government capacity, and poor public infrastructure. Afghanistan's growth rate slowed markedly in 2013.
$45.3 billion (2013 est.)//$34.25 billion (2012 est.)//$30.45 billion (2011 est.)
3.1% (2013 est.)//12.5% (2012 est.)//6.1% (2011 est.)
$1,100 (2013 est.)//$1,100 (2012 est.)//$1,000 (2011 est.)
$20.65 billion (2013 est.)
Labour & EmploymentBack to top ↑
- Employment & Labour Force Participation
- Labour Market Institutions & Wage Setting
- Employment Services & Skills Matching
- Labour Adjustment, Transition & Formalisation
7.512 million (2012 est.)
35% (2008 est.)//40% (2005 est.)
Industrial & Sectoral BaseBack to top ↑
- Manufacturing & Advanced Industry
- Foundational & Process Industries
- Agrifood & Primary Production
- Services Economy
opium, wheat, fruits, nuts; wool, mutton, sheepskins, lambskins
small-scale production of bricks, textiles, soap, furniture, shoes, fertilizer, apparel, food products, non-alcoholic beverages, mineral water, cement; handwoven carpets; natural gas, coal, copper
NA%
Structural Transformation & ComplexityBack to top ↑
Business Dynamism & EntrepreneurshipBack to top ↑
- Entrepreneurship & Firm Creation
- Risk Capital & Scale-Up Finance
- Firm Growth, Exit & Renewal
- Competition & Market Contestability
Innovation & CommercialisationBack to top ↑
- Business Innovation Capability
- Research Commercialisation & Knowledge Transfer
- Intellectual Property & Intangible Assets
- Innovation Ecosystems & Clusters
Technology Adoption & DiffusionBack to top ↑
GINC Capability Domains · Chapter 12
Trade and Investment
🇦🇫 Afghanistan’s markets, capital and the terms of global exchange
Overall tradeBack to top ↑
$1.62B of exports to 113 partners and $5.72B of imports from 74 in 2024, a deficit of $4.11B.
- Exports
- $1.62B113 partners
- Imports
- $5.72B74 partners
- Balance
- −$4.11Bdeficit
- Total trade
- $7.34B2024
ExportsBack to top ↑
Where its exports go
The largest partners in 2024, with each one's share of the nation's exports.
| Partner | Value | Share | |
|---|---|---|---|
| India | $665M | 41% | |
| Pakistan | $659M | 41% | |
| Uzbekistan | $44.7M | 2.8% | |
| China | $42.1M | 2.6% | |
| Turkey | $34.3M | 2.1% | |
| Saudi Arabia | $27.4M | 1.7% | |
| United States | $22.8M | 1.4% | |
| Kazakhstan | $17.4M | 1.1% | |
| Germany | $15.9M | 1.0% | |
| France | $10.0M | 0.6% | |
| Canada | $9.02M | 0.6% | |
| Switzerland | $7.29M | 0.5% | |
| Spain | $6.21M | 0.4% | |
| United Kingdom | $4.93M | 0.3% | |
| Kyrgyzstan | $4.58M | 0.3% | |
| South Korea | $4.54M | 0.3% | |
| Italy | $4.50M | 0.3% | |
| Netherlands | $3.52M | 0.2% | |
| Austria | $3.06M | 0.2% | |
| Qatar | $2.93M | 0.2% |
What it exports
The largest categories in 2024.
| Category | Value | Share | |
|---|---|---|---|
| Edible fruits, nuts, peel of citrus fruit, melons | $593M | 37% | |
| Edible vegetables and certain roots and tubers | $249M | 15% | |
| Cotton | $226M | 14% | |
| Lac, gums, resins | $123M | 7.6% | |
| Coffee, tea, mate and spices | $109M | 6.7% | |
| Mineral fuels, oils, distillation products | $103M | 6.4% | |
| Oil seed, oleaginous fruits, grain, seed, fruits | $60.7M | 3.8% | |
| Beverages, spirits and vinegar | $28.2M | 1.7% | |
| Carpets and other textile floor coverings | $16.0M | 1.0% | |
| Pearls, precious stones, metals, coins | $15.9M | 1.0% | |
| Salt, sulphur, earth, stone, plaster, lime and cement | $8.03M | 0.5% | |
| Machinery, nuclear reactors, boilers | $6.21M | 0.4% | |
| Works of art, collectors' pieces and antiques | $6.15M | 0.4% | |
| Aluminum | $6.09M | 0.4% | |
| Electrical, electronic equipment | $5.36M | 0.3% |
ImportsBack to top ↑
Where its imports come from
The largest partners in 2024, with each one's share of the nation's imports.
| Partner | Value | Share | |
|---|---|---|---|
| China | $1.54B | 27% | |
| Pakistan | $1.51B | 26% | |
| Uzbekistan | $922M | 16% | |
| Kazakhstan | $528M | 9.2% | |
| India | $334M | 5.8% | |
| Malaysia | $229M | 4.0% | |
| Turkey | $211M | 3.7% | |
| Germany | $71.2M | 1.2% | |
| Belgium | $50.9M | 0.9% | |
| Kyrgyzstan | $50.5M | 0.9% | |
| South Korea | $35.7M | 0.6% | |
| France | $27.3M | 0.5% | |
| Netherlands | $23.5M | 0.4% | |
| Italy | $17.8M | 0.3% | |
| Austria | $17.8M | 0.3% | |
| Thailand | $13.8M | 0.2% | |
| Denmark | $10.7M | 0.2% | |
| United States | $10.6M | 0.2% | |
| Kenya | $10.2M | 0.2% | |
| Poland | $9.53M | 0.2% |
What it imports
The largest categories in 2024.
| Category | Value | Share | |
|---|---|---|---|
| Milling products, malt, starches, inulin, wheat gluten | $661M | 12% | |
| Cereals | $452M | 7.9% | |
| Pharmaceutical products | $387M | 6.8% | |
| Electrical, electronic equipment | $358M | 6.3% | |
| Mineral fuels, oils, distillation products | $324M | 5.7% | |
| Animal, vegetable fats and oils, cleavage products | $320M | 5.6% | |
| Vehicles other than railway, tramway | $302M | 5.3% | |
| Sugars and sugar confectionery | $252M | 4.4% | |
| Machinery, nuclear reactors, boilers | $242M | 4.2% | |
| Manmade filaments | $222M | 3.9% | |
| Edible vegetables and certain roots and tubers | $217M | 3.8% | |
| Manmade staple fibers | $186M | 3.2% | |
| Rubbers | $160M | 2.8% | |
| Fertilizers | $122M | 2.1% | |
| Knitted or crocheted fabric | $101M | 1.8% |
In a list, the bar runs to the largest in that list. The line is each figure’s history from 2000, drawn to its own peak: it shows the shape of the years, and the value shows the size.
External balanceBack to top ↑
-$743.9 million (2011 est.)//-$736 million (2010 est.)
Trade Facilitation & LogisticsBack to top ↑
Trade Policy & Market AccessBack to top ↑
- Trade Policy & Negotiation Capability
- Market Access & Agreements Network
- Trade Law & Enforcement
- Standards, Conformity & Quality Infrastructure
Digital & Services TradeBack to top ↑
- Services Trade Capability
- Digital Trade & E-Commerce
- Data Flows & Digital Trade Governance
- Tourism & Visitor Economy
Investment Attraction & ProjectionBack to top ↑
- Investment Attraction & Facilitation
- Investment Absorption & Linkages
- Outward Investment & Global Corporate Presence
Export Capability & SophisticationBack to top ↑
$376 million (2012 est.)//$388.5 million (2011 est.)
Pakistan 32.2%, India 27%, Tajikistan 8.5%, US 6.2% (2012)
opium, fruits and nuts, handwoven carpets, wool, cotton, hides and pelts, precious and semi-precious gems
Global Value Chain PositionBack to top ↑
- Value Chain Participation & Integration
- Value Chain Position & Upgrading
- Regional Integration & Hub Anchoring
Economic Leverage & DependenceBack to top ↑
- Strategic Supply Security
- Concentration Risk & Revenue Stabilisation
- Economic Leverage & Coercion Resistance
$6.39 billion (2012 est.)//$5.154 billion (2011 est.)
Pakistan 24.3%, US 18%, Russia 8.7%, India 5.8%, China 5.6%, Germany 4.4% (2012)
machinery and other capital goods, food, textiles, petroleum products
Afghanistan · you are in
Historical Context
Foundations
GINC Capability Domains
Find in this brief · Afghanistan