
Malawi
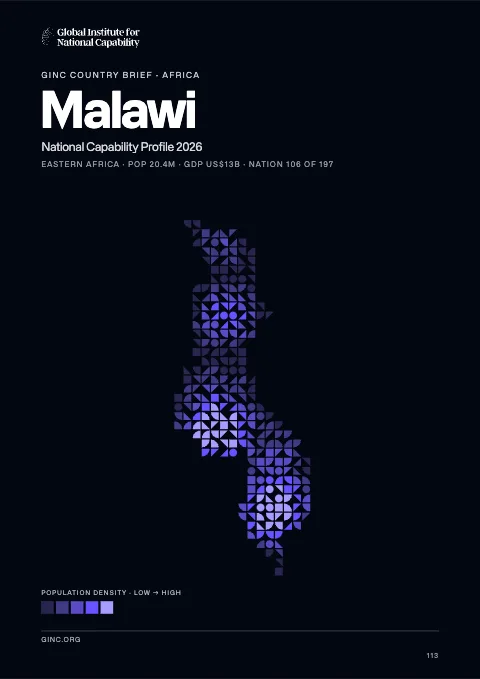
Malawi is a landlocked multiparty democracy in Africa, home to 17 million people, with its capital at Lilongwe.
Contents
12 chapters
Foundations
01–03
At a glance
- Area
- 118.5Kkm²#100 World#37 Africa
- Population
- 17.4M#63 World#20 Africa
- GDP (market)
- $3.7B
- GDP (PPP)
- $15B#142 World#33 Africa
- GDP per capita
- $900#221 World#49 Africa
The whole brief
Malawi National Capability Profile 2026
Foundations · Chapter 01
Historical Context
🇲🇼 Malawi’s understanding the origins and evolution of the modern nation
BackgroundBack to top ↑
Established in 1891, the British protectorate of Nyasaland became the independent nation of Malawi in 1964. After three decades of one-party rule under President Hastings Kamuzu BANDA the country held multiparty elections in 1994, under a provisional constitution that came into full effect the following year. President Bingu wa MUTHARIKA, elected in May 2004 after a failed attempt by the previous president to amend the constitution to permit another term, struggled to assert his authority against his predecessor and subsequently started his own party, the Democratic Progressive Party (DPP) in 2005. MUTHARIKA was reelected to a second term in May 2009. He oversaw some economic improvement in his first term, but was accused of economic mismanagement and poor governance in his second term. He died abruptly in April 2012 and was succeeded by his vice president, Joyce BANDA, who had earlier started her own party, the People's Party (PP). Population growth, increasing pressure on agricultural lands, corruption, and the scourge of HIV/AIDS pose major problems for Malawi.
IndependenceBack to top ↑
6 July 1964 (from the UK)
National holidayBack to top ↑
Independence Day (Republic Day), 6 July (1964)
Foundations · Chapter 02
Geography
🇲🇼 Malawi’s territory, resources and strategic position
Location and areaBack to top ↑
Southern Africa, east of Zambia, west and north of Mozambique
13 30 S, 34 00 E
Africa
slightly smaller than Pennsylvania
0 km (landlocked)
none (landlocked)
Terrain and resourcesBack to top ↑
narrow elongated plateau with rolling plains, rounded hills, some mountains
limestone, arable land, hydropower, unexploited deposits of uranium, coal, and bauxite
735 sq km (2006)
Settlement and hazardsBack to top ↑
NA
landlocked; Lake Nyasa, some 580 km long, is the country's most prominent physical feature; it contains more fish species than any other lake on earth
OtherBack to top ↑
17.28 cu km (2011)
deforestation; land degradation; water pollution from agricultural runoff, sewage, industrial wastes; siltation of spawning grounds endangers fish populations
Foundations · Chapter 03
Environment
🇲🇼 Malawi’s environmental conditions, resources and national resilience
ClimateBack to top ↑
sub-tropical; rainy season (November to May); dry season (May to November)
Emissions and pollutionBack to top ↑
Water, waste and foodBack to top ↑
Resources and agreementsBack to top ↑
GINC Capability Domains · Chapter 04
Critical Technology
🇲🇼 Malawi’s technology frontiers and the pursuit of national advantage
Two counts are set side by side for 2015–2024: on the left, the papers researchers in Malawi published; on the right, the patent families that began there and were filed in more than one country. First by capability group, then group by group with each group’s capabilities. The badge on a card is the nation’s place among all nations. Papers are from GINC Research Analytics, patent families from GINC Patents.
Research by capability group
#118 WorldPapers published, 2015–2024
Patents by capability group
#124 WorldInternational patent families, 2015–2024
Advanced Materials & ManufacturingBack to top ↑
Research
#139 WorldPapers published, 2015–2024
Patents
International patent families, 2015–2024
No international patent families on record for 2015–2024.
Energy TechnologiesBack to top ↑
Research
#127 WorldPapers published, 2015–2024
Patents
International patent families, 2015–2024
No international patent families on record for 2015–2024.
Semiconductors & Advanced ComputingBack to top ↑
Research
#128 WorldPapers published, 2015–2024
No research topic: Semiconductor Design & EDA · Advanced Semiconductor Fabrication · Semiconductor Equipment & Materials · Advanced Packaging & Heterogeneous Integration
Patents
International patent families, 2015–2024
No international patent families on record for 2015–2024.
Artificial IntelligenceBack to top ↑
Research
#134 WorldPapers published, 2015–2024
Patents
International patent families, 2015–2024
No international patent families on record for 2015–2024.
Quantum TechnologiesBack to top ↑
Research
#134 WorldPapers published, 2015–2024
Patents
International patent families, 2015–2024
No international patent families on record for 2015–2024.
Connectivity, Cyber & Trust TechnologiesBack to top ↑
Research
#135 WorldPapers published, 2015–2024
Patents
#93 WorldInternational patent families, 2015–2024
Sensing, Timing & NavigationBack to top ↑
Research
#116 WorldPapers published, 2015–2024
Patents
International patent families, 2015–2024
No international patent families on record for 2015–2024.
Robotics & Autonomous SystemsBack to top ↑
Research
#143 WorldPapers published, 2015–2024
No research topic: Human-Machine Interfaces
Patents
International patent families, 2015–2024
No international patent families on record for 2015–2024.
Biotechnology & Health TechnologiesBack to top ↑
Research
#77 WorldPapers published, 2015–2024
Patents
International patent families, 2015–2024
No international patent families on record for 2015–2024.
Medicine and BioTech
Clinical research and life-science invention, drawn from the same series that drive the metric pages. Each card opens the full cross-country comparison.
Space TechnologiesBack to top ↑
- Space Launch & Reusable Systems
- Advanced Propulsion & Hypersonic Systems
- Satellite & Constellation Technologies
GINC Capability Domains · Chapter 05
Strategic Infrastructure
🇲🇼 Malawi’s energy, connectivity and the material foundations of capability
Resource InfrastructureBack to top ↑
200 bbl/day (2012 est.)
0 bbl/day (2010 est.)
0 bbl/day (2010 est.)
0 bbl (1 January 2013 est.)
0 bbl/day (2010 est.)
12,060 bbl/day (2011 est.)
0 bbl/day (2010 est.)
6,059 bbl/day (2010 est.)
0 cu m (2011 est.)
0 cu m (2010 est.)
0 cu m (2011 est.)
0 cu m (2011 est.)
0 cu m (1 January 2013 est.)
Agriculture & Food InfrastructureBack to top ↑
- Irrigation & Agricultural Water
- Livestock & Veterinary
- Fisheries & Aquaculture
- Storage, Cold Chain & Markets
Energy InfrastructureBack to top ↑
- Thermal Generation
- Nuclear Generation
- Nuclear Fuel Cycle & Radioactive Waste
- Hydropower
- Renewable Generation
- Transmission & Distribution
- System Control & Dispatch
- Storage & Fuel Supply
287,000 kW (2010 est.)
1.973 billion kWh (2010 est.)
1.835 billion kWh (2010 est.)
0 kWh (2012 est.)
0 kWh (2012 est.)
0.3% of total installed capacity (2010 est.)
0% of total installed capacity (2010 est.)
99.7% of total installed capacity (2010 est.)
0% of total installed capacity (2010 est.)
956,900 Mt (2011 est.)
Water, Sanitation & Waste InfrastructureBack to top ↑
- Dams, Reservoirs & Flood Defence
- Water Supply & Treatment
- Bulk Water Transfer & Desalination
- Wastewater & Sanitation
- Solid Waste & Recycling
Advanced ManufacturingBack to top ↑
- Materials & Inputs
- Chemicals & Hazardous Process Industry
- Production Systems
- Supply Chain & Ecosystem
- Workforce & Innovation
Transport InfrastructureBack to top ↑
- Seaports & Terminals
- Air Infrastructure
- Air Navigation & Traffic Management
- Inland Waterways & Ferries
- Rail Infrastructure
- Roads & Bridges
- Logistics, Multimodal & Border Infrastructure
- Postal & Parcel
32 (2013)
700 km (on Lake Nyasa [Lake Malawi] and Shire River) (2010)
Communications & Digital InfrastructureBack to top ↑
- Subsea Cables & International Gateways
- Core & Backbone Networks
- Mobile & Wireless Networks
- Spectrum & Broadcasting
- Data Centres, Compute & Cloud
- Data Resources
- AI Tools & Applications
227,300 (2012)
4.42 million (2012)
716,400 (2009)
1,099 (2012)
.mw
Financial InfrastructureBack to top ↑
- Currency & Reserves
- Payments & Settlement Systems
- Markets, Exchanges & Depositories
- Banks, Insurers & Systemic Institutions
Social InfrastructureBack to top ↑
- Health Infrastructure
- Public Health & Laboratories
- Medical Supply & Stockpiles
- Education & Skills Infrastructure
- Research & Scientific Facilities
- Housing, Community & Social Services
- Government & Public Administration
- Cultural, Community & Recreational Infrastructure
- Justice & Corrections
- Emergency Services & Civil Protection
- Hydrometeorology & Early Warning
Space, Aerospace & Defence InfrastructureBack to top ↑
GINC Capability Domains · Chapter 06
National Security
🇲🇼 Malawi’s force, intelligence and the defence of the nation
Disputes and terrorismBack to top ↑
dispute with Tanzania over the boundary in Lake Nyasa (Lake Malawi) and the meandering Songwe River; Malawi contends that the entire lake up to the Tanzanian shoreline is its territory, while Tanzania claims the border is in the center of the lake; the conflict was reignited in 2012 when Malawi awarded a license to a British company for oil exploration in the lake
Force Generation & MobilisationBack to top ↑
Malawi Defense Forces (MDF): Army (includes Air Wing, Marine Unit) (2012)
18 years of age for voluntary military service; high school equivalent required for enlisted recruits and college equivalent for officer recruits; initial engagement is 7 years for enlisted personnel and 10 years for officers (2014)
0.93% of GDP (2012)//0.79% of GDP (2011)//0.93% of GDP (2010)
Forces under arms
Active-duty strength on the Correlates of War series, which reaches back to 1816 and so carries a nation’s whole record of mobilisation rather than its present establishment. The card opens the full cross-country comparison.
Intelligence & AssessmentBack to top ↑
- Imagery & Geospatial Intelligence
- Signals & Cyber Intelligence
- Technical & Measurement Intelligence
- Open-Source & Financial Intelligence
- Human Intelligence & Counterintelligence
- All-Source Analysis & Warning
Joint Command, Projection & SustainmentBack to top ↑
- Command, Control & Communications
- Strategic Lift & Mobility
- Expeditionary & Peace Operations
- Operational Sustainment & War Reserves
- Defence Industrial Mobilisation
- CBRN Defence
Land PowerBack to top ↑
- Combined Arms Manoeuvre
- Land Fires
- Battlefield Aviation & Uncrewed Systems
- Special Operations & Irregular Warfare
Maritime PowerBack to top ↑
- Maritime Security & Constabulary
- Sea Denial & Undersea Warfare
- Sea Control
- Amphibious & Expeditionary Operations
Air PowerBack to top ↑
- Air Sovereignty & Policing
- Control of the Air
- Air Strike & Interdiction
- Airborne ISR, Early Warning & Battle Management
Strategic Strike & Missile DefenceBack to top ↑
Space OperationsBack to top ↑
Cyber & Electromagnetic OperationsBack to top ↑
Nuclear DeterrenceBack to top ↑
GINC Capability Domains · Chapter 07
Human Capital
🇲🇼 Malawi’s population, health and the skills that sustain capability
DemographyBack to top ↑
17,377,468
3.33% (2014 est.)
41.8 births/1,000 population (2014 est.)
8.74 deaths/1,000 population (2014 est.)
5.66 children born/woman (2014 est.)
18.9
46.1% (2010)
Migration and urbanisationBack to top ↑
0.25 migrant(s)/1,000 population (2014 est.)
LILONGWE (capital) 772,000 (2011)
Welfare and equityBack to top ↑
53% (2004)
39 (2004)
Early Childhood DevelopmentBack to top ↑
13.8% (2010)
Foundational EducationBack to top ↑
5.4% of GDP (2011)
Advanced EducationBack to top ↑
Technical & Vocational SkillsBack to top ↑
Digital & AI CompetenceBack to top ↑
Generative AI adoption
Modelled share of working-age adults using generative AI, from Microsoft telemetry scaled to each country’s 15–64 population. A measure of how fast a workforce is absorbing the technology rather than of how much of it a nation builds. The card opens the full cross-country comparison.
Lifelong Learning & ReskillingBack to top ↑
Research Talent & Knowledge CreationBack to top ↑
Population HealthBack to top ↑
460 deaths/100,000 live births (2010)
4.3% (2008)
10.8% (2012 est.)
1,129,800 (2012 est.)
45,600 (2012 est.)
Health System CapabilityBack to top ↑
8.4% of GDP (2011)
0.02 physicians/1,000 population (2008)
1.3 beds/1,000 population (2011)
GINC Capability Domains · Chapter 08
Governance and Integrity
🇲🇼 Malawi’s institutions, law and the integrity of the state
State structureBack to top ↑
multiparty democracy
28 districts; Balaka, Blantyre, Chikwawa, Chiradzulu, Chitipa, Dedza, Dowa, Karonga, Kasungu, Likoma, Lilongwe, Machinga, Mangochi, Mchinji, Mulanje, Mwanza, Mzimba, Neno, Ntcheu, Nkhata Bay, Nkhotakota, Nsanje, Ntchisi, Phalombe, Rumphi, Salima, Thyolo, Zomba
previous 1953 (preindependence), 1966; latest drafted January to May 1994, approved 16 May 1994, entered into force 18 May 1995; amended several times, last in 2013 (2013)
18 years of age; universal
Political Institutions & Civic ParticipationBack to top ↑
- Electoral Management & Integrity
- Legislature & Deliberative Institutions
- Citizen Participation & Civic Space
unicameral National Assembly (193 seats; members elected by popular vote to serve five-year terms)
Alliance for Democracy or AFORD [Godfrey SHAWA]//Chipani Cha Fuko or CCP [Davis KATSONGA PHIRI]//Christian Liberation Party or CONU [Sylvester CHABUKA]//Democratic Progressive Party or DPP [Peter MUTHARIKA]//Malawi Congress Party or MCP [Lazarus CHAKWERA]//Malawi Democratic Party or MDP [Kampelo KALUA]//Malawi Forum for Unity and Development or MAFUNDE [George MNESA]//National Rainbow Coalition or NARC [Loveness GONDWE]//National Salvation Front or NASAF [James NYONDO]//Nthanda Congress Party or NCP [Dr. Chakhumbila KHAILA]//New Labour Party or NLP [Friday JUMBE]//New Republican Party [Gwanda CHAKUWAMBA]//People's Party or PP [Joyce BANDA]//People's Progressive Movement or PPM [Mark Katsonga PHIRI]//People's Transformation Movement or PETRA [Kamuzu CHIBAMBO]//Umodzi Party or UP [John CHISI]//United Democratic Front or UDF [Atupele MULUZI]//United Independent Party or UIP [Helen SINGH]
Council for NGOs in Malawi or CONGOMA (human rights, democracy, and development)//Human Rights Consultative Committee or HRCC (human rights)//Malawi Economic Justice Network or MEJN (pro economic growth, development, government accountability)//Malawi Law Society (an umbrella organization of all lawyers in Malawi)//Public Affairs Committee or PAC (promotes democracy, development, peace and unity)
Justice System & Fundamental RightsBack to top ↑
- Judicial Independence & Court Capability
- Access to Justice & Legal Services
- Fundamental Rights Protection
- Human Rights Institutions & Equality Bodies
mixed legal system of English common law and customary law; judicial review of legislative acts in the Supreme Court of Appeal
accepts compulsory ICJ jurisdiction with reservations; accepts ICCt jurisdiction
Internal Security & OrderBack to top ↑
Regulatory Governance & Strategic ControlsBack to top ↑
- Regulatory Quality & Better Regulation
- Regulatory Delivery & Independent Regulators
- Strategic Controls & Economic Security Administration
Government Effectiveness & Public AdministrationBack to top ↑
- Centre of Government & Policy Coordination
- Civil Service & Public Workforce
- Digital Government & Service Delivery
- Legal Identity & Civil Registration
- Statistical & Data Capability
Public Integrity & Anti-CorruptionBack to top ↑
Transparency, Oversight & AccountabilityBack to top ↑
- Right to Information & Open Government
- Independent Oversight & Supreme Audit
- Independent Media & Journalist Safety
National Resilience & Crisis ManagementBack to top ↑
GINC Capability Domains · Chapter 09
Information and Influence
🇲🇼 Malawi’s identity, media and the projection of influence
Identity and cultureBack to top ↑
English (official), Chichewa (common), Chinyanja, Chiyao, Chitumbuka, Chilomwe, Chinkhonde, Chingoni, Chisena, Chitonga, Chinyakyusa, Chilambya
Christian 82.6%, Muslim 13%, other 1.9%, none 2.5% (2008 est.)
Chewa 32.6%, Lomwe 17.6%, Yao 13.5%, Ngoni 11.5%, Tumbuka 8.8%, Nyanja 5.8%, Sena 3.6%, Tonga 2.1%, Ngonde 1%, other 3.5%
three equal horizontal bands of black (top), red, and green with a radiant, rising, red sun centered on the black band; black represents the native peoples, red the blood shed in their struggle for freedom, and green the color of nature; the rising sun represents the hope of freedom for the continent of Africa
Diplomatic Statecraft & Global NetworksBack to top ↑
- Diplomatic Network & Consular Reach
- Multilateral Leadership & Norm Setting
- Agenda-Setting & Convening
- Mediation & Crisis Diplomacy
ACP, AfDB, AU, C, CD, COMESA, FAO, G-77, IAEA, IBRD, ICAO, ICRM, IDA, IFAD, IFC, IFRCS, ILO, IMF, IMO, Interpol, IOC, IPU, ISO (correspondent), ITSO, ITU, ITUC (NGOs), MIGA, MINURSO, MONUSCO, NAM, OPCW, SADC, UN, UNAMID, UNCTAD, UNESCO, UNIDO, UNOCI, UNWTO, UPU, WCO, WFTU (NGOs), WHO, WIPO, WMO, WTO
Alliances & Security CooperationBack to top ↑
Development Cooperation & Global AssistanceBack to top ↑
Culture, Language & Education DiplomacyBack to top ↑
- Cultural & Language Institutes
- Creative Industries & Cultural Export Reach
- Heritage & Cultural Institutions
- Education Diplomacy & Alumni Networks
- Sports & Major Events
Diaspora & Global CommunitiesBack to top ↑
Information Environment & Strategic CommunicationBack to top ↑
- Strategic Communications & Public Diplomacy
- International Media & Broadcasting
- Information Defence & Counter-Interference
radio is the main broadcast medium; privately-owned Zodiac radio has the widest national broadcasting reach, followed by state-run radio; about a dozen private and community radio stations broadcast in cities and towns around the country; the largest TV network is government-owned, but two private TV networks now broadcast in urban areas and more plan to begin broadcasting in 2014; relays of multiple international broadcasters are available (2014)
GINC Capability Domains · Chapter 10
Financial Strength
🇲🇼 Malawi’s fiscal depth, reserves and the capacity to act
Monetary & Currency CapabilityBack to top ↑
- Monetary Policy & Price Stability
- Exchange Rate & External Account Management
- Currency Issuance & Digital Money
26.9% (2013 est.)//21.4% (2012 est.)
Malawian kwachas (MWK) per US dollar -//342.1 (2013 est.)//249.11 (2012 est.)//150.49 (2010 est.)//141.14 (2009)//142.41 (2008)
15% (31 December 2009)//15% (31 December 2008)
29.5% (31 December 2013 est.)//32.4% (31 December 2012 est.)
$585.3 million (31 December 2013 est.)//$457.6 million (31 December 2012 est.)
$1.494 billion (31 December 2013 est.)//$1.153 billion (31 December 2012 est.)
Fiscal Capacity & Public FinanceBack to top ↑
- Revenue Mobilisation & Tax Administration
- Public Expenditure & Budget Management
- Sovereign Debt & Treasury Management
- Public Investment Management
36.6% of GDP (2013 est.)
-1.4% of GDP (2013 est.)
50.8% of GDP (2013 est.)//62.7% of GDP (2012 est.)
1 July - 30 June
Financial System Depth & AccessBack to top ↑
- Banking System Capacity
- Capital Markets Depth & Development
- Long-Term & Institutional Capital
- Financial Inclusion & Household Access
- Development & Policy Finance
$1.243 billion (31 December 2013 est.)//$1.128 billion (31 December 2012 est.)
$753.6 million (31 December 2012 est.)//$1.384 billion (31 December 2011)//$NA (31 December 2010 est.)
8.2% of GDP (2013 est.)//8.2% of GDP (2012 est.)//1.9% of GDP (2011 est.)
Financial Regulation & IntegrityBack to top ↑
- Prudential Regulation & Supervision
- Financial Integrity & Illicit Finance Control
- Market Conduct & Consumer Protection
- Payment & Market Infrastructure Oversight
Financial Stability & Crisis ManagementBack to top ↑
- Macroprudential & Systemic Oversight
- Crisis Management, Resolution & Deposit Insurance
- External Liquidity & Financial Safety Nets
Sovereign Capital & External Financial PowerBack to top ↑
- Official Reserves Management
- Sovereign Wealth & Public Asset Management
- Currency Internationalisation & Reserve Status
- Capital Account & Flow Management
- International Financial Centre Capability
$364.2 million (31 December 2013 est.)//$246 million (31 December 2012 est.)
$1.556 billion (31 December 2013 est.)//$1.354 billion (31 December 2012 est.)
GINC Capability Domains · Chapter 11
Production and Innovation
🇲🇼 Malawi’s output, industry and the engine of prosperity
Economic Output & ProductivityBack to top ↑
Landlocked Malawi ranks among the world's most densely populated and least developed countries. The economy is predominately agricultural with about 80% of the population living in rural areas. Agriculture, which has benefited from fertilizer subsidies since 2006, accounts for one-third of GDP and 90% of export revenues. The performance of the tobacco sector is key to short-term growth as tobacco accounts for more than half of exports. The economy depends on substantial inflows of economic assistance from the IMF, the World Bank, and individual donor nations. In 2006, Malawi was approved for relief under the Heavily Indebted Poor Countries (HIPC) program. In December 2007, the US granted Malawi eligibility status to receive financial support within the Millennium Challenge Corporation (MCC) initiative. The government faces many challenges including developing a market economy, improving educational facilities, facing up to environmental problems, dealing with the rapidly growing problem of HIV/AIDS, and satisfying foreign donors that fiscal discipline is being tightened. Between 2005 and 2009 President BANDA'S government exhibited improved financial discipline under the guidance of Finance Minister Goodall GONDWE and signed a three year IMF Poverty Reduction and Growth Facility (PRGF) worth $56 million. The government announced infrastructure projects that could yield improvements, such as a new oil pipeline for better fuel access, and the potential for a waterway link through Mozambican rivers to the ocean for better transportation options. Since 2009, however, Malawi has experienced some setbacks, including a general shortage of foreign exchange, which has damaged its ability to pay for imports, and fuel shortages that hinder transportation and productivity. Investment has fallen continuously for several years and in 2013 amounted to just 13% of GDP. The government has failed to address barriers to investment such as unreliable power, water shortages, poor telecommunications infrastructure, and the high costs of services. Donors, who provided an average of 36% of government revenue in the past five years, suspended general budget support for Malawi in 2011 due to a negative IMF review and governance issues.
$15.02 billion (2013 est.)//$14.3 billion (2012 est.)//$14.04 billion (2011 est.)
5% (2013 est.)//1.9% (2012 est.)//4.3% (2011 est.)
$900 (2013 est.)//$900 (2012 est.)//$900 (2011 est.)
$3.683 billion (2013 est.)
Labour & EmploymentBack to top ↑
- Employment & Labour Force Participation
- Labour Market Institutions & Wage Setting
- Employment Services & Skills Matching
- Labour Adjustment, Transition & Formalisation
5.747 million (2007 est.)
NA%
Industrial & Sectoral BaseBack to top ↑
- Manufacturing & Advanced Industry
- Foundational & Process Industries
- Agrifood & Primary Production
- Services Economy
tobacco, sugarcane, cotton, tea, corn, potatoes, cassava (manioc, tapioca), sorghum, pulses, groundnuts, Macadamia nuts; cattle, goats
tobacco, tea, sugar, sawmill products, cement, consumer goods
2.8% (2013 est.)
Structural Transformation & ComplexityBack to top ↑
Business Dynamism & EntrepreneurshipBack to top ↑
- Entrepreneurship & Firm Creation
- Risk Capital & Scale-Up Finance
- Firm Growth, Exit & Renewal
- Competition & Market Contestability
Innovation & CommercialisationBack to top ↑
- Business Innovation Capability
- Research Commercialisation & Knowledge Transfer
- Intellectual Property & Intangible Assets
- Innovation Ecosystems & Clusters
Technology Adoption & DiffusionBack to top ↑
GINC Capability Domains · Chapter 12
Trade and Investment
🇲🇼 Malawi’s markets, capital and the terms of global exchange
Overall tradeBack to top ↑
$912M of exports to 126 partners and $3.27B of imports from 156 in 2024, a deficit of $2.36B.
- Exports
- $912M126 partners
- Imports
- $3.27B156 partners
- Balance
- −$2.36Bdeficit
- Total trade
- $4.18B2024
ExportsBack to top ↑
Where its exports go
The largest partners in 2024, with each one's share of the nation's exports.
| Partner | Value | Share | |
|---|---|---|---|
| India | $87.4M | 9.6% | |
| Germany | $86.2M | 9.4% | |
| South Africa | $59.9M | 6.6% | |
| Turkey | $51.0M | 5.6% | |
| Zimbabwe | $48.8M | 5.4% | |
| Poland | $43.5M | 4.8% | |
| United States | $43.4M | 4.8% | |
| Belgium | $34.3M | 3.8% | |
| Egypt | $31.5M | 3.5% | |
| United Arab Emirates | $25.5M | 2.8% | |
| Tanzania | $24.5M | 2.7% | |
| Zambia | $21.3M | 2.3% | |
| China | $20.1M | 2.2% | |
| United Kingdom | $19.9M | 2.2% | |
| Mozambique | $18.3M | 2.0% | |
| Pakistan | $18.1M | 2.0% | |
| South Korea | $18.0M | 2.0% | |
| Portugal | $14.5M | 1.6% | |
| Rwanda | $14.3M | 1.6% | |
| Ukraine | $13.9M | 1.5% |
What it exports
The largest categories in 2024.
| Category | Value | Share | |
|---|---|---|---|
| Tobacco and manufactures tobacco substitutes | $501M | 55% | |
| Edible vegetables and certain roots and tubers | $104M | 11% | |
| Coffee, tea, mate and spices | $70.9M | 7.8% | |
| Residues, wastes of food industry, animal fodder | $47.6M | 5.2% | |
| Oil seed, oleaginous fruits, grain, seed, fruits | $31.4M | 3.4% | |
| Edible fruits, nuts, peel of citrus fruit, melons | $22.5M | 2.5% | |
| Sugars and sugar confectionery | $15.1M | 1.7% | |
| Machinery, nuclear reactors, boilers | $13.8M | 1.5% | |
| Meat and edible meat offal | $13.2M | 1.4% | |
| Vehicles other than railway, tramway | $12.4M | 1.4% | |
| Wood and articles of wood, wood charcoal | $10.5M | 1.2% | |
| Iron and steel | $8.17M | 0.9% | |
| Plastics | $6.20M | 0.7% | |
| Copper | $5.03M | 0.6% | |
| Rubbers | $4.68M | 0.5% |
ImportsBack to top ↑
Where its imports come from
The largest partners in 2024, with each one's share of the nation's imports.
| Partner | Value | Share | |
|---|---|---|---|
| China | $522M | 16% | |
| South Africa | $485M | 15% | |
| Tanzania | $332M | 10% | |
| United Arab Emirates | $279M | 8.5% | |
| India | $273M | 8.4% | |
| Zambia | $122M | 3.7% | |
| Japan | $93.6M | 2.9% | |
| Mozambique | $86.8M | 2.7% | |
| Kuwait | $82.5M | 2.5% | |
| Switzerland | $82.4M | 2.5% | |
| United Kingdom | $81.4M | 2.5% | |
| Malaysia | $75.5M | 2.3% | |
| United States | $61.1M | 1.9% | |
| Netherlands | $55.0M | 1.7% | |
| Kenya | $54.9M | 1.7% | |
| Indonesia | $50.9M | 1.6% | |
| Saudi Arabia | $42.6M | 1.3% | |
| Russia | $42.1M | 1.3% | |
| Germany | $33.8M | 1.0% | |
| Belgium | $33.4M | 1.0% |
What it imports
The largest categories in 2024.
| Category | Value | Share | |
|---|---|---|---|
| Mineral fuels, oils, distillation products | $542M | 17% | |
| Machinery, nuclear reactors, boilers | $271M | 8.3% | |
| Fertilizers | $255M | 7.8% | |
| Vehicles other than railway, tramway | $219M | 6.7% | |
| Electrical, electronic equipment | $184M | 5.6% | |
| Plastics | $177M | 5.4% | |
| Pharmaceutical products | $170M | 5.2% | |
| Other made textile articles, sets, worn clothing | $129M | 4.0% | |
| Printed books, newspapers, pictures | $111M | 3.4% | |
| Animal, vegetable fats and oils, cleavage products | $102M | 3.1% | |
| Soaps, lubricants, waxes, candles, modelling pastes | $101M | 3.1% | |
| Paper and paperboard, articles of pulp, paper and board | $87.2M | 2.7% | |
| Iron and steel | $83.6M | 2.6% | |
| Salt, sulphur, earth, stone, plaster, lime and cement | $61.5M | 1.9% | |
| Articles of iron or steel | $61.2M | 1.9% |
In a list, the bar runs to the largest in that list. The line is each figure’s history from 2000, drawn to its own peak: it shows the shape of the years, and the value shows the size.
External balanceBack to top ↑
-$280.1 million (2013 est.)//-$315.1 million (2012 est.)
Trade Facilitation & LogisticsBack to top ↑
Trade Policy & Market AccessBack to top ↑
- Trade Policy & Negotiation Capability
- Market Access & Agreements Network
- Trade Law & Enforcement
- Standards, Conformity & Quality Infrastructure
Digital & Services TradeBack to top ↑
- Services Trade Capability
- Digital Trade & E-Commerce
- Data Flows & Digital Trade Governance
- Tourism & Visitor Economy
Investment Attraction & ProjectionBack to top ↑
- Investment Attraction & Facilitation
- Investment Absorption & Linkages
- Outward Investment & Global Corporate Presence
$NA
$NA
Export Capability & SophisticationBack to top ↑
$1.427 billion (2013 est.)//$1.224 billion (2012 est.)
Canada 10.6%, Zimbabwe 9.3%, Germany 7.3%, South Africa 6.6%, Russia 6.5%, US 6.1%, China 4.2% (2012)
tobacco 53%, tea, sugar, cotton, coffee, peanuts, wood products, apparel
Global Value Chain PositionBack to top ↑
- Value Chain Participation & Integration
- Value Chain Position & Upgrading
- Regional Integration & Hub Anchoring
Economic Leverage & DependenceBack to top ↑
- Strategic Supply Security
- Concentration Risk & Revenue Stabilisation
- Economic Leverage & Coercion Resistance
$2.42 billion (2013 est.)//$2.151 billion (2012 est.)
South Africa 27%, China 16.6%, India 8.7%, Zambia 8.5%, Tanzania 5.1%, US 4.3% (2012)
food, petroleum products, semi-manufactures, consumer goods, transportation equipment
Malawi · you are in
Historical Context
Foundations
GINC Capability Domains
Find in this brief · Malawi