
Egypt
Egypt is a republic in Africa, home to 87 million people, with its capital at Cairo.
Contents
12 chapters
Foundations
01–03
At a glance
- Area
- 1Mkm²#30 World#12 Africa
- Population
- 86.9M#15 World#3 Africa
- GDP (market)
- $262B
- GDP (PPP)
- $551.4B#27 World#2 Africa
- GDP per capita
- $6.6K#145 World#12 Africa
The whole brief
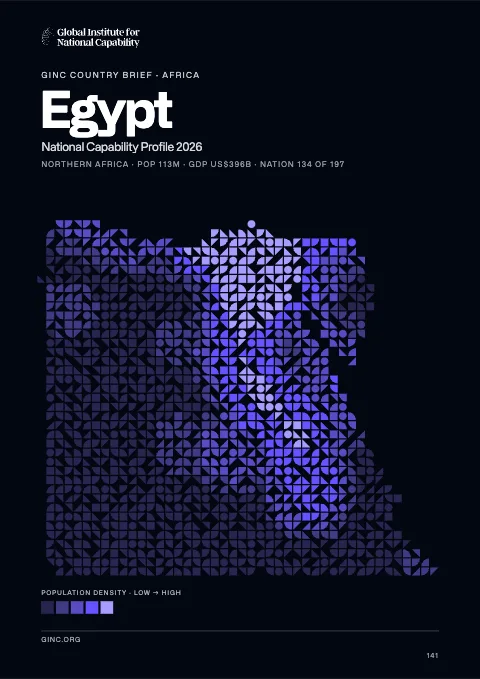
Egypt National Capability Profile 2026
Foundations · Chapter 01
Historical Context
🇪🇬 Egypt’s understanding the origins and evolution of the modern nation
BackgroundBack to top ↑
The regularity and richness of the annual Nile River flood, coupled with semi-isolation provided by deserts to the east and west, allowed for the development of one of the world's great civilizations. A unified kingdom arose circa 3200 B.C., and a series of dynasties ruled in Egypt for the next three millennia. The last native dynasty fell to the Persians in 341 B.C., who in turn were replaced by the Greeks, Romans, and Byzantines. It was the Arabs who introduced Islam and the Arabic language in the 7th century and who ruled for the next six centuries. A local military caste, the Mamluks took control about 1250 and continued to govern after the conquest of Egypt by the Ottoman Turks in 1517. Completion of the Suez Canal in 1869 elevated Egypt as an important world transportation hub. Ostensibly to protect its investments, Britain seized control of Egypt's government in 1882, but nominal allegiance to the Ottoman Empire continued until 1914. Partially independent from the UK in 1922, Egypt acquired full sovereignty from Britain in 1952. The completion of the Aswan High Dam in 1971 and the resultant Lake Nasser have altered the time-honored place of the Nile River in the agriculture and ecology of Egypt. A rapidly growing population (the largest in the Arab world), limited arable land, and dependence on the Nile all continue to overtax resources and stress society. The government has struggled to meet the demands of Egypt's population through economic reform and massive investment in communications and physical infrastructure. Inspired by the 2010 Tunisian revolution, Egyptian opposition groups led demonstrations and labor strikes countrywide, culminating in President Hosni MUBARAK's ouster. Egypt's military assumed national leadership until a new parliament was in place in early 2012; later that same year, Mohammed MORSI won the presidential election. Following often violent protests throughout the spring of 2013 against MORSI's government and the Muslim Brotherhood (MB), and massive anti-government demonstrations, the Egyptian Armed Forces (EAF) intervened and removed MORSI from power in mid-July 2013 and replaced him with interim president Adly MANSOUR. In mid-January 2014, voters approved a new constitution by referendum. Presidential elections to replace MANSOUR are scheduled for late May 2014. According to the constitution and the government's transitional road map, preparations for parliamentary elections will begin by mid-July 2014.
IndependenceBack to top ↑
28 February 1922 (from UK protectorate status; the revolution that began on 23 July 1952 led to a republic being declared on 18 June 1953 and all British troops withdrawn on 18 June 1956); note - it was ca. 3200 B.C. that the Two Lands of Upper (southern) and Lower (northern) Egypt were first united politically
National holidayBack to top ↑
National Day, 23 July (1952)
Foundations · Chapter 02
Geography
🇪🇬 Egypt’s territory, resources and strategic position
Location and areaBack to top ↑
Northern Africa, bordering the Mediterranean Sea, between Libya and the Gaza Strip, and the Red Sea north of Sudan, and includes the Asian Sinai Peninsula
27 00 N, 30 00 E
Africa
more than eight times the size of Ohio; slightly more than three times the size of New Mexico
2,450 km
Terrain and resourcesBack to top ↑
vast desert plateau interrupted by Nile valley and delta
petroleum, natural gas, iron ore, phosphates, manganese, limestone, gypsum, talc, asbestos, lead, rare earth elements, zinc
34,220 sq km (2003)
Settlement and hazardsBack to top ↑
periodic droughts; frequent earthquakes; flash floods; landslides; hot, driving windstorms called khamsin occur in spring; dust storms; sandstorms
controls Sinai Peninsula, only land bridge between Africa and remainder of Eastern Hemisphere; controls Suez Canal, a sea link between Indian Ocean and Mediterranean Sea; size, and juxtaposition to Israel, establish its major role in Middle Eastern geopolitics; dependence on upstream neighbors; dominance of Nile basin issues; prone to influxes of refugees from Sudan and the Palestinian territories
OtherBack to top ↑
57.3 cu km (2011)
agricultural land being lost to urbanization and windblown sands; increasing soil salination below Aswan High Dam; desertification; oil pollution threatening coral reefs, beaches, and marine habitats; other water pollution from agricultural pesticides, raw sewage, and industrial effluents; limited natural freshwater resources away from the Nile, which is the only perennial water source; rapid growth in population overstraining the Nile and natural resources
Foundations · Chapter 03
Environment
🇪🇬 Egypt’s environmental conditions, resources and national resilience
ClimateBack to top ↑
desert; hot, dry summers with moderate winters
Emissions and pollutionBack to top ↑
Water, waste and foodBack to top ↑
Resources and agreementsBack to top ↑
GINC Capability Domains · Chapter 04
Critical Technology
🇪🇬 Egypt’s technology frontiers and the pursuit of national advantage
Two counts are set side by side for 2015–2024: on the left, the papers researchers in Egypt published; on the right, the patent families that began there and were filed in more than one country. First by capability group, then group by group with each group’s capabilities. The badge on a card is the nation’s place among all nations. Papers are from GINC Research Analytics, patent families from GINC Patents.
Research by capability group
#28 WorldPapers published, 2015–2024
4,700
2,419
1,553
1,537
1,303
1,124
644
505
246
30
Patents by capability group
#66 WorldInternational patent families, 2015–2024
Advanced Materials & ManufacturingBack to top ↑
Research
#31 WorldPapers published, 2015–2024
Patents
#64 WorldInternational patent families, 2015–2024
Energy TechnologiesBack to top ↑
Research
#26 WorldPapers published, 2015–2024
Patents
#63 WorldInternational patent families, 2015–2024
Semiconductors & Advanced ComputingBack to top ↑
Research
#36 WorldPapers published, 2015–2024
No research topic: Semiconductor Design & EDA · Advanced Semiconductor Fabrication · Semiconductor Equipment & Materials · Advanced Packaging & Heterogeneous Integration
Patents
#69 WorldInternational patent families, 2015–2024
Artificial IntelligenceBack to top ↑
Research
#25 WorldPapers published, 2015–2024
Patents
#63 WorldInternational patent families, 2015–2024
Quantum TechnologiesBack to top ↑
Research
#28 WorldPapers published, 2015–2024
Patents
International patent families, 2015–2024
No international patent families on record for 2015–2024.
Connectivity, Cyber & Trust TechnologiesBack to top ↑
Research
#26 WorldPapers published, 2015–2024
Patents
#63 WorldInternational patent families, 2015–2024
Sensing, Timing & NavigationBack to top ↑
Research
#29 WorldPapers published, 2015–2024
Patents
#54 WorldInternational patent families, 2015–2024
Robotics & Autonomous SystemsBack to top ↑
Research
#33 WorldPapers published, 2015–2024
No research topic: Human-Machine Interfaces
Patents
#58 WorldInternational patent families, 2015–2024
Biotechnology & Health TechnologiesBack to top ↑
Research
#27 WorldPapers published, 2015–2024
Patents
#57 WorldInternational patent families, 2015–2024
Medicine and BioTech
Clinical research and life-science invention, drawn from the same series that drive the metric pages. Each card opens the full cross-country comparison.
Space TechnologiesBack to top ↑
Research
#30 WorldPapers published, 2015–2024
Patents
#53 WorldInternational patent families, 2015–2024
GINC Capability Domains · Chapter 05
Strategic Infrastructure
🇪🇬 Egypt’s energy, connectivity and the material foundations of capability
Resource InfrastructureBack to top ↑
720,000 bbl/day (2012 est.)
85,000 bbl/day (2010 est.)
48,740 bbl/day (2010 est.)
4.4 billion bbl (1 January 2013 est.)
602,600 bbl/day (2010 est.)
816,300 bbl/day (2011 est.)
90,050 bbl/day (2010 est.)
164,200 bbl/day (2010 est.)
61.26 billion cu m (2011 est.)
46.17 billion cu m (2010 est.)
10.51 billion cu m (2011 est.)
0 cu m (2011 est.)
2.186 trillion cu m (1 January 2013 est.)
condensate 486 km; condensate/gas 74 km; gas 7,986 km; liquid petroleum gas 957 km; oil 5,225 km; oil/gas/water 37 km; refined products 895 km; water 65 km (2013)
Agriculture & Food InfrastructureBack to top ↑
- Irrigation & Agricultural Water
- Livestock & Veterinary
- Fisheries & Aquaculture
- Storage, Cold Chain & Markets
Energy InfrastructureBack to top ↑
- Thermal Generation
- Nuclear Generation
- Nuclear Fuel Cycle & Radioactive Waste
- Hydropower
- Renewable Generation
- Transmission & Distribution
- System Control & Dispatch
- Storage & Fuel Supply
26.91 million kW (2010 est.)
138.7 billion kWh (2011 est.)
122.4 billion kWh (2010 est.)
1.595 billion kWh (2010 est.)
156 million kWh (2010 est.)
87.6% of total installed capacity (2010 est.)
0% of total installed capacity (2010 est.)
10.4% of total installed capacity (2010 est.)
2% of total installed capacity (2010 est.)
201.7 million Mt (2011 est.)
Water, Sanitation & Waste InfrastructureBack to top ↑
- Dams, Reservoirs & Flood Defence
- Water Supply & Treatment
- Bulk Water Transfer & Desalination
- Wastewater & Sanitation
- Solid Waste & Recycling
Advanced ManufacturingBack to top ↑
- Materials & Inputs
- Chemicals & Hazardous Process Industry
- Production Systems
- Supply Chain & Ecosystem
- Workforce & Innovation
Transport InfrastructureBack to top ↑
- Seaports & Terminals
- Air Infrastructure
- Air Navigation & Traffic Management
- Inland Waterways & Ferries
- Rail Infrastructure
- Roads & Bridges
- Logistics, Multimodal & Border Infrastructure
- Postal & Parcel
83 (2013)
7 (2013)
3,500 km (includes the Nile River, Lake Nasser, Alexandria-Cairo Waterway, and numerous smaller canals in Nile Delta; the Suez Canal (193.5 km including approaches) is navigable by oceangoing vessels drawing up to 17.68 m) (2011)
Communications & Digital InfrastructureBack to top ↑
- Subsea Cables & International Gateways
- Core & Backbone Networks
- Mobile & Wireless Networks
- Spectrum & Broadcasting
- Data Centres, Compute & Cloud
- Data Resources
- AI Tools & Applications
8.557 million (2012)
96.8 million (2012)
20.136 million (2009)
200,430 (2012)
.eg
Financial InfrastructureBack to top ↑
- Currency & Reserves
- Payments & Settlement Systems
- Markets, Exchanges & Depositories
- Banks, Insurers & Systemic Institutions
Social InfrastructureBack to top ↑
- Health Infrastructure
- Public Health & Laboratories
- Medical Supply & Stockpiles
- Education & Skills Infrastructure
- Research & Scientific Facilities
- Housing, Community & Social Services
- Government & Public Administration
- Cultural, Community & Recreational Infrastructure
- Justice & Corrections
- Emergency Services & Civil Protection
- Hydrometeorology & Early Warning
Space, Aerospace & Defence InfrastructureBack to top ↑
GINC Capability Domains · Chapter 06
National Security
🇪🇬 Egypt’s force, intelligence and the defence of the nation
Disputes and terrorismBack to top ↑
Sudan claims but Egypt de facto administers security and economic development of Halaib region north of the 22nd parallel boundary; Egypt no longer shows its administration of the Bir Tawil trapezoid in Sudan on its maps; Gazan breaches in the security wall with Egypt in January 2008 highlight difficulties in monitoring the Sinai border; Saudi Arabia claims Egyptian-administered islands of Tiran and Sanafir
Force Generation & MobilisationBack to top ↑
Army, Navy, Egyptian Air Force (Al-Quwwat al-Jawwiya il-Misriya), Egyptian Air Defense Command (2013)
18-30 years of age for male conscript military service; service obligation - 18-36 months, followed by a 9-year reserve obligation; voluntary enlistment possible from age 16 (2012)
1.72% of GDP (2012)//1.86% of GDP (2011)//1.72% of GDP (2010)
Forces under arms
Active-duty strength on the Correlates of War series, which reaches back to 1816 and so carries a nation’s whole record of mobilisation rather than its present establishment. The card opens the full cross-country comparison.
Intelligence & AssessmentBack to top ↑
- Imagery & Geospatial Intelligence
- Signals & Cyber Intelligence
- Technical & Measurement Intelligence
- Open-Source & Financial Intelligence
- Human Intelligence & Counterintelligence
- All-Source Analysis & Warning
Joint Command, Projection & SustainmentBack to top ↑
- Command, Control & Communications
- Strategic Lift & Mobility
- Expeditionary & Peace Operations
- Operational Sustainment & War Reserves
- Defence Industrial Mobilisation
- CBRN Defence
Land PowerBack to top ↑
- Combined Arms Manoeuvre
- Land Fires
- Battlefield Aviation & Uncrewed Systems
- Special Operations & Irregular Warfare
Maritime PowerBack to top ↑
- Maritime Security & Constabulary
- Sea Denial & Undersea Warfare
- Sea Control
- Amphibious & Expeditionary Operations
Air PowerBack to top ↑
- Air Sovereignty & Policing
- Control of the Air
- Air Strike & Interdiction
- Airborne ISR, Early Warning & Battle Management
Strategic Strike & Missile DefenceBack to top ↑
Space OperationsBack to top ↑
Cyber & Electromagnetic OperationsBack to top ↑
Nuclear DeterrenceBack to top ↑
GINC Capability Domains · Chapter 07
Human Capital
🇪🇬 Egypt’s population, health and the skills that sustain capability
DemographyBack to top ↑
86,895,099 (July 2014 est.)
1.84% (2014 est.)
23.35 births/1,000 population (2014 est.)
4.77 deaths/1,000 population (2014 est.)
2.87 children born/woman (2014 est.)
22.9
60.3% (2008)
Migration and urbanisationBack to top ↑
-0.19 migrant(s)/1,000 population (2014 est.)
CAIRO (capital) 11.169 million; Alexandria 4.494 million (2011)
Welfare and equityBack to top ↑
22% (2008 est.)
30.8 (2008)//32.1 (2005)
DisplacementBack to top ↑
Early Childhood DevelopmentBack to top ↑
6.8% (2008)
Foundational EducationBack to top ↑
3.8% of GDP (2008)
Advanced EducationBack to top ↑
Technical & Vocational SkillsBack to top ↑
Digital & AI CompetenceBack to top ↑
Generative AI adoption
Modelled share of working-age adults using generative AI, from Microsoft telemetry scaled to each country’s 15–64 population. A measure of how fast a workforce is absorbing the technology rather than of how much of it a nation builds. The card opens the full cross-country comparison.
Lifelong Learning & ReskillingBack to top ↑
Research Talent & Knowledge CreationBack to top ↑
Population HealthBack to top ↑
66 deaths/100,000 live births (2010)
33.1% (2008)
0.1% (2012 est.)
6,500 (2012 est.)
300 (2012 est.)
Health System CapabilityBack to top ↑
4.9% of GDP (2011)
2.83 physicians/1,000 population (2009)
1.7 beds/1,000 population (2010)
GINC Capability Domains · Chapter 08
Governance and Integrity
🇪🇬 Egypt’s institutions, law and the integrity of the state
State structureBack to top ↑
republic
27 governorates (muhafazat, singular - muhafazat); Ad Daqahliyah, Al Bahr al Ahmar (Red Sea), Al Buhayrah, Al Fayyum, Al Gharbiyah, Al Iskandariyah (Alexandria), Al Isma'iliyah (Ismailia), Al Jizah (Giza), Al Minufiyah, Al Minya, Al Qahirah (Cairo), Al Qalyubiyah, Al Uqsur (Luxor), Al Wadi al Jadid (New Valley), As Suways (Suez), Ash Sharqiyah, Aswan, Asyut, Bani Suwayf, Bur Sa'id (Port Said), Dumyat (Damietta), Janub Sina' (South Sinai), Kafr ash Shaykh, Matruh, Qina, Shamal Sina' (North Sinai), Suhaj
several previous; latest approved by a constitutional committee in December 2013, approved by referenfum held on 14-15 January 2014, ratified by interim president on 19 January 2014 (2014)
18 years of age; universal and compulsory
Political Institutions & Civic ParticipationBack to top ↑
- Electoral Management & Integrity
- Legislature & Deliberative Institutions
- Citizen Participation & Civic Space
Al-Asala [Ehab SHIHA]//Al-Nour [Yunis MAKHYUN]//Al-Wasat Party [Abou Elela MADY]//Al-Watan [Imad Abd al-GHAFUR]//Building and Development Party or BDP [Nasr Abdul-SALAM]//Dustour (Constitution) Party [Hala SHUKRALLAH]//Egyptian Current Party//Egypt of Freedom Party [Amr HAMZAWY]//El Tagamu'u Party [Sayed Abdel AAL]//Freedom and Justice Party [Muhammad Saad al-KATATNI]//Free Egyptians Party [Ahmad SAID]//New Wafd Party [Sayed al-BADADWI]//Reform and Development Party [Muhammad Anwar al-SADAT]//Strong Egypt Party [Abdel Aboul FOTOUH]//The Conference Party [Ambassador Mohamed ORABI]//The Egyptian Social Democratic Party [Mohamed Aboul GHAR]//The Popular Current Party [Hamdeen SABAHI]//The Popular Socialist Alliance Party [Abdel Ghafar SHOUKR]//
NA
Justice System & Fundamental RightsBack to top ↑
- Judicial Independence & Court Capability
- Access to Justice & Legal Services
- Fundamental Rights Protection
- Human Rights Institutions & Equality Bodies
mixed legal system based on Napoleonic civil and penal law, Islamic religious law, and vestiges of colonial-era laws; judicial review of the constitutionality of laws by the Supreme Constitutional Court
accepts compulsory ICJ jurisdiction with reservations; non-party state to the ICCt
Internal Security & OrderBack to top ↑
transit point for cannabis, heroin, and opium moving to Europe, Israel, and North Africa; transit stop for Nigerian drug couriers; concern as money laundering site due to lax enforcement of financial regulations
Regulatory Governance & Strategic ControlsBack to top ↑
- Regulatory Quality & Better Regulation
- Regulatory Delivery & Independent Regulators
- Strategic Controls & Economic Security Administration
Government Effectiveness & Public AdministrationBack to top ↑
- Centre of Government & Policy Coordination
- Civil Service & Public Workforce
- Digital Government & Service Delivery
- Legal Identity & Civil Registration
- Statistical & Data Capability
Public Integrity & Anti-CorruptionBack to top ↑
Transparency, Oversight & AccountabilityBack to top ↑
- Right to Information & Open Government
- Independent Oversight & Supreme Audit
- Independent Media & Journalist Safety
National Resilience & Crisis ManagementBack to top ↑
GINC Capability Domains · Chapter 09
Information and Influence
🇪🇬 Egypt’s identity, media and the projection of influence
Identity and cultureBack to top ↑
Arabic (official), English and French widely understood by educated classes
Muslim (predominantly Sunni) 90%, Christian (majority Coptic Orthodox, other Christians include Armenian Apostolic, Catholic, Maronite, Orthodox, and Anglican) 10% (2012 est.)
Egyptian 99.6%, other 0.4% (2006 census)
golden eagle
three equal horizontal bands of red (top), white, and black; the national emblem (a gold Eagle of Saladin facing the hoist side with a shield superimposed on its chest above a scroll bearing the name of the country in Arabic) centered in the white band; the band colors derive from the Arab Liberation flag and represent oppression (black), overcome through bloody struggle (red), to be replaced by a bright future (white)
Diplomatic Statecraft & Global NetworksBack to top ↑
- Diplomatic Network & Consular Reach
- Multilateral Leadership & Norm Setting
- Agenda-Setting & Convening
- Mediation & Crisis Diplomacy
ABEDA, AfDB, AFESD, AMF, AU, BSEC (observer), CAEU, CD, CICA, COMESA, D-8, EBRD, FAO, G-15, G-24, G-77, IAEA, IBRD, ICAO, ICC (national committees), ICRM, IDA, IDB, IFAD, IFC, IFRCS, IHO, ILO, IMF, IMO, IMSO, Interpol, IOC, IOM, IPU, ISO, ITSO, ITU, LAS, MIGA, MINURSO, MONUSCO, NAM, OAPEC, OAS (observer), OIC, OIF, OSCE (partner), PCA, UN, UNAMID, UNCTAD, UNESCO, UNHCR, UNIDO, UNISFA, UNMIL, UNMISS, UNOCI, UNRWA, UNWTO, UPU, WCO, WFTU (NGOs), WHO, WIPO, WMO, WTO
Alliances & Security CooperationBack to top ↑
Development Cooperation & Global AssistanceBack to top ↑
Culture, Language & Education DiplomacyBack to top ↑
- Cultural & Language Institutes
- Creative Industries & Cultural Export Reach
- Heritage & Cultural Institutions
- Education Diplomacy & Alumni Networks
- Sports & Major Events
Diaspora & Global CommunitiesBack to top ↑
Information Environment & Strategic CommunicationBack to top ↑
- Strategic Communications & Public Diplomacy
- International Media & Broadcasting
- Information Defence & Counter-Interference
mix of state-run and private broadcast media; state-run TV operates 2 national and 6 regional terrestrial networks as well as a few satellite channels; about 20 private satellite channels and a large number of Arabic satellite channels are available via subscription; state-run radio operates about 70 stations belonging to 8 networks; 2 privately owned radio stations operational (2008)
GINC Capability Domains · Chapter 10
Financial Strength
🇪🇬 Egypt’s fiscal depth, reserves and the capacity to act
Monetary & Currency CapabilityBack to top ↑
- Monetary Policy & Price Stability
- Exchange Rate & External Account Management
- Currency Issuance & Digital Money
9% (2013 est.)//7.1% (2012 est.)
Egyptian pounds (EGP) per US dollar -//6.91 (2013 est.)//6.0608 (2012 est.)//5.6219 (2010 est.)//5.545 (2009)//5.4 (2008)
8.75% (5 December 2013 est.)//8.68% (31 December 2010 est.)
11% (31 December 2013 est.)//12% (31 December 2012 est.)
$47.8 billion (31 December 2013 est.)//$45.33 billion (31 December 2012 est.)
$191.2 billion (31 December 2013 est.)//$183.6 billion (31 December 2012 est.)
Fiscal Capacity & Public FinanceBack to top ↑
- Revenue Mobilisation & Tax Administration
- Public Expenditure & Budget Management
- Sovereign Debt & Treasury Management
- Public Investment Management
17.4% of GDP (2013 est.)
-13.3% of GDP (2013 est.)
92.2% of GDP (2013 est.)//88% of GDP (2012 est.)
1 July - 30 June
Financial System Depth & AccessBack to top ↑
- Banking System Capacity
- Capital Markets Depth & Development
- Long-Term & Institutional Capital
- Financial Inclusion & Household Access
- Development & Policy Finance
$163.6 billion (31 December 2013 est.)//$192.5 billion (31 December 2012 est.)
$63.49 billion (23 January 2014 est.)//$58.01 billion (31 December 2012)//$48.68 billion (31 December 2011 est.)
12.3% of GDP (2013 est.)//13.1% of GDP (2012 est.)//13.8% of GDP (2011 est.)
Financial Regulation & IntegrityBack to top ↑
- Prudential Regulation & Supervision
- Financial Integrity & Illicit Finance Control
- Market Conduct & Consumer Protection
- Payment & Market Infrastructure Oversight
Financial Stability & Crisis ManagementBack to top ↑
- Macroprudential & Systemic Oversight
- Crisis Management, Resolution & Deposit Insurance
- External Liquidity & Financial Safety Nets
Sovereign Capital & External Financial PowerBack to top ↑
- Official Reserves Management
- Sovereign Wealth & Public Asset Management
- Currency Internationalisation & Reserve Status
- Capital Account & Flow Management
- International Financial Centre Capability
$17.03 billion (31 December 2013 est.)//$14.93 billion (31 December 2012 est.)
$48.76 billion (31 December 2013 est.)//$38.69 billion (31 December 2012 est.)
GINC Capability Domains · Chapter 11
Production and Innovation
🇪🇬 Egypt’s output, industry and the engine of prosperity
Economic Output & ProductivityBack to top ↑
Occupying the northeast corner of the African continent, Egypt is bisected by the highly fertile Nile valley, where most economic activity takes place. Egypt's economy was highly centralized during the rule of former President Gamal Abdel NASSER but opened up considerably under former Presidents Anwar EL-SADAT and Mohamed Hosni MUBARAK. Cairo from 2004 to 2008 aggressively pursued economic reforms to attract foreign investment and facilitate growth. Poor living conditions combined with limited job opportunities for the average Egyptian contribute to public discontent. After unrest erupted in January 2011, the Egyptian Government backtracked on economic reforms, drastically increasing social spending to address public dissatisfaction, but political uncertainty at the same time caused economic growth to slow significantly, reducing the government's revenues. Tourism, manufacturing, and construction were among the hardest hit sectors of the Egyptian economy, pushing up unemployment levels, and economic growth remains slow amid political uncertainty, government transitions, unrest, and cycles of violence. Cairo since 2011 has drawn down foreign exchange reserves and depended on foreign assistance, particularly from Gulf countries, to finance imports and energy products and prevent further devaluation of the Egyptian pound, fearing higher inflation from a weaker currency.
$551.4 billion (2013 est.)//$541.5 billion (2012 est.)//$529.7 billion (2011 est.)
1.8% (2013 est.)//2.2% (2012 est.)//1.8% (2011 est.)
$6,600 (2013 est.)//$6,600 (2012 est.)//$6,600 (2011 est.)
$262 billion (2013 est.)
Labour & EmploymentBack to top ↑
- Employment & Labour Force Participation
- Labour Market Institutions & Wage Setting
- Employment Services & Skills Matching
- Labour Adjustment, Transition & Formalisation
27.69 million (2013 est.)
13.4% (2013 est.)//12.7% (2012 est.)
Industrial & Sectoral BaseBack to top ↑
- Manufacturing & Advanced Industry
- Foundational & Process Industries
- Agrifood & Primary Production
- Services Economy
cotton, rice, corn, wheat, beans, fruits, vegetables; cattle, water buffalo, sheep, goats
textiles, food processing, tourism, chemicals, pharmaceuticals, hydrocarbons, construction, cement, metals, light manufactures
1.4% (2013 est.)
Structural Transformation & ComplexityBack to top ↑
Business Dynamism & EntrepreneurshipBack to top ↑
- Entrepreneurship & Firm Creation
- Risk Capital & Scale-Up Finance
- Firm Growth, Exit & Renewal
- Competition & Market Contestability
Innovation & CommercialisationBack to top ↑
- Business Innovation Capability
- Research Commercialisation & Knowledge Transfer
- Intellectual Property & Intangible Assets
- Innovation Ecosystems & Clusters
Technology Adoption & DiffusionBack to top ↑
GINC Capability Domains · Chapter 12
Trade and Investment
🇪🇬 Egypt’s markets, capital and the terms of global exchange
Overall tradeBack to top ↑
$54.6B of exports to 185 partners and $98.4B of imports from 184 in 2024, a deficit of $43.8B.
- Exports
- $54.6B185 partners
- Imports
- $98.4B184 partners
- Balance
- −$43.8Bdeficit
- Total trade
- $153B2024
ExportsBack to top ↑
Where its exports go
The largest partners in 2024, with each one's share of the nation's exports.
| Partner | Value | Share | |
|---|---|---|---|
| Saudi Arabia | $7.82B | 14% | |
| Turkey | $4.63B | 8.5% | |
| United Arab Emirates | $3.26B | 6.0% | |
| United States | $2.84B | 5.2% | |
| Italy | $2.59B | 4.7% | |
| Libya | $1.95B | 3.6% | |
| United Kingdom | $1.88B | 3.4% | |
| Spain | $1.71B | 3.1% | |
| Germany | $1.64B | 3.0% | |
| Morocco | $1.36B | 2.5% | |
| France | $1.35B | 2.5% | |
| Greece | $1.31B | 2.4% | |
| Switzerland | $1.30B | 2.4% | |
| Algeria | $995M | 1.8% | |
| Netherlands | $995M | 1.8% | |
| Sudan | $866M | 1.6% | |
| Brazil | $863M | 1.6% | |
| India | $856M | 1.6% | |
| Iraq | $815M | 1.5% | |
| Lebanon | $795M | 1.5% |
What it exports
The largest categories in 2024.
| Category | Value | Share | |
|---|---|---|---|
| Mineral fuels, oils, distillation products | $10.9B | 20% | |
| Pearls, precious stones, metals, coins | $3.40B | 6.2% | |
| Electrical, electronic equipment | $3.19B | 5.8% | |
| Edible fruits, nuts, peel of citrus fruit, melons | $2.97B | 5.4% | |
| Plastics | $2.56B | 4.7% | |
| Iron and steel | $2.51B | 4.6% | |
| Fertilizers | $2.51B | 4.6% | |
| Edible vegetables and certain roots and tubers | $2.21B | 4.0% | |
| Salt, sulphur, earth, stone, plaster, lime and cement | $1.94B | 3.5% | |
| Articles of apparel, knit or crocheted | $1.69B | 3.1% | |
| Articles of apparel, not knit or crocheted | $1.63B | 3.0% | |
| Vegetable, fruit, nut food preparations | $1.22B | 2.2% | |
| Copper | $1.04B | 1.9% | |
| Aluminum | $954M | 1.7% | |
| Machinery, nuclear reactors, boilers | $819M | 1.5% |
ImportsBack to top ↑
Where its imports come from
The largest partners in 2024, with each one's share of the nation's imports.
| Partner | Value | Share | |
|---|---|---|---|
| China | $16.3B | 17% | |
| Saudi Arabia | $8.20B | 8.3% | |
| United States | $7.52B | 7.6% | |
| Russia | $6.01B | 6.1% | |
| Brazil | $4.08B | 4.1% | |
| Germany | $4.08B | 4.1% | |
| Turkey | $4.06B | 4.1% | |
| India | $3.33B | 3.4% | |
| Italy | $3.14B | 3.2% | |
| Israel | $2.94B | 3.0% | |
| United Arab Emirates | $2.69B | 2.7% | |
| Ukraine | $2.37B | 2.4% | |
| France | $2.36B | 2.4% | |
| United Kingdom | $2.14B | 2.2% | |
| Indonesia | $1.75B | 1.8% | |
| Spain | $1.73B | 1.8% | |
| South Korea | $1.50B | 1.5% | |
| Netherlands | $1.50B | 1.5% | |
| Belgium | $1.41B | 1.4% | |
| Sweden | $1.31B | 1.3% |
What it imports
The largest categories in 2024.
| Category | Value | Share | |
|---|---|---|---|
| Mineral fuels, oils, distillation products | $17.9B | 18% | |
| Machinery, nuclear reactors, boilers | $7.86B | 8.0% | |
| Cereals | $7.15B | 7.3% | |
| Electrical, electronic equipment | $6.19B | 6.3% | |
| Iron and steel | $5.49B | 5.6% | |
| Vehicles other than railway, tramway | $5.00B | 5.1% | |
| Plastics | $4.78B | 4.9% | |
| Pharmaceutical products | $3.50B | 3.6% | |
| Organic chemicals | $2.92B | 3.0% | |
| Copper | $2.35B | 2.4% | |
| Animal, vegetable fats and oils, cleavage products | $2.32B | 2.4% | |
| Oil seed, oleaginous fruits, grain, seed, fruits | $2.05B | 2.1% | |
| Articles of iron or steel | $1.95B | 2.0% | |
| Optical, photo, technical, medical apparatus | $1.61B | 1.6% | |
| Paper and paperboard, articles of pulp, paper and board | $1.47B | 1.5% |
In a list, the bar runs to the largest in that list. The line is each figure’s history from 2000, drawn to its own peak: it shows the shape of the years, and the value shows the size.
External balanceBack to top ↑
-$6.035 billion (2013 est.)//-$9.136 billion (2012 est.)
Trade Facilitation & LogisticsBack to top ↑
Trade Policy & Market AccessBack to top ↑
- Trade Policy & Negotiation Capability
- Market Access & Agreements Network
- Trade Law & Enforcement
- Standards, Conformity & Quality Infrastructure
Digital & Services TradeBack to top ↑
- Services Trade Capability
- Digital Trade & E-Commerce
- Data Flows & Digital Trade Governance
- Tourism & Visitor Economy
Investment Attraction & ProjectionBack to top ↑
- Investment Attraction & Facilitation
- Investment Absorption & Linkages
- Outward Investment & Global Corporate Presence
$76.76 billion (31 December 2013 est.)//$75.41 billion (31 December 2012 est.)
$6.475 billion (31 December 2013 est.)//$6.285 billion (31 December 2012 est.)
Export Capability & SophisticationBack to top ↑
$24.81 billion (2013 est.)//$24.93 billion (2012 est.)
Italy 7.9%, India 6.9%, US 6.8%, Saudi Arabia 6.2%, Turkey 5.3%, Libya 4.9% (2012)
crude oil and petroleum products, cotton, textiles, metal products, chemicals, processed food
Global Value Chain PositionBack to top ↑
- Value Chain Participation & Integration
- Value Chain Position & Upgrading
- Regional Integration & Hub Anchoring
Economic Leverage & DependenceBack to top ↑
- Strategic Supply Security
- Concentration Risk & Revenue Stabilisation
- Economic Leverage & Coercion Resistance
$59.22 billion (2013 est.)//$60.26 billion (2012 est.)
China 9.5%, US 7.6%, Germany 6.7%, Russia 5.3%, Ukraine 5.3%, Turkey 5.1%, Italy 5% (2012)
machinery and equipment, foodstuffs, chemicals, wood products, fuels
Egypt · you are in
Historical Context
Foundations
GINC Capability Domains
Find in this brief · Egypt