
Kenya
Kenya is a republic in Africa, home to 45 million people, with its capital at Nairobi.
Contents
12 chapters
Foundations
01–03
At a glance
- Area
- 580.4Kkm²#49 World#23 Africa
- Population
- 45M#30 World#7 Africa
- GDP (market)
- $45.3B
- GDP (PPP)
- $79.9B#81 World#11 Africa
- GDP per capita
- $1.8K#197 World#31 Africa
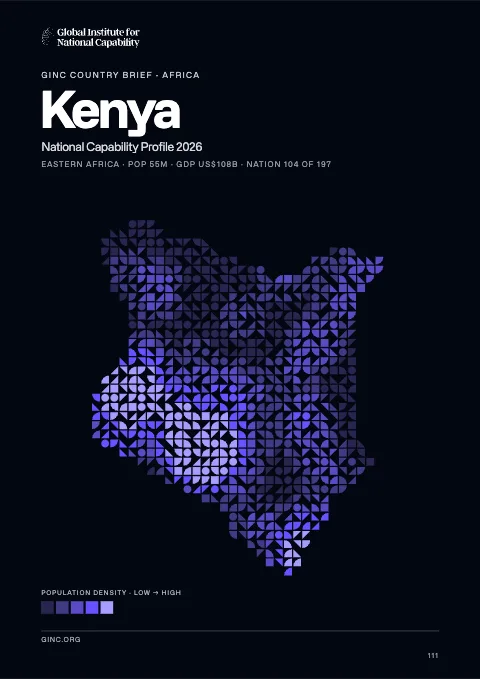
The whole brief
Kenya National Capability Profile 2026
Foundations · Chapter 01
Historical Context
🇰🇪 Kenya’s understanding the origins and evolution of the modern nation
BackgroundBack to top ↑
Founding president and liberation struggle icon Jomo KENYATTA led Kenya from independence in 1963 until his death in 1978, when President Daniel MOI took power in a constitutional succession. The country was a de facto one-party state from 1969 until 1982 when the ruling Kenya African National Union (KANU) made itself the sole legal party in Kenya. MOI acceded to internal and external pressure for political liberalization in late 1991. The ethnically fractured opposition failed to dislodge KANU from power in elections in 1992 and 1997, which were marred by violence and fraud, but were viewed as having generally reflected the will of the Kenyan people. President MOI stepped down in December 2002 following fair and peaceful elections. Mwai KIBAKI, running as the candidate of the multiethnic, united opposition group, the National Rainbow Coalition (NARC), defeated KANU candidate Uhuru KENYATTA and assumed the presidency following a campaign centered on an anticorruption platform. KIBAKI's NARC coalition splintered in 2005 over a constitutional review process. Government defectors joined with KANU to form a new opposition coalition, the Orange Democratic Movement (ODM), which defeated the government's draft constitution in a popular referendum in November 2005. KIBAKI's reelection in December 2007 brought charges of vote rigging from ODM candidate Raila ODINGA and unleashed two months of violence in which as many as 1,500 people died. African Union-sponsored mediation led by former UN Secretary General Kofi ANNAN in late February 2008 resulted in a power-sharing accord bringing ODINGA into the government in the restored position of prime minister. The power sharing accord included a broad reform agenda, the centerpiece of which was constitutional reform. In August 2010, Kenyans overwhelmingly adopted a new constitution in a national referendum. The new constitution introduced additional checks and balances to executive power and significant devolution of power and resources to 47 newly created counties. It also eliminated the position of prime minister following the first presidential election under the new constitution, which occurred on 4 March 2013. Uhuru KENYATTA, the son of founding president Jomo KENYATTA, won the March elections in the first round by a close margin and was sworn into office on 9 April 2013.
IndependenceBack to top ↑
12 December 1963 (from the UK)
National holidayBack to top ↑
Independence Day, 12 December (1963); Madaraka Day, 1 June (1963); Mashujaa Day, 20 October (2010)
Foundations · Chapter 02
Geography
🇰🇪 Kenya’s territory, resources and strategic position
Location and areaBack to top ↑
Eastern Africa, bordering the Indian Ocean, between Somalia and Tanzania
1 00 N, 38 00 E
Africa
five times the size of Ohio; slightly more than twice the size of Nevada
536 km
Terrain and resourcesBack to top ↑
low plains rise to central highlands bisected by Great Rift Valley; fertile plateau in west
limestone, soda ash, salt, gemstones, fluorspar, zinc, diatomite, gypsum, wildlife, hydropower
1,032 sq km (2003)
Settlement and hazardsBack to top ↑
recurring drought; flooding during rainy seasons
the Kenyan Highlands comprise one of the most successful agricultural production regions in Africa; glaciers are found on Mount Kenya, Africa's second highest peak; unique physiography supports abundant and varied wildlife of scientific and economic value
OtherBack to top ↑
30.7 cu km (2011)
water pollution from urban and industrial wastes; degradation of water quality from increased use of pesticides and fertilizers; water hyacinth infestation in Lake Victoria; deforestation; soil erosion; desertification; poaching
Foundations · Chapter 03
Environment
🇰🇪 Kenya’s environmental conditions, resources and national resilience
ClimateBack to top ↑
varies from tropical along coast to arid in interior
Emissions and pollutionBack to top ↑
Water, waste and foodBack to top ↑
Resources and agreementsBack to top ↑
GINC Capability Domains · Chapter 04
Critical Technology
🇰🇪 Kenya’s technology frontiers and the pursuit of national advantage
Two counts are set side by side for 2015–2024: on the left, the papers researchers in Kenya published; on the right, the patent families that began there and were filed in more than one country. First by capability group, then group by group with each group’s capabilities. The badge on a card is the nation’s place among all nations. Papers are from GINC Research Analytics, patent families from GINC Patents.
Research by capability group
#79 WorldPapers published, 2015–2024
712
332
85
69
68
49
39
8
5
0
Patents by capability group
#95 WorldInternational patent families, 2015–2024
Advanced Materials & ManufacturingBack to top ↑
Research
#93 WorldPapers published, 2015–2024
Patents
International patent families, 2015–2024
No international patent families on record for 2015–2024.
Energy TechnologiesBack to top ↑
Research
#86 WorldPapers published, 2015–2024
Patents
International patent families, 2015–2024
No international patent families on record for 2015–2024.
Semiconductors & Advanced ComputingBack to top ↑
Research
#101 WorldPapers published, 2015–2024
No research topic: Semiconductor Design & EDA · Advanced Semiconductor Fabrication · Semiconductor Equipment & Materials · Advanced Packaging & Heterogeneous Integration
Patents
International patent families, 2015–2024
No international patent families on record for 2015–2024.
Artificial IntelligenceBack to top ↑
Research
#83 WorldPapers published, 2015–2024
Patents
#89 WorldInternational patent families, 2015–2024
Quantum TechnologiesBack to top ↑
Research
#109 WorldPapers published, 2015–2024
Patents
International patent families, 2015–2024
No international patent families on record for 2015–2024.
Connectivity, Cyber & Trust TechnologiesBack to top ↑
Research
#88 WorldPapers published, 2015–2024
Patents
#73 WorldInternational patent families, 2015–2024
Sensing, Timing & NavigationBack to top ↑
Research
#79 WorldPapers published, 2015–2024
Patents
International patent families, 2015–2024
No international patent families on record for 2015–2024.
Robotics & Autonomous SystemsBack to top ↑
Research
#87 WorldPapers published, 2015–2024
No research topic: Human-Machine Interfaces
Patents
#85 WorldInternational patent families, 2015–2024
Biotechnology & Health TechnologiesBack to top ↑
Research
#45 WorldPapers published, 2015–2024
Patents
#94 WorldInternational patent families, 2015–2024
Medicine and BioTech
Clinical research and life-science invention, drawn from the same series that drive the metric pages. Each card opens the full cross-country comparison.
Space TechnologiesBack to top ↑
- Space Launch & Reusable Systems
- Advanced Propulsion & Hypersonic Systems
- Satellite & Constellation Technologies
GINC Capability Domains · Chapter 05
Strategic Infrastructure
🇰🇪 Kenya’s energy, connectivity and the material foundations of capability
Resource InfrastructureBack to top ↑
0 bbl/day (2011 est.)
0 bbl/day (2010 est.)
31,040 bbl/day (2010 est.)
0 bbl (1 January 2013 est.)
32,240 bbl/day (2010 est.)
79,410 bbl/day (2011 est.)
1,266 bbl/day (2010 est.)
52,160 bbl/day (2010 est.)
0 cu m (2011 est.)
0 cu m (2010 est.)
0 cu m (2011 est.)
0 cu m (2011 est.)
0 cu m (1 January 2013 est.)
oil 4 km; refined products 928 km (2013)
Agriculture & Food InfrastructureBack to top ↑
- Irrigation & Agricultural Water
- Livestock & Veterinary
- Fisheries & Aquaculture
- Storage, Cold Chain & Markets
Energy InfrastructureBack to top ↑
- Thermal Generation
- Nuclear Generation
- Nuclear Fuel Cycle & Radioactive Waste
- Hydropower
- Renewable Generation
- Transmission & Distribution
- System Control & Dispatch
- Storage & Fuel Supply
1.698 million kW (2010 est.)
7.33 billion kWh (2010 est.)
6.15 billion kWh (2010 est.)
31 million kWh (2010 est.)
31 million kWh (2010 est.)
41.9% of total installed capacity (2010 est.)
0% of total installed capacity (2010 est.)
44.8% of total installed capacity (2010 est.)
13.3% of total installed capacity (2010 est.)
12.62 million Mt (2011 est.)
Water, Sanitation & Waste InfrastructureBack to top ↑
- Dams, Reservoirs & Flood Defence
- Water Supply & Treatment
- Bulk Water Transfer & Desalination
- Wastewater & Sanitation
- Solid Waste & Recycling
Advanced ManufacturingBack to top ↑
- Materials & Inputs
- Chemicals & Hazardous Process Industry
- Production Systems
- Supply Chain & Ecosystem
- Workforce & Innovation
Transport InfrastructureBack to top ↑
- Seaports & Terminals
- Air Infrastructure
- Air Navigation & Traffic Management
- Inland Waterways & Ferries
- Rail Infrastructure
- Roads & Bridges
- Logistics, Multimodal & Border Infrastructure
- Postal & Parcel
197 (2013)
none specifically, the only significant inland waterway in the country is the part of Lake Victoria within the boundaries of Kenya; Kisumu is the main port and has ferry connections to Uganda and Tanzania (2011)
Communications & Digital InfrastructureBack to top ↑
- Subsea Cables & International Gateways
- Core & Backbone Networks
- Mobile & Wireless Networks
- Spectrum & Broadcasting
- Data Centres, Compute & Cloud
- Data Resources
- AI Tools & Applications
251,600 (2012)
30.732 million (2012)
3.996 million (2009)
71,018 (2012)
.ke
Financial InfrastructureBack to top ↑
- Currency & Reserves
- Payments & Settlement Systems
- Markets, Exchanges & Depositories
- Banks, Insurers & Systemic Institutions
Social InfrastructureBack to top ↑
- Health Infrastructure
- Public Health & Laboratories
- Medical Supply & Stockpiles
- Education & Skills Infrastructure
- Research & Scientific Facilities
- Housing, Community & Social Services
- Government & Public Administration
- Cultural, Community & Recreational Infrastructure
- Justice & Corrections
- Emergency Services & Civil Protection
- Hydrometeorology & Early Warning
Space, Aerospace & Defence InfrastructureBack to top ↑
GINC Capability Domains · Chapter 06
National Security
🇰🇪 Kenya’s force, intelligence and the defence of the nation
Disputes and terrorismBack to top ↑
Kenya served as an important mediator in brokering Sudan's north-south separation in February 2005; Kenya provides shelter to an estimated 550 million refugees, including Ugandans who flee across the border periodically to seek protection from Lord's Resistance Army rebels; Kenya works hard to prevent the clan and militia fighting in Somalia from spreading across the border, which has long been open to nomadic pastoralists; the boundary that separates Kenya's and Sudan's sovereignty is unclear in the "Ilemi Triangle," which Kenya has administered since colonial times
Force Generation & MobilisationBack to top ↑
Kenya Defence Forces: Kenya Army, Kenya Air Force, Kenya Navy (2012)
18-26 years of age for male and female voluntary service (under 18 with parental consent), with a 9-year obligation (7 years for Kenyan Navy); applicants must be Kenyan citizens and provide a national identity card (obtained at age 18) and a school-leaving certificate; women serve under the same terms and conditions as men; mandatory retirement at age 55 (2012)
1.96% of GDP (2012)//1.88% of GDP (2011)//1.96% of GDP (2010)
Forces under arms
Active-duty strength on the Correlates of War series, which reaches back to 1816 and so carries a nation’s whole record of mobilisation rather than its present establishment. The card opens the full cross-country comparison.
Intelligence & AssessmentBack to top ↑
- Imagery & Geospatial Intelligence
- Signals & Cyber Intelligence
- Technical & Measurement Intelligence
- Open-Source & Financial Intelligence
- Human Intelligence & Counterintelligence
- All-Source Analysis & Warning
Joint Command, Projection & SustainmentBack to top ↑
- Command, Control & Communications
- Strategic Lift & Mobility
- Expeditionary & Peace Operations
- Operational Sustainment & War Reserves
- Defence Industrial Mobilisation
- CBRN Defence
Land PowerBack to top ↑
- Combined Arms Manoeuvre
- Land Fires
- Battlefield Aviation & Uncrewed Systems
- Special Operations & Irregular Warfare
Maritime PowerBack to top ↑
- Maritime Security & Constabulary
- Sea Denial & Undersea Warfare
- Sea Control
- Amphibious & Expeditionary Operations
Air PowerBack to top ↑
- Air Sovereignty & Policing
- Control of the Air
- Air Strike & Interdiction
- Airborne ISR, Early Warning & Battle Management
Strategic Strike & Missile DefenceBack to top ↑
Space OperationsBack to top ↑
Cyber & Electromagnetic OperationsBack to top ↑
Nuclear DeterrenceBack to top ↑
GINC Capability Domains · Chapter 07
Human Capital
🇰🇪 Kenya’s population, health and the skills that sustain capability
DemographyBack to top ↑
45,010,056
2.11% (2014 est.)
28.27 births/1,000 population (2014 est.)
7 deaths/1,000 population (2014 est.)
3.54 children born/woman (2014 est.)
19.8
45.5% (2008/09)
Migration and urbanisationBack to top ↑
-0.22 migrant(s)/1,000 population (2014 est.)
NAIROBI (capital) 3.363 million; Mombassa 972,000 (2011)
Welfare and equityBack to top ↑
43.4% (2012 est.)
42.5 (2008 est.)//44.9 (1997)
DisplacementBack to top ↑
Early Childhood DevelopmentBack to top ↑
16.4% (2009)
Foundational EducationBack to top ↑
6.7% of GDP (2010)
Advanced EducationBack to top ↑
Technical & Vocational SkillsBack to top ↑
Digital & AI CompetenceBack to top ↑
Generative AI adoption
Modelled share of working-age adults using generative AI, from Microsoft telemetry scaled to each country’s 15–64 population. A measure of how fast a workforce is absorbing the technology rather than of how much of it a nation builds. The card opens the full cross-country comparison.
Lifelong Learning & ReskillingBack to top ↑
Research Talent & Knowledge CreationBack to top ↑
Population HealthBack to top ↑
360 deaths/100,000 live births (2010)
4.2% (2008)
6.1% (2012 est.)
1.646 million (2012 est.)
57,500 (2012 est.)
Health System CapabilityBack to top ↑
4.5% of GDP (2011)
0.18 physicians/1,000 population (2011)
1.4 beds/1,000 population (2010)
GINC Capability Domains · Chapter 08
Governance and Integrity
🇰🇪 Kenya’s institutions, law and the integrity of the state
State structureBack to top ↑
republic
47 counties; Baringo, Bomet, Bungoma, Busia, Elgeyo/Marakwet, Embu, Garissa, Homa Bay, Isiolo, Kajiado, Kakamega, Kericho, Kiambu, Kilifi, Kirinyaga, Kisii, Kisumu, Kitui, Kwale, Laikipia, Lamu, Machakos, Makueni, Mandera, Marsabit, Meru, Migori, Mombasa, Murang'a, Nairobi City, Nakuru, Nandi, Narok, Nyamira, Nyandarua, Nyeri, Samburu, Siaya, Taita/Taveta, Tana River, Tharaka-Nithi, Trans Nzoia, Turkana, Uasin Gishu, Vihiga, Wajir, West Pokot
previous 1963, 1969; latest drafted 6 May 2010, passed by referendum 4 August 2010, promulgated 27 August 2010 (2013)
18 years of age; universal
Political Institutions & Civic ParticipationBack to top ↑
- Electoral Management & Integrity
- Legislature & Deliberative Institutions
- Citizen Participation & Civic Space
bicameral parliament consists of a Senate (67 seats of which 47 are elected and 20 are appointed) and a National Assembly (349 seats of which 290 are elected and 59 are appointed); members to serve five-year terms
Federal Party of Kenya or FPK [Cyrus JIRONGO]//Kenya African National Union or KANU [Gideon MOI]//The National Party Alliance or TNA [Uhuru KENYATTA]//National Rainbow Coalition-Kenya or NARC-Kenya [Martha KARUA]//Orange Democratic Movement of Kenya or ODM [Raila ODINGA]//United Democratic Forum Party or UDF [Musalia MUDAVADI]//United Republican Party or URP [William RUTO]//Wiper Democratic Movement or WDM (formerly Orange Democratic Movement or ODM-K) [Kalonzo MUSYOKA]
Council of Islamic Preachers of Kenya or CIPK [Sheikh Idris MOHAMMED]//Kenya Human Rights Commission [L. Muthoni WANYEKI]//Muslim Human Rights Forum [Ali-Amin KIMATHI]//National Muslim Leaders Forum or NAMLEF [Abdullahi ABDI]//Protestant National Council of Churches of Kenya or NCCK [Canon Peter Karanja MWANGI]//Roman Catholic and other Christian churches//Supreme Council of Kenya Muslims or SUPKEM [Shaykh Abdul Gafur al-BUSAIDY]//
Justice System & Fundamental RightsBack to top ↑
- Judicial Independence & Court Capability
- Access to Justice & Legal Services
- Fundamental Rights Protection
- Human Rights Institutions & Equality Bodies
mixed legal system of English common law, Islamic law, and customary law; judicial review in a new Supreme Court established pursuant to the new constitution
accepts compulsory ICJ jurisdiction with reservations; accepts ICCt jurisdiction
Internal Security & OrderBack to top ↑
widespread harvesting of small plots of marijuana; transit country for South Asian heroin destined for Europe and North America; Indian methaqualone also transits on way to South Africa; significant potential for money-laundering activity given the country's status as a regional financial center; massive corruption, and relatively high levels of narcotics-associated activities
Regulatory Governance & Strategic ControlsBack to top ↑
- Regulatory Quality & Better Regulation
- Regulatory Delivery & Independent Regulators
- Strategic Controls & Economic Security Administration
Government Effectiveness & Public AdministrationBack to top ↑
- Centre of Government & Policy Coordination
- Civil Service & Public Workforce
- Digital Government & Service Delivery
- Legal Identity & Civil Registration
- Statistical & Data Capability
Public Integrity & Anti-CorruptionBack to top ↑
Transparency, Oversight & AccountabilityBack to top ↑
- Right to Information & Open Government
- Independent Oversight & Supreme Audit
- Independent Media & Journalist Safety
National Resilience & Crisis ManagementBack to top ↑
GINC Capability Domains · Chapter 09
Information and Influence
🇰🇪 Kenya’s identity, media and the projection of influence
Identity and cultureBack to top ↑
English (official), Kiswahili (official), numerous indigenous languages
Christian 82.5% (Protestant 47.4%, Catholic 23.3%, other 11.8%), Muslim 11.1%, Traditionalists 1.6%, other 1.7%, none 2.4%, unspecified 0.7% (2009 census)
Kikuyu 22%, Luhya 14%, Luo 13%, Kalenjin 12%, Kamba 11%, Kisii 6%, Meru 6%, other African 15%, non-African (Asian, European, and Arab) 1%
lion
three equal horizontal bands of black (top), red, and green; the red band is edged in white; a large Maasai warrior's shield covering crossed spears is superimposed at the center; black symbolizes the majority population, red the blood shed in the struggle for freedom, green stands for natural wealth, and white for peace; the shield and crossed spears symbolize the defense of freedom
Diplomatic Statecraft & Global NetworksBack to top ↑
- Diplomatic Network & Consular Reach
- Multilateral Leadership & Norm Setting
- Agenda-Setting & Convening
- Mediation & Crisis Diplomacy
ACP, AfDB, AU, C, CD, COMESA, EAC, EADB, FAO, G-15, G-77, IAEA, IBRD, ICAO, ICC (national committees), ICRM, IDA, IFAD, IFC, IFRCS, IGAD, ILO, IMF, IMO, IMSO, Interpol, IOC, IOM, IPU, ISO, ITSO, ITU, ITUC (NGOs), MIGA, MINUSMA, MONUSCO, NAM, OPCW, PCA, UN, UNAMID, UNCTAD, UNESCO, UNHCR, UNIDO, UNIFIL, UNMISS, UNWTO, UPU, WCO, WHO, WIPO, WMO, WTO
Alliances & Security CooperationBack to top ↑
Development Cooperation & Global AssistanceBack to top ↑
Culture, Language & Education DiplomacyBack to top ↑
- Cultural & Language Institutes
- Creative Industries & Cultural Export Reach
- Heritage & Cultural Institutions
- Education Diplomacy & Alumni Networks
- Sports & Major Events
Diaspora & Global CommunitiesBack to top ↑
Information Environment & Strategic CommunicationBack to top ↑
- Strategic Communications & Public Diplomacy
- International Media & Broadcasting
- Information Defence & Counter-Interference
about a half-dozen large-scale privately owned media companies with TV and radio stations as well as a state-owned TV broadcaster provide service nation-wide; satellite and cable TV subscription services available; state-owned radio broadcaster operates 2 national radio channels and provides regional and local radio services in multiple languages; a large number of private radio stations broadcast on a national level along with over 100 private and non-profit provincial stations broadcasting in local languages; transmissions of several international broadcasters available (2014)
GINC Capability Domains · Chapter 10
Financial Strength
🇰🇪 Kenya’s fiscal depth, reserves and the capacity to act
Monetary & Currency CapabilityBack to top ↑
- Monetary Policy & Price Stability
- Exchange Rate & External Account Management
- Currency Issuance & Digital Money
5.8% (2013 est.)//9.4% (2012 est.)
Kenyan shillings (KES) per US dollar -//86.73 (2013 est.)//84.53 (2012 est.)//79.233 (2010 est.)//77.352 (2009)//68.358 (2008)
7% (31 December 2010 est.)//NA% (31 December 2009 est.)
17.1% (31 December 2013 est.)//NA% (31 December 2012 est.)
$9.198 billion (31 December 2013 est.)//$8.264 billion (31 December 2012 est.)
$19.37 billion (31 December 2013 est.)//$17.08 billion (31 December 2012 est.)
Fiscal Capacity & Public FinanceBack to top ↑
- Revenue Mobilisation & Tax Administration
- Public Expenditure & Budget Management
- Sovereign Debt & Treasury Management
- Public Investment Management
17.4% of GDP (2013 est.)
-4.1% of GDP (2013 est.)
53.5% of GDP (2013 est.)//52.5% of GDP (2012 est.)
1 July - 30 June
Financial System Depth & AccessBack to top ↑
- Banking System Capacity
- Capital Markets Depth & Development
- Long-Term & Institutional Capital
- Financial Inclusion & Household Access
- Development & Policy Finance
$23.1 billion (31 December 2013 est.)//$20.93 billion (31 December 2012 est.)
$14.79 billion (31 December 2012 est.)//$NA (31 December 2011)//$14.46 billion (31 December 2010 est.)
10.6% of GDP (2013 est.)//9.5% of GDP (2012 est.)//10.8% of GDP (2011 est.)
Financial Regulation & IntegrityBack to top ↑
- Prudential Regulation & Supervision
- Financial Integrity & Illicit Finance Control
- Market Conduct & Consumer Protection
- Payment & Market Infrastructure Oversight
Financial Stability & Crisis ManagementBack to top ↑
- Macroprudential & Systemic Oversight
- Crisis Management, Resolution & Deposit Insurance
- External Liquidity & Financial Safety Nets
Sovereign Capital & External Financial PowerBack to top ↑
- Official Reserves Management
- Sovereign Wealth & Public Asset Management
- Currency Internationalisation & Reserve Status
- Capital Account & Flow Management
- International Financial Centre Capability
$5.541 billion (31 December 2013 est.)//$5.712 billion (31 December 2012 est.)
$11.96 billion (31 December 2013 est.)//$11.06 billion (31 December 2012 est.)
GINC Capability Domains · Chapter 11
Production and Innovation
🇰🇪 Kenya’s output, industry and the engine of prosperity
Economic Output & ProductivityBack to top ↑
Kenya hKenya has been hampered by corruption and by reliance upon several primary goods whose prices have remained low. Low infrastructure investment threatens Kenya's long-term position as the largest East African economy, although the Kenyatta administration has prioritized infrastructure development. International financial lenders and donors remain important to Kenya's economic growth and development. Unemployment is high at around 40%. The country has chronic budget deficits. Inflationary pressures and sharp currency depreciation peaked in early 2012 but have since abated following low global food and fuel prices and monetary interventions by the Central Bank. Recent terrorism in Kenya and the surrounding region threatens Kenya's important tourism industry. Kenya, in conjunction with neighboring Ethiopia and South Sudan, intends to begin construction on a transport corridor and oil pipeline into the port of Lamu in 2014.
$79.9 billion (2013 est.)//$76.03 billion (2012 est.)//$72.71 billion (2011 est.)
5.1% (2013 est.)//4.6% (2012 est.)//4.4% (2011 est.)
$1,800 (2013 est.)//$1,700 (2013 est.)//$1,700 (2011 est.)
$45.31 billion (2013 est.)
Labour & EmploymentBack to top ↑
- Employment & Labour Force Participation
- Labour Market Institutions & Wage Setting
- Employment Services & Skills Matching
- Labour Adjustment, Transition & Formalisation
19.67 million (2013 est.)
40% (2008 est.)//40% (2001 est.)
Industrial & Sectoral BaseBack to top ↑
- Manufacturing & Advanced Industry
- Foundational & Process Industries
- Agrifood & Primary Production
- Services Economy
tea, coffee, corn, wheat, sugarcane, fruit, vegetables; dairy products, beef, fish, pork, poultry, eggs
small-scale consumer goods (plastic, furniture, batteries, textiles, clothing, soap, cigarettes, flour), agricultural products, horticulture, oil refining; aluminum, steel, lead; cement, commercial ship repair, tourism
5.1% (2013 est.)
Structural Transformation & ComplexityBack to top ↑
Business Dynamism & EntrepreneurshipBack to top ↑
- Entrepreneurship & Firm Creation
- Risk Capital & Scale-Up Finance
- Firm Growth, Exit & Renewal
- Competition & Market Contestability
Innovation & CommercialisationBack to top ↑
- Business Innovation Capability
- Research Commercialisation & Knowledge Transfer
- Intellectual Property & Intangible Assets
- Innovation Ecosystems & Clusters
Technology Adoption & DiffusionBack to top ↑
GINC Capability Domains · Chapter 12
Trade and Investment
🇰🇪 Kenya’s markets, capital and the terms of global exchange
Overall tradeBack to top ↑
$8.81B of exports to 186 partners and $22.2B of imports from 186 in 2024, a deficit of $13.4B.
- Exports
- $8.81B186 partners
- Imports
- $22.2B186 partners
- Balance
- −$13.4Bdeficit
- Total trade
- $31.0B2024
ExportsBack to top ↑
Where its exports go
The largest partners in 2024, with each one's share of the nation's exports.
| Partner | Value | Share | |
|---|---|---|---|
| Uganda | $860M | 9.8% | |
| United States | $834M | 9.5% | |
| United Arab Emirates | $754M | 8.6% | |
| Netherlands | $642M | 7.3% | |
| Pakistan | $552M | 6.3% | |
| United Kingdom | $534M | 6.1% | |
| Tanzania | $434M | 4.9% | |
| Rwanda | $315M | 3.6% | |
| DR Congo | $236M | 2.7% | |
| Egypt | $232M | 2.6% | |
| Saudi Arabia | $229M | 2.6% | |
| South Sudan | $220M | 2.5% | |
| Germany | $211M | 2.4% | |
| China | $211M | 2.4% | |
| India | $172M | 1.9% | |
| Somalia | $130M | 1.5% | |
| France | $114M | 1.3% | |
| Ethiopia | $112M | 1.3% | |
| Spain | $91.3M | 1.0% | |
| Switzerland | $86.3M | 1.0% |
What it exports
The largest categories in 2024.
| Category | Value | Share | |
|---|---|---|---|
| Coffee, tea, mate and spices | $1.77B | 20% | |
| Live trees, plants, bulbs, roots, cut flowers | $967M | 11% | |
| Mineral fuels, oils, distillation products | $832M | 9.4% | |
| Edible fruits, nuts, peel of citrus fruit, melons | $432M | 4.9% | |
| Articles of apparel, knit or crocheted | $336M | 3.8% | |
| Edible vegetables and certain roots and tubers | $323M | 3.7% | |
| Articles of apparel, not knit or crocheted | $291M | 3.3% | |
| Animal, vegetable fats and oils, cleavage products | $263M | 3.0% | |
| Salt, sulphur, earth, stone, plaster, lime and cement | $204M | 2.3% | |
| Iron and steel | $190M | 2.2% | |
| Pharmaceutical products | $161M | 1.8% | |
| Ores slag and ash | $161M | 1.8% | |
| Soaps, lubricants, waxes, candles, modelling pastes | $159M | 1.8% | |
| Plastics | $158M | 1.8% | |
| Meat and edible meat offal | $157M | 1.8% |
ImportsBack to top ↑
Where its imports come from
The largest partners in 2024, with each one's share of the nation's imports.
| Partner | Value | Share | |
|---|---|---|---|
| China | $5.57B | 25% | |
| United Arab Emirates | $2.52B | 11% | |
| India | $2.07B | 9.3% | |
| United States | $1.15B | 5.2% | |
| Malaysia | $1.01B | 4.5% | |
| Japan | $800M | 3.6% | |
| Russia | $590M | 2.7% | |
| South Africa | $568M | 2.6% | |
| Oman | $532M | 2.4% | |
| Kuwait | $485M | 2.2% | |
| Tanzania | $441M | 2.0% | |
| Uganda | $440M | 2.0% | |
| Saudi Arabia | $398M | 1.8% | |
| United Kingdom | $392M | 1.8% | |
| Netherlands | $382M | 1.7% | |
| Germany | $340M | 1.5% | |
| Egypt | $334M | 1.5% | |
| Pakistan | $331M | 1.5% | |
| Belgium | $307M | 1.4% | |
| Turkey | $268M | 1.2% |
What it imports
The largest categories in 2024.
| Category | Value | Share | |
|---|---|---|---|
| Mineral fuels, oils, distillation products | $4.78B | 22% | |
| Machinery, nuclear reactors, boilers | $1.86B | 8.4% | |
| Vehicles other than railway, tramway | $1.39B | 6.3% | |
| Electrical, electronic equipment | $1.29B | 5.8% | |
| Cereals | $1.22B | 5.5% | |
| Plastics | $1.11B | 5.0% | |
| Animal, vegetable fats and oils, cleavage products | $1.00B | 4.5% | |
| Iron and steel | $786M | 3.5% | |
| Pharmaceutical products | $734M | 3.3% | |
| Paper and paperboard, articles of pulp, paper and board | $473M | 2.1% | |
| Fertilizers | $410M | 1.8% | |
| Aircraft, spacecraft | $368M | 1.7% | |
| Miscellaneous chemical products | $327M | 1.5% | |
| Optical, photo, technical, medical apparatus | $326M | 1.5% | |
| Articles of iron or steel | $318M | 1.4% |
In a list, the bar runs to the largest in that list. The line is each figure’s history from 2000, drawn to its own peak: it shows the shape of the years, and the value shows the size.
External balanceBack to top ↑
-$4.495 billion (2013 est.)//-$4.31 billion (2012 est.)
Trade Facilitation & LogisticsBack to top ↑
Trade Policy & Market AccessBack to top ↑
- Trade Policy & Negotiation Capability
- Market Access & Agreements Network
- Trade Law & Enforcement
- Standards, Conformity & Quality Infrastructure
Digital & Services TradeBack to top ↑
- Services Trade Capability
- Digital Trade & E-Commerce
- Data Flows & Digital Trade Governance
- Tourism & Visitor Economy
Investment Attraction & ProjectionBack to top ↑
- Investment Attraction & Facilitation
- Investment Absorption & Linkages
- Outward Investment & Global Corporate Presence
$3.273 billion (31 December 2013 est.)//$2.877 billion (31 December 2012 est.)
$335.4 million (31 December 2013 est.)//$315.4 million (31 December 2012 est.)
Export Capability & SophisticationBack to top ↑
$6.58 billion (2013 est.)//$6.228 billion (2012 est.)
Uganda 10.3%, Tanzania 10%, Netherlands 7.7%, UK 7.2%, US 6.3%, Egypt 4.8%, Democratic Republic of the Congo 4.4% (2012)
tea, horticultural products, coffee, petroleum products, fish, cement
Global Value Chain PositionBack to top ↑
- Value Chain Participation & Integration
- Value Chain Position & Upgrading
- Regional Integration & Hub Anchoring
Economic Leverage & DependenceBack to top ↑
- Strategic Supply Security
- Concentration Risk & Revenue Stabilisation
- Economic Leverage & Coercion Resistance
$15.86 billion (2013 est.)//$15.1 billion (2011 est.)
India 20.9%, China 15.4%, UAE 9.8%, Saudi Arabia 6.9% (2012)
machinery and transportation equipment, petroleum products, motor vehicles, iron and steel, resins and plastics
Kenya · you are in
Historical Context
Foundations
GINC Capability Domains
Find in this brief · Kenya