
Bahrain
Bahrain is a constitutional monarchy in the Middle East, home to 1.3 million people, with its capital at Manama.
Contents
12 chapters
Foundations
01–03
At a glance
- Area
- 760km²#186 World#18 Middle East
- Population
- 1.3M#156 World#19 Middle East
- GDP (market)
- $28.4B
- GDP (PPP)
- $35B#109 World#15 Middle East
- GDP per capita
- $29.8K#48 World#6 Middle East
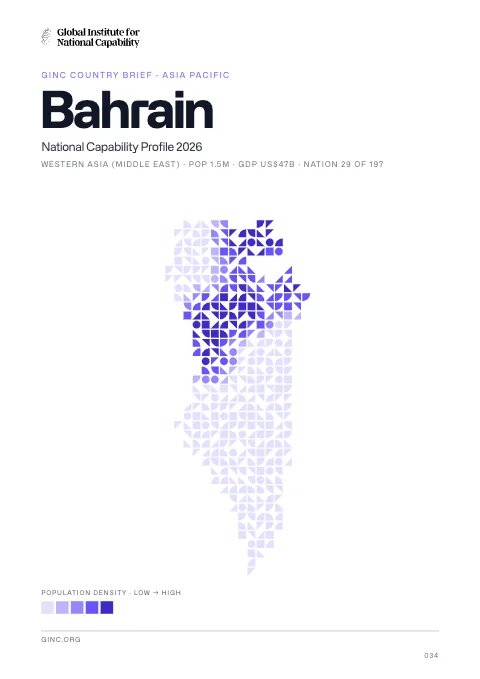
The whole brief
Bahrain National Capability Profile 2026
Foundations · Chapter 01
Historical Context
🇧🇭 Bahrain’s understanding the origins and evolution of the modern nation
BackgroundBack to top ↑
In 1783, the Sunni Al-Khalifa family took power in Bahrain. In order to secure these holdings, it entered into a series of treaties with the UK during the 19th century that made Bahrain a British protectorate. The archipelago attained its independence in 1971. Facing declining oil reserves, Bahrain has turned to petroleum processing and refining and has become an international banking center. Bahrain's small size and central location among Gulf countries require it to play a delicate balancing act in foreign affairs among its larger neighbors. The Sunni-led government has struggled to manage relations with its large Shia-majority population. In early 2011, amid Arab uprisings elsewhere in the region, the Bahraini Government confronted similar protests at home with police and military action, including deploying Gulf Cooperation Council security forces to Bahrain. Sporadic clashes between demonstrators and security forces continue in Bahrain. Ongoing dissatisfaction with the political status quo has led to a broader discussion termed the Bahrain National Dialogue, a process that convenes members of the executive, parliament, and political societies in an attempt to reach a political agreement.
IndependenceBack to top ↑
15 August 1971 (from the UK)
National holidayBack to top ↑
National Day, 16 December (1971); note - 15 August 1971 was the date of independence from the UK, 16 December 1971 was the date of independence from British protection
Foundations · Chapter 02
Geography
🇧🇭 Bahrain’s territory, resources and strategic position
Location and areaBack to top ↑
Middle East, archipelago in the Persian Gulf, east of Saudi Arabia
26 00 N, 50 33 E
Middle East
3.5 times the size of Washington, DC
0 km
161 km
Terrain and resourcesBack to top ↑
mostly low desert plain rising gently to low central escarpment
oil, associated and nonassociated natural gas, fish, pearls
40.15 sq km (2003)
Settlement and hazardsBack to top ↑
periodic droughts; dust storms
close to primary Middle Eastern petroleum sources; strategic location in Persian Gulf, through which much of the Western world's petroleum must transit to reach open ocean
OtherBack to top ↑
0.12 cu km (2011)
desertification resulting from the degradation of limited arable land, periods of drought, and dust storms; coastal degradation (damage to coastlines, coral reefs, and sea vegetation) resulting from oil spills and other discharges from large tankers, oil refineries, and distribution stations; lack of freshwater resources (groundwater and seawater are the only sources for all water needs)
Foundations · Chapter 03
Environment
🇧🇭 Bahrain’s environmental conditions, resources and national resilience
ClimateBack to top ↑
arid; mild, pleasant winters; very hot, humid summers
Emissions and pollutionBack to top ↑
Water, waste and foodBack to top ↑
Resources and agreementsBack to top ↑
GINC Capability Domains · Chapter 04
Critical Technology
🇧🇭 Bahrain’s technology frontiers and the pursuit of national advantage
Two counts are set side by side for 2015–2024: on the left, the papers researchers in Bahrain published; on the right, the patent families that began there and were filed in more than one country. First by capability group, then group by group with each group’s capabilities. The badge on a card is the nation’s place among all nations. Papers are from GINC Research Analytics, patent families from GINC Patents.
Research by capability group
#88 WorldPapers published, 2015–2024
403
92
64
62
57
45
44
12
10
0
Patents by capability group
#106 WorldInternational patent families, 2015–2024
Advanced Materials & ManufacturingBack to top ↑
Research
#100 WorldPapers published, 2015–2024
Patents
#85 WorldInternational patent families, 2015–2024
Energy TechnologiesBack to top ↑
Research
#96 WorldPapers published, 2015–2024
Patents
#98 WorldInternational patent families, 2015–2024
Semiconductors & Advanced ComputingBack to top ↑
Research
#97 WorldPapers published, 2015–2024
No research topic: Semiconductor Design & EDA · Advanced Semiconductor Fabrication · Semiconductor Equipment & Materials · Advanced Packaging & Heterogeneous Integration
Patents
International patent families, 2015–2024
No international patent families on record for 2015–2024.
Artificial IntelligenceBack to top ↑
Research
#79 WorldPapers published, 2015–2024
Patents
#89 WorldInternational patent families, 2015–2024
Quantum TechnologiesBack to top ↑
Research
#66 WorldPapers published, 2015–2024
Patents
International patent families, 2015–2024
No international patent families on record for 2015–2024.
Connectivity, Cyber & Trust TechnologiesBack to top ↑
Research
#83 WorldPapers published, 2015–2024
Patents
International patent families, 2015–2024
No international patent families on record for 2015–2024.
Sensing, Timing & NavigationBack to top ↑
Research
#107 WorldPapers published, 2015–2024
Patents
International patent families, 2015–2024
No international patent families on record for 2015–2024.
Robotics & Autonomous SystemsBack to top ↑
Research
#94 WorldPapers published, 2015–2024
No research topic: Human-Machine Interfaces
Patents
International patent families, 2015–2024
No international patent families on record for 2015–2024.
Biotechnology & Health TechnologiesBack to top ↑
Research
#114 WorldPapers published, 2015–2024
Patents
#84 WorldInternational patent families, 2015–2024
Medicine and BioTech
Clinical research and life-science invention, drawn from the same series that drive the metric pages. Each card opens the full cross-country comparison.
Space TechnologiesBack to top ↑
- Space Launch & Reusable Systems
- Advanced Propulsion & Hypersonic Systems
- Satellite & Constellation Technologies
GINC Capability Domains · Chapter 05
Strategic Infrastructure
🇧🇭 Bahrain’s energy, connectivity and the material foundations of capability
Resource InfrastructureBack to top ↑
49,160 bbl/day (2012 est.)
152,600 bbl/day (2012 est.)
256,000 bbl/day (2011 est.)
124.6 million bbl (1 January 2013 est.)
270,800 bbl/day (2012 est.)
51,450 bbl/day (2012 est.)
226,000 bbl/day (2012 est.)
0 bbl/day (2012 est.)
12.62 billion cu m (2011 est.)
12.77 billion cu m (2010 est.)
0 cu m (2011 est.)
0 cu m (2011 est.)
92.03 billion cu m (1 January 2013 est.)
gas 20 km; oil 54 km (2013)
Agriculture & Food InfrastructureBack to top ↑
- Irrigation & Agricultural Water
- Livestock & Veterinary
- Fisheries & Aquaculture
- Storage, Cold Chain & Markets
Energy InfrastructureBack to top ↑
- Thermal Generation
- Nuclear Generation
- Nuclear Fuel Cycle & Radioactive Waste
- Hydropower
- Renewable Generation
- Transmission & Distribution
- System Control & Dispatch
- Storage & Fuel Supply
3.169 million kW (2010 est.)
13.16 billion kWh (2011 est.)
12.97 billion kWh (2011 est.)
0 kWh (2012 est.)
214 million kWh (2011 est.)
100% of total installed capacity (2011 est.)
0% of total installed capacity (2011 est.)
0% of total installed capacity (2011 est.)
0% of total installed capacity (2011 est.)
29.7 million Mt (2011 est.)
Water, Sanitation & Waste InfrastructureBack to top ↑
- Dams, Reservoirs & Flood Defence
- Water Supply & Treatment
- Bulk Water Transfer & Desalination
- Wastewater & Sanitation
- Solid Waste & Recycling
Advanced ManufacturingBack to top ↑
- Materials & Inputs
- Chemicals & Hazardous Process Industry
- Production Systems
- Supply Chain & Ecosystem
- Workforce & Innovation
Transport InfrastructureBack to top ↑
- Seaports & Terminals
- Air Infrastructure
- Air Navigation & Traffic Management
- Inland Waterways & Ferries
- Rail Infrastructure
- Roads & Bridges
- Logistics, Multimodal & Border Infrastructure
- Postal & Parcel
4 (2013)
1 (2013)
Communications & Digital InfrastructureBack to top ↑
- Subsea Cables & International Gateways
- Core & Backbone Networks
- Mobile & Wireless Networks
- Spectrum & Broadcasting
- Data Centres, Compute & Cloud
- Data Resources
- AI Tools & Applications
290,000 (2012)
2.125 million (2012)
419,500 (2009)
47,727 (2012)
.bh
Financial InfrastructureBack to top ↑
- Currency & Reserves
- Payments & Settlement Systems
- Markets, Exchanges & Depositories
- Banks, Insurers & Systemic Institutions
Social InfrastructureBack to top ↑
- Health Infrastructure
- Public Health & Laboratories
- Medical Supply & Stockpiles
- Education & Skills Infrastructure
- Research & Scientific Facilities
- Housing, Community & Social Services
- Government & Public Administration
- Cultural, Community & Recreational Infrastructure
- Justice & Corrections
- Emergency Services & Civil Protection
- Hydrometeorology & Early Warning
Space, Aerospace & Defence InfrastructureBack to top ↑
GINC Capability Domains · Chapter 06
National Security
🇧🇭 Bahrain’s force, intelligence and the defence of the nation
Disputes and terrorismBack to top ↑
none
Force Generation & MobilisationBack to top ↑
Bahrain Defense Force (BDF): Royal Bahraini Army (RBA), Royal Bahraini Navy (RBN), Royal Bahraini Air Force (RBAF), Royal Bahraini Air Defense Force (RBADF) (2013)
18 years of age for voluntary military service; 15 years of age for NCOs, technicians, and cadets; no conscription (2012)
3.14% of GDP (2012)//3.02% of GDP (2011)//3.14% of GDP (2010)
Forces under arms
Active-duty strength on the Correlates of War series, which reaches back to 1816 and so carries a nation’s whole record of mobilisation rather than its present establishment. The card opens the full cross-country comparison.
Intelligence & AssessmentBack to top ↑
- Imagery & Geospatial Intelligence
- Signals & Cyber Intelligence
- Technical & Measurement Intelligence
- Open-Source & Financial Intelligence
- Human Intelligence & Counterintelligence
- All-Source Analysis & Warning
Joint Command, Projection & SustainmentBack to top ↑
- Command, Control & Communications
- Strategic Lift & Mobility
- Expeditionary & Peace Operations
- Operational Sustainment & War Reserves
- Defence Industrial Mobilisation
- CBRN Defence
Land PowerBack to top ↑
- Combined Arms Manoeuvre
- Land Fires
- Battlefield Aviation & Uncrewed Systems
- Special Operations & Irregular Warfare
Maritime PowerBack to top ↑
- Maritime Security & Constabulary
- Sea Denial & Undersea Warfare
- Sea Control
- Amphibious & Expeditionary Operations
Air PowerBack to top ↑
- Air Sovereignty & Policing
- Control of the Air
- Air Strike & Interdiction
- Airborne ISR, Early Warning & Battle Management
Strategic Strike & Missile DefenceBack to top ↑
Space OperationsBack to top ↑
Cyber & Electromagnetic OperationsBack to top ↑
Nuclear DeterrenceBack to top ↑
GINC Capability Domains · Chapter 07
Human Capital
🇧🇭 Bahrain’s population, health and the skills that sustain capability
DemographyBack to top ↑
1,314,089
2.49% (2014 est.)
13.92 births/1,000 population (2014 est.)
2.67 deaths/1,000 population (2014 est.)
1.81 children born/woman (2014 est.)
Migration and urbanisationBack to top ↑
13.6 migrant(s)/1,000 population (2014 est.)
MANAMA (capital) 262,000 (2011)
Welfare and equityBack to top ↑
NA%
Early Childhood DevelopmentBack to top ↑
Foundational EducationBack to top ↑
2.6% of GDP (2012)
Advanced EducationBack to top ↑
Technical & Vocational SkillsBack to top ↑
Digital & AI CompetenceBack to top ↑
Lifelong Learning & ReskillingBack to top ↑
Research Talent & Knowledge CreationBack to top ↑
Population HealthBack to top ↑
20 deaths/100,000 live births (2010)
32.9% (2008)
0.2% (2001 est.)
fewer than 600 (2007 est.)
fewer than 200 (2003 est.)
Health System CapabilityBack to top ↑
3.8% of GDP (2011)
1.49 physicians/1,000 population (2010)
1.8 beds/1,000 population (2009)
GINC Capability Domains · Chapter 08
Governance and Integrity
🇧🇭 Bahrain’s institutions, law and the integrity of the state
State structureBack to top ↑
constitutional monarchy
5 governorates (muhafazat, singular - muhafazah); Asamah (Capital), Janubiyah (Southern), Muharraq, Shamaliyah (Northern), Wasat (Central)
adopted 14 February 2002; amended 2012 (2012)
20 years of age; universal; note - Bahraini Cabinet in May 2011 endorsed a draft law lowering eligibility to 18 years
Political Institutions & Civic ParticipationBack to top ↑
- Electoral Management & Integrity
- Legislature & Deliberative Institutions
- Citizen Participation & Civic Space
bicameral National Assembly consists of the Shura Council or Consultative Council (40 members appointed by the King) and the Council of Representatives or Chamber of Deputies (40 seats; members directly elected to serve four-year terms)
Justice System & Fundamental RightsBack to top ↑
- Judicial Independence & Court Capability
- Access to Justice & Legal Services
- Fundamental Rights Protection
- Human Rights Institutions & Equality Bodies
mixed legal system of Islamic law, English common law, Egyptian civil, criminal, and commercial codes; customary law
has not submitted an ICJ jurisdiction declaration; non-party state to the ICCt
Internal Security & OrderBack to top ↑
Regulatory Governance & Strategic ControlsBack to top ↑
- Regulatory Quality & Better Regulation
- Regulatory Delivery & Independent Regulators
- Strategic Controls & Economic Security Administration
Government Effectiveness & Public AdministrationBack to top ↑
- Centre of Government & Policy Coordination
- Civil Service & Public Workforce
- Digital Government & Service Delivery
- Legal Identity & Civil Registration
- Statistical & Data Capability
Public Integrity & Anti-CorruptionBack to top ↑
Transparency, Oversight & AccountabilityBack to top ↑
- Right to Information & Open Government
- Independent Oversight & Supreme Audit
- Independent Media & Journalist Safety
National Resilience & Crisis ManagementBack to top ↑
GINC Capability Domains · Chapter 09
Information and Influence
🇧🇭 Bahrain’s identity, media and the projection of influence
Identity and cultureBack to top ↑
Arabic (official), English, Farsi, Urdu
Muslim 70.3%, Christian 14.5%, Hindu 9.8%, Buddhist 2.5%, Jewish 0.6%, folk religion
Bahraini 46%, Asian 45.5%, other Arabs 4.7%, African 1.6%, European 1%, other 1.2% (includes Gulf Co-operative country nationals, North and South Americans, and Oceanians) (2010 est.)
red, the traditional color for flags of Persian Gulf states, with a white serrated band (five white points) on the hoist side; the five points represent the five pillars of Islam
Diplomatic Statecraft & Global NetworksBack to top ↑
- Diplomatic Network & Consular Reach
- Multilateral Leadership & Norm Setting
- Agenda-Setting & Convening
- Mediation & Crisis Diplomacy
ABEDA, AFESD, AMF, CAEU, CICA, FAO, G-77, GCC, IAEA, IBRD, ICAO, ICC (national committees), ICRM, IDA, IDB, IFC, IFRCS, IHO, ILO, IMF, IMO, IMSO, Interpol, IOC, IOM (observer), IPU, ISO, ITSO, ITU, ITUC (NGOs), LAS, MIGA, NAM, OAPEC, OIC, OPCW, PCA, UN, UNCTAD, UNESCO, UNIDO, UNWTO, UPU, WCO, WFTU (NGOs), WHO, WIPO, WMO, WTO
Alliances & Security CooperationBack to top ↑
Development Cooperation & Global AssistanceBack to top ↑
Culture, Language & Education DiplomacyBack to top ↑
- Cultural & Language Institutes
- Creative Industries & Cultural Export Reach
- Heritage & Cultural Institutions
- Education Diplomacy & Alumni Networks
- Sports & Major Events
Diaspora & Global CommunitiesBack to top ↑
Information Environment & Strategic CommunicationBack to top ↑
- Strategic Communications & Public Diplomacy
- International Media & Broadcasting
- Information Defence & Counter-Interference
state-run Bahrain Radio and Television Corporation (BRTC) operates 5 terrestrial TV networks and several radio stations; satellite TV systems provide access to international broadcasts; 1 private FM station directs broadcasts to Indian listeners; radio and TV broadcasts from countries in the region are available (2007)
GINC Capability Domains · Chapter 10
Financial Strength
🇧🇭 Bahrain’s fiscal depth, reserves and the capacity to act
Monetary & Currency CapabilityBack to top ↑
- Monetary Policy & Price Stability
- Exchange Rate & External Account Management
- Currency Issuance & Digital Money
3.1% (2013 est.)//2.8% (2012 est.)
Bahraini dinars (BHD) per US dollar -//0.376 (2013 est.)//0.376 (2012 est.)//0.376 (2010 est.)//0.376 (2009)//0.376 (2008)
6.8% (31 December 2013 est.)//6.05% (31 December 2012 est.)
$7.431 billion (31 December 2013 est.)//$6.944 billion (31 December 2012 est.)
$23.93 billion (31 December 2013 est.)//$22.51 billion (31 December 2012 est.)
Fiscal Capacity & Public FinanceBack to top ↑
- Revenue Mobilisation & Tax Administration
- Public Expenditure & Budget Management
- Sovereign Debt & Treasury Management
- Public Investment Management
28.7% of GDP (2013 est.)
-3.8% of GDP (2013 est.)
61.2% of GDP (2013 est.)//54.2% of GDP (2012 est.)
calendar year
Financial System Depth & AccessBack to top ↑
- Banking System Capacity
- Capital Markets Depth & Development
- Long-Term & Institutional Capital
- Financial Inclusion & Household Access
- Development & Policy Finance
$25.96 billion (31 December 2013 est.)//$22.19 billion (31 December 2012 est.)
$16.06 billion (31 December 2012 est.)//$17.15 billion (31 December 2011)//$20.43 billion (31 December 2010 est.)
27.6% of GDP (2013 est.)//27.6% of GDP (2012 est.)//27.5% of GDP (2011 est.)
Financial Regulation & IntegrityBack to top ↑
- Prudential Regulation & Supervision
- Financial Integrity & Illicit Finance Control
- Market Conduct & Consumer Protection
- Payment & Market Infrastructure Oversight
Financial Stability & Crisis ManagementBack to top ↑
- Macroprudential & Systemic Oversight
- Crisis Management, Resolution & Deposit Insurance
- External Liquidity & Financial Safety Nets
Sovereign Capital & External Financial PowerBack to top ↑
- Official Reserves Management
- Sovereign Wealth & Public Asset Management
- Currency Internationalisation & Reserve Status
- Capital Account & Flow Management
- International Financial Centre Capability
$5.933 billion (31 December 2013 est.)//$5.211 billion (31 December 2012 est.)
$28.82 billion (31 December 2013 est.)//$27.54 billion (31 December 2012 est.)
GINC Capability Domains · Chapter 11
Production and Innovation
🇧🇭 Bahrain’s output, industry and the engine of prosperity
Economic Output & ProductivityBack to top ↑
Bahrain has made great efforts to diversify its economy; its highly developed communication and transport facilities make Bahrain home to numerous multinational firms with business in the Gulf. As part of its diversification plans, Bahrain implemented a Free Trade Agreement (FTA) with the US in August 2006, the first FTA between the US and a Gulf state. Bahrain's economy, however, continues to depend heavily on oil. In 2012, petroleum production and refining accounted for 77% of Bahrain's export receipts, 87% of government revenues, and 19% of GDP. Other major economic activities are production of aluminum - Bahrain's second biggest export after oil - finance, and construction. Bahrain competes with Malaysia as a worldwide center for Islamic banking and continues to seek new natural gas supplies as feedstock to support its expanding petrochemical and aluminum industries. In 2011 Bahrain experienced economic setbacks as a result of domestic unrest, however, the economy recovered in 2012-13, partly as a result of improved tourism. Some economic policies aimed at restoring confidence in Bahrain's economy, such as the suspension of an expatriate labor tax and frequent bailouts of Gulf Air, will make Bahrain's long-term economic challenges - youth unemployment and the growth of government debt - more difficult to address.
$34.96 billion (2013 est.)//$33.48 billion (2012 est.)//$31.95 billion (2011 est.)
4.4% (2013 est.)//4.8% (2012 est.)//2.1% (2011 est.)
$29,800 (2013 est.)//$29,100 (2012 est.)//$28,300 (2011 est.)
$28.36 billion (2013 est.)
Labour & EmploymentBack to top ↑
- Employment & Labour Force Participation
- Labour Market Institutions & Wage Setting
- Employment Services & Skills Matching
- Labour Adjustment, Transition & Formalisation
716,500
15% (2005 est.)
Industrial & Sectoral BaseBack to top ↑
- Manufacturing & Advanced Industry
- Foundational & Process Industries
- Agrifood & Primary Production
- Services Economy
fruit, vegetables; poultry, dairy products; shrimp, fish
petroleum processing and refining, aluminum smelting, iron pelletization, fertilizers, Islamic and offshore banking, insurance, ship repairing, tourism
4.7% (2013 est.)
Structural Transformation & ComplexityBack to top ↑
Business Dynamism & EntrepreneurshipBack to top ↑
- Entrepreneurship & Firm Creation
- Risk Capital & Scale-Up Finance
- Firm Growth, Exit & Renewal
- Competition & Market Contestability
Innovation & CommercialisationBack to top ↑
- Business Innovation Capability
- Research Commercialisation & Knowledge Transfer
- Intellectual Property & Intangible Assets
- Innovation Ecosystems & Clusters
Technology Adoption & DiffusionBack to top ↑
GINC Capability Domains · Chapter 12
Trade and Investment
🇧🇭 Bahrain’s markets, capital and the terms of global exchange
Overall tradeBack to top ↑
$18.3B of exports to 148 partners and $17.0B of imports from 193 in 2024, a surplus of $1.25B.
- Exports
- $18.3B148 partners
- Imports
- $17.0B193 partners
- Balance
- +$1.25Bsurplus
- Total trade
- $35.2B2024
ExportsBack to top ↑
Where its exports go
The largest partners in 2024, with each one's share of the nation's exports.
| Partner | Value | Share | |
|---|---|---|---|
| Saudi Arabia | $3.12B | 17% | |
| United Arab Emirates | $1.71B | 9.3% | |
| United States | $1.29B | 7.1% | |
| South Africa | $1.01B | 5.5% | |
| India | $812M | 4.4% | |
| Singapore | $616M | 3.4% | |
| Egypt | $613M | 3.4% | |
| Morocco | $510M | 2.8% | |
| France | $452M | 2.5% | |
| South Korea | $379M | 2.1% | |
| Japan | $374M | 2.1% | |
| Thailand | $368M | 2.0% | |
| Germany | $353M | 1.9% | |
| Algeria | $348M | 1.9% | |
| Netherlands | $344M | 1.9% | |
| Zambia | $317M | 1.7% | |
| Qatar | $282M | 1.5% | |
| Zimbabwe | $275M | 1.5% | |
| Spain | $268M | 1.5% | |
| Mexico | $262M | 1.4% |
What it exports
The largest categories in 2024.
| Category | Value | Share | |
|---|---|---|---|
| Mineral fuels, oils, distillation products | $5.90B | 32% | |
| Aluminum | $4.88B | 27% | |
| Ores slag and ash | $1.50B | 8.2% | |
| Machinery, nuclear reactors, boilers | $841M | 4.6% | |
| Iron and steel | $629M | 3.4% | |
| Dairy products, eggs, honey, edible products | $506M | 2.8% | |
| Articles of iron or steel | $465M | 2.5% | |
| Vehicles other than railway, tramway | $460M | 2.5% | |
| Pearls, precious stones, metals, coins | $399M | 2.2% | |
| Fertilizers | $294M | 1.6% | |
| Electrical, electronic equipment | $260M | 1.4% | |
| Plastics | $233M | 1.3% | |
| Copper | $188M | 1.0% | |
| Cereal, flour, starch, milk preparations and products | $171M | 0.9% | |
| Glass and glassware | $146M | 0.8% |
ImportsBack to top ↑
Where its imports come from
The largest partners in 2024, with each one's share of the nation's imports.
| Partner | Value | Share | |
|---|---|---|---|
| Saudi Arabia | $2.46B | 14% | |
| China | $2.29B | 13% | |
| Australia | $1.35B | 7.9% | |
| Brazil | $1.28B | 7.5% | |
| United Arab Emirates | $1.18B | 6.9% | |
| United States | $934M | 5.5% | |
| India | $876M | 5.2% | |
| Japan | $694M | 4.1% | |
| Germany | $671M | 3.9% | |
| Italy | $430M | 2.5% | |
| United Kingdom | $297M | 1.7% | |
| Switzerland | $281M | 1.7% | |
| Chile | $274M | 1.6% | |
| France | $270M | 1.6% | |
| Thailand | $239M | 1.4% | |
| South Korea | $213M | 1.3% | |
| Canada | $185M | 1.1% | |
| Turkey | $185M | 1.1% | |
| Spain | $175M | 1.0% | |
| Netherlands | $163M | 1.0% |
What it imports
The largest categories in 2024.
| Category | Value | Share | |
|---|---|---|---|
| Ores slag and ash | $1.56B | 9.1% | |
| Vehicles other than railway, tramway | $1.50B | 8.8% | |
| Inorganic chemicals, precious metal compound, isotope | $1.44B | 8.5% | |
| Ships, boats, and other floating structures | $1.39B | 8.2% | |
| Machinery, nuclear reactors, boilers | $1.37B | 8.1% | |
| Electrical, electronic equipment | $1.19B | 7.0% | |
| Pearls, precious stones, metals, coins | $630M | 3.7% | |
| Mineral fuels, oils, distillation products | $537M | 3.2% | |
| Pharmaceutical products | $461M | 2.7% | |
| Plastics | $419M | 2.5% | |
| Dairy products, eggs, honey, edible products | $403M | 2.4% | |
| Articles of iron or steel | $330M | 1.9% | |
| Meat and edible meat offal | $298M | 1.8% | |
| Aircraft, spacecraft | $246M | 1.4% | |
| Optical, photo, technical, medical apparatus | $240M | 1.4% |
In a list, the bar runs to the largest in that list. The line is each figure’s history from 2000, drawn to its own peak: it shows the shape of the years, and the value shows the size.
External balanceBack to top ↑
$1.907 billion (2013 est.)//$2.221 billion (2012 est.)
Trade Facilitation & LogisticsBack to top ↑
Trade Policy & Market AccessBack to top ↑
- Trade Policy & Negotiation Capability
- Market Access & Agreements Network
- Trade Law & Enforcement
- Standards, Conformity & Quality Infrastructure
Digital & Services TradeBack to top ↑
- Services Trade Capability
- Digital Trade & E-Commerce
- Data Flows & Digital Trade Governance
- Tourism & Visitor Economy
Investment Attraction & ProjectionBack to top ↑
- Investment Attraction & Facilitation
- Investment Absorption & Linkages
- Outward Investment & Global Corporate Presence
$17.81 billion (31 December 2013 est.)//$16.83 billion (31 December 2012 est.)
$10.86 billion (31 December 2013 est.)//$9.699 billion (31 December 2012 est.)
Export Capability & SophisticationBack to top ↑
$20.69 billion (2013 est.)//$20.39 billion (2012 est.)
Saudi Arabia 3.3%, India 2.2%, UAE 2.2%, South Korea 2% (2012)
petroleum and petroleum products, aluminum, textiles
Global Value Chain PositionBack to top ↑
- Value Chain Participation & Integration
- Value Chain Position & Upgrading
- Regional Integration & Hub Anchoring
Economic Leverage & DependenceBack to top ↑
- Strategic Supply Security
- Concentration Risk & Revenue Stabilisation
- Economic Leverage & Coercion Resistance
$14.41 billion (2013 est.)//$13.24 billion (2012 est.)
Saudi Arabia 27.4%, US 9.6%, China 9.5%, Japan 6.4%, India 4.9%, France 4.7% (2012)
crude oil, machinery, chemicals
Bahrain · you are in
Historical Context
Foundations
GINC Capability Domains
Find in this brief · Bahrain