
Costa Rica
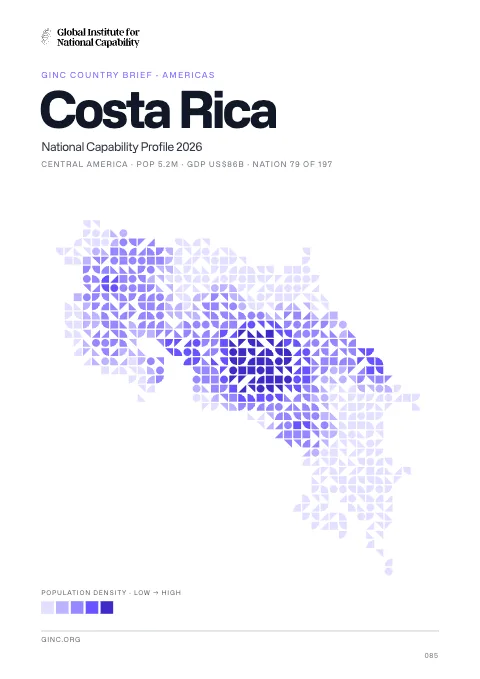
Costa Rica is a democratic republic in Central America and the Caribbean, home to 4.8 million people, with its capital at San Jose.
Contents
12 chapters
Foundations
01–03
At a glance
- Area
- 51.1Kkm²#129 World#6 C. America
- Population
- 4.8M#123 World#8 C. America
- GDP (market)
- $48.5B
- GDP (PPP)
- $61.4B#90 World#6 C. America
- GDP per capita
- $12.9K#102 World#19 C. America
The whole brief
Costa Rica National Capability Profile 2026
Foundations · Chapter 01
Historical Context
🇨🇷 Costa Rica’s understanding the origins and evolution of the modern nation
BackgroundBack to top ↑
Although explored by the Spanish early in the 16th century, initial attempts at colonizing Costa Rica proved unsuccessful due to a combination of factors, including disease from mosquito-infested swamps, brutal heat, resistance by natives, and pirate raids. It was not until 1563 that a permanent settlement of Cartago was established in the cooler, fertile central highlands. The area remained a colony for some two and a half centuries. In 1821, Costa Rica became one of several Central American provinces that jointly declared their independence from Spain. Two years later it joined the United Provinces of Central America, but this federation disintegrated in 1838, at which time Costa Rica proclaimed its sovereignty and independence. Since the late 19th century, only two brief periods of violence have marred the country's democratic development. In 1949, Costa Rica dissolved its armed forces. Although it still maintains a large agricultural sector, Costa Rica has expanded its economy to include strong technology and tourism industries. The standard of living is relatively high. Land ownership is widespread.
IndependenceBack to top ↑
15 September 1821 (from Spain)
National holidayBack to top ↑
Independence Day, 15 September (1821)
Foundations · Chapter 02
Geography
🇨🇷 Costa Rica’s territory, resources and strategic position
Location and areaBack to top ↑
Central America, bordering both the Caribbean Sea and the North Pacific Ocean, between Nicaragua and Panama
10 00 N, 84 00 W
Central America and the Caribbean
slightly smaller than West Virginia
1,290 km
Terrain and resourcesBack to top ↑
coastal plains separated by rugged mountains including over 100 volcanic cones, of which several are major volcanoes
hydropower
1,031 sq km (2003)
Settlement and hazardsBack to top ↑
occasional earthquakes, hurricanes along Atlantic coast; frequent flooding of lowlands at onset of rainy season and landslides; active volcanoes
four volcanoes, two of them active, rise near the capital of San Jose in the center of the country; one of the volcanoes, Irazu, erupted destructively in 1963-65
OtherBack to top ↑
112.4 cu km (2011)
deforestation and land use change, largely a result of the clearing of land for cattle ranching and agriculture; soil erosion; coastal marine pollution; fisheries protection; solid waste management; air pollution
Foundations · Chapter 03
Environment
🇨🇷 Costa Rica’s environmental conditions, resources and national resilience
ClimateBack to top ↑
tropical and subtropical; dry season (December to April); rainy season (May to November); cooler in highlands
Emissions and pollutionBack to top ↑
Water, waste and foodBack to top ↑
Resources and agreementsBack to top ↑
GINC Capability Domains · Chapter 04
Critical Technology
🇨🇷 Costa Rica’s technology frontiers and the pursuit of national advantage
Two counts are set side by side for 2015–2024: on the left, the papers researchers in Costa Rica published; on the right, the patent families that began there and were filed in more than one country. First by capability group, then group by group with each group’s capabilities. The badge on a card is the nation’s place among all nations. Papers are from GINC Research Analytics, patent families from GINC Patents.
Research by capability group
#105 WorldPapers published, 2015–2024
120
100
47
41
28
17
14
13
6
3
Patents by capability group
#81 WorldInternational patent families, 2015–2024
Advanced Materials & ManufacturingBack to top ↑
Research
#103 WorldPapers published, 2015–2024
Patents
#76 WorldInternational patent families, 2015–2024
Energy TechnologiesBack to top ↑
Research
#105 WorldPapers published, 2015–2024
Patents
#69 WorldInternational patent families, 2015–2024
Semiconductors & Advanced ComputingBack to top ↑
Research
#92 WorldPapers published, 2015–2024
No research topic: Semiconductor Design & EDA · Advanced Semiconductor Fabrication · Semiconductor Equipment & Materials · Advanced Packaging & Heterogeneous Integration
Patents
#69 WorldInternational patent families, 2015–2024
Artificial IntelligenceBack to top ↑
Research
#100 WorldPapers published, 2015–2024
Patents
#84 WorldInternational patent families, 2015–2024
Quantum TechnologiesBack to top ↑
Research
#98 WorldPapers published, 2015–2024
Patents
International patent families, 2015–2024
No international patent families on record for 2015–2024.
Connectivity, Cyber & Trust TechnologiesBack to top ↑
Research
#139 WorldPapers published, 2015–2024
Patents
#78 WorldInternational patent families, 2015–2024
Sensing, Timing & NavigationBack to top ↑
Research
#100 WorldPapers published, 2015–2024
Patents
#70 WorldInternational patent families, 2015–2024
Robotics & Autonomous SystemsBack to top ↑
Research
#97 WorldPapers published, 2015–2024
No research topic: Human-Machine Interfaces
Patents
International patent families, 2015–2024
No international patent families on record for 2015–2024.
Biotechnology & Health TechnologiesBack to top ↑
Research
#102 WorldPapers published, 2015–2024
Patents
#78 WorldInternational patent families, 2015–2024
Medicine and BioTech
Clinical research and life-science invention, drawn from the same series that drive the metric pages. Each card opens the full cross-country comparison.
Space TechnologiesBack to top ↑
Research
#70 WorldPapers published, 2015–2024
Patents
International patent families, 2015–2024
No international patent families on record for 2015–2024.
GINC Capability Domains · Chapter 05
Strategic Infrastructure
🇨🇷 Costa Rica’s energy, connectivity and the material foundations of capability
Resource InfrastructureBack to top ↑
290.7 bbl/day (2012 est.)
0 bbl/day (2010 est.)
10,040 bbl/day (2010 est.)
0 bbl (1 January 2013 est.)
10,630 bbl/day (2010 est.)
50,200 bbl/day (2011 est.)
1,898 bbl/day (2010 est.)
40,290 bbl/day (2010 est.)
0 cu m (2011 est.)
0 cu m (2010 est.)
0 cu m (2011 est.)
0 cu m (2011 est.)
0 cu m (1 January 2013 est.)
refined products 662 km (2013)
Agriculture & Food InfrastructureBack to top ↑
- Irrigation & Agricultural Water
- Livestock & Veterinary
- Fisheries & Aquaculture
- Storage, Cold Chain & Markets
Energy InfrastructureBack to top ↑
- Thermal Generation
- Nuclear Generation
- Nuclear Fuel Cycle & Radioactive Waste
- Hydropower
- Renewable Generation
- Transmission & Distribution
- System Control & Dispatch
- Storage & Fuel Supply
2.8 million kW (2010 est.)
9.473 billion kWh (2010 est.)
8.532 billion kWh (2010 est.)
135 million kWh (2010 est.)
164 million kWh (2010 est.)
32.4% of total installed capacity (2010 est.)
0% of total installed capacity (2010 est.)
55.5% of total installed capacity (2010 est.)
12.1% of total installed capacity (2010 est.)
6.806 million Mt (2011 est.)
Water, Sanitation & Waste InfrastructureBack to top ↑
- Dams, Reservoirs & Flood Defence
- Water Supply & Treatment
- Bulk Water Transfer & Desalination
- Wastewater & Sanitation
- Solid Waste & Recycling
Advanced ManufacturingBack to top ↑
- Materials & Inputs
- Chemicals & Hazardous Process Industry
- Production Systems
- Supply Chain & Ecosystem
- Workforce & Innovation
Transport InfrastructureBack to top ↑
- Seaports & Terminals
- Air Infrastructure
- Air Navigation & Traffic Management
- Inland Waterways & Ferries
- Rail Infrastructure
- Roads & Bridges
- Logistics, Multimodal & Border Infrastructure
- Postal & Parcel
161 (2013)
730 km (seasonally navigable by small craft) (2011)
Communications & Digital InfrastructureBack to top ↑
- Subsea Cables & International Gateways
- Core & Backbone Networks
- Mobile & Wireless Networks
- Spectrum & Broadcasting
- Data Centres, Compute & Cloud
- Data Resources
- AI Tools & Applications
1.018 million (2012)
6.151 million (2012)
1.485 million (2009)
147,258 (2012)
.cr
Financial InfrastructureBack to top ↑
- Currency & Reserves
- Payments & Settlement Systems
- Markets, Exchanges & Depositories
- Banks, Insurers & Systemic Institutions
Social InfrastructureBack to top ↑
- Health Infrastructure
- Public Health & Laboratories
- Medical Supply & Stockpiles
- Education & Skills Infrastructure
- Research & Scientific Facilities
- Housing, Community & Social Services
- Government & Public Administration
- Cultural, Community & Recreational Infrastructure
- Justice & Corrections
- Emergency Services & Civil Protection
- Hydrometeorology & Early Warning
Space, Aerospace & Defence InfrastructureBack to top ↑
GINC Capability Domains · Chapter 06
National Security
🇨🇷 Costa Rica’s force, intelligence and the defence of the nation
Disputes and terrorismBack to top ↑
Costa Rica and Nicaragua regularly file border dispute cases over the delimitations of the San Juan River and the northern tip of Calero Island to the International Court of Justice (ICJ); in 2009, the ICJ ruled that Costa Rican vessels carrying out police activities could not use the river, but official Costa Rican vessels providing essential services to riverside inhabitants and Costa Rican tourists could travel freely on the river; in 2011, the ICJ provisionally ruled that both countries must remove personnel from the disputed area; in 2013, the ICJ rejected Nicaragua's 2012 suit to halt Costa Rica's construction of a highway paralleling the river on the grounds of irreparable environmental damage; in 2013, the ICJ, regarding the disputed territory, ordered that Nicaragua should refrain from dredging or canal construction and refill and repair damage caused by trenches connecting the river to the Caribbean and upheld its 2010 ruling that Nicaragua must remove all personnel; in early 2014, Costa Rica brought Nicaragua to the ICJ over offshore oil concessions in the disputed region
Force Generation & MobilisationBack to top ↑
no regular military forces; Ministry of Public Security, Government, and Police (2011)
Forces under arms
Active-duty strength on the Correlates of War series, which reaches back to 1816 and so carries a nation’s whole record of mobilisation rather than its present establishment. The card opens the full cross-country comparison.
Intelligence & AssessmentBack to top ↑
- Imagery & Geospatial Intelligence
- Signals & Cyber Intelligence
- Technical & Measurement Intelligence
- Open-Source & Financial Intelligence
- Human Intelligence & Counterintelligence
- All-Source Analysis & Warning
Joint Command, Projection & SustainmentBack to top ↑
- Command, Control & Communications
- Strategic Lift & Mobility
- Expeditionary & Peace Operations
- Operational Sustainment & War Reserves
- Defence Industrial Mobilisation
- CBRN Defence
Land PowerBack to top ↑
- Combined Arms Manoeuvre
- Land Fires
- Battlefield Aviation & Uncrewed Systems
- Special Operations & Irregular Warfare
Maritime PowerBack to top ↑
- Maritime Security & Constabulary
- Sea Denial & Undersea Warfare
- Sea Control
- Amphibious & Expeditionary Operations
Air PowerBack to top ↑
- Air Sovereignty & Policing
- Control of the Air
- Air Strike & Interdiction
- Airborne ISR, Early Warning & Battle Management
Strategic Strike & Missile DefenceBack to top ↑
Space OperationsBack to top ↑
Cyber & Electromagnetic OperationsBack to top ↑
Nuclear DeterrenceBack to top ↑
GINC Capability Domains · Chapter 07
Human Capital
🇨🇷 Costa Rica’s population, health and the skills that sustain capability
DemographyBack to top ↑
4,755,234 (July 2014 est.)
Costa Rica's political stability, high standard of living, and well-developed social benefits system set it apart from its Central American neighbors. Through the government's sustained social spending - almost 20% of GDP annually - Costa Rica has made tremendous progress toward achieving its goal of providing universal access to education, healthcare, clean water, sanitation, and electricity. Since the 1970s, expansion of these services has led to a rapid decline in infant mortality, an increase in life expectancy at birth, and a sharp decrease in the birth rate. The average number of children born per women has fallen from about 7 in the 1960s to 3.5 in the early 1980s to below replacement level today. Costa Rica's poverty rate is lower than in most Latin American countries, but it has stalled at around 20% for almost two decades.//Costa Rica is a popular regional immigration destination because of its job opportunities and social programs. Almost 9% of the population is foreign-born, with Nicaraguans comprising nearly three-quarters of the foreign population. Many Nicaraguans who perform unskilled seasonal labor enter Costa Rica illegally or overstay their visas, which continues to be a source of tension. Less than 3% of Costa Rica's population lives abroad. The overwhelming majority of expatriates have settled in the United States after completing a university degree or in order to work in a highly skilled field.
1.24% (2014 est.)
16.08 births/1,000 population (2014 est.)
4.49 deaths/1,000 population (2014 est.)
1.91 children born/woman (2014 est.)
82.2% (2010)
Migration and urbanisationBack to top ↑
0.84 migrant(s)/1,000 population (2014 est.)
SAN JOSE (capital) 1.515 million (2011)
Welfare and equityBack to top ↑
24.8% (2011 est.)
50.3 (2009)//45.9 (1997)
DisplacementBack to top ↑
Early Childhood DevelopmentBack to top ↑
1.1% (2009)
Foundational EducationBack to top ↑
6.3% of GDP (2009)
Advanced EducationBack to top ↑
Technical & Vocational SkillsBack to top ↑
Digital & AI CompetenceBack to top ↑
Generative AI adoption
Modelled share of working-age adults using generative AI, from Microsoft telemetry scaled to each country’s 15–64 population. A measure of how fast a workforce is absorbing the technology rather than of how much of it a nation builds. The card opens the full cross-country comparison.
Lifelong Learning & ReskillingBack to top ↑
Research Talent & Knowledge CreationBack to top ↑
Population HealthBack to top ↑
40 deaths/100,000 live births (2010)
23.7% (2008)
0.3% (2012 est.)
9,800 (2012 est.)
300 (2012 est.)
Health System CapabilityBack to top ↑
10.9% of GDP (2011)
1.32 physicians/1,000 population (2000)
1.2 beds/1,000 population (2011)
GINC Capability Domains · Chapter 08
Governance and Integrity
🇨🇷 Costa Rica’s institutions, law and the integrity of the state
State structureBack to top ↑
democratic republic
7 provinces (provincias, singular - provincia); Alajuela, Cartago, Guanacaste, Heredia, Limon, Puntarenas, San Jose
previous 1825; latest adopted 7 November 1949; amended many times, last in 2005 (2005)
18 years of age; universal and compulsory
Political Institutions & Civic ParticipationBack to top ↑
- Electoral Management & Integrity
- Legislature & Deliberative Institutions
- Citizen Participation & Civic Space
unicameral Legislative Assembly or Asamblea Legislativa (57 seats; members elected by direct, popular vote to serve four-year terms)
Accessibility Without Exclusion or PASE [Oscar Andres LOPEZ Arias]//Citizen Action Party or PAC [Olivier PEREZ Gonzalez]//Costa Rican Renovation Party or PRC [Gerardo Justo OROZCO Alvarez]//Broad Front (Frente Amplio) or PFA [Ana Patricia MORA]//Libertarian Movement Party or ML [Victor Danilo CUBERO Corrales]//National Integration Party or PIN [Walter MUNOZ Cespedes]//National Liberation Party or PLN [Bernal JIMENEZ]//National Restoration Party or PRN [Carlos AVENDANO]//Patriotic Alliance [Jorge ARAYA Westover]//Popular Vanguard [Humberto VARGAS]//Social Christian Unity Party or PUSC [Gerardo VARGAS]
Authentic Confederation of Democratic Workers or CATD (Communist Party affiliate)//Chamber of Coffee Growers//Confederated Union of Workers or CUT (Communist Party affiliate)//Costa Rican Confederation of Democratic Workers or CCTD (Liberation Party affiliate)//Costa Rican Exporter's Chamber or CADEXCO//Costa Rican Solidarity Movement//Costa Rican Union of Private Sector Enterprises or UCCAEP//Federation of Public Service Workers or FTSP//National Association for Economic Development or ANFE//National Association of Educators or ANDE//National Association of Public and Private Employees or ANEP//Confederation of Workers Rerum Novarum or CTRN (PLN affiliate)
Justice System & Fundamental RightsBack to top ↑
- Judicial Independence & Court Capability
- Access to Justice & Legal Services
- Fundamental Rights Protection
- Human Rights Institutions & Equality Bodies
civil law system based on Spanish civil code; judicial review of legislative acts in the Supreme Court
accepts compulsory ICJ jurisdiction; accepts ICCt jurisdiction
Internal Security & OrderBack to top ↑
transshipment country for cocaine and heroin from South America; illicit production of cannabis in remote areas; domestic cocaine consumption, particularly crack cocaine, is rising; significant consumption of amphetamines; seizures of smuggled cash in Costa Rica and at the main border crossing to enter Costa Rica from Nicaragua have risen in recent years (2008)
Regulatory Governance & Strategic ControlsBack to top ↑
- Regulatory Quality & Better Regulation
- Regulatory Delivery & Independent Regulators
- Strategic Controls & Economic Security Administration
Government Effectiveness & Public AdministrationBack to top ↑
- Centre of Government & Policy Coordination
- Civil Service & Public Workforce
- Digital Government & Service Delivery
- Legal Identity & Civil Registration
- Statistical & Data Capability
Public Integrity & Anti-CorruptionBack to top ↑
Transparency, Oversight & AccountabilityBack to top ↑
- Right to Information & Open Government
- Independent Oversight & Supreme Audit
- Independent Media & Journalist Safety
National Resilience & Crisis ManagementBack to top ↑
GINC Capability Domains · Chapter 09
Information and Influence
🇨🇷 Costa Rica’s identity, media and the projection of influence
Identity and cultureBack to top ↑
Spanish (official), English
Roman Catholic 76.3%, Evangelical 13.7%, Jehovah's Witnesses 1.3%, other Protestant 0.7%, other 4.8%, none 3.2%
white or mestizo 83.6%, mulato 6.7%, indigenous 2.4%, black of African descent 1.1%, other 1.1%, none 2.9%, unspecified 2.2% (2011 est.)
clay-colored robin known as Yiguirro
five horizontal bands of blue (top), white, red (double width), white, and blue, with the coat of arms in a white elliptical disk toward the hoist side of the red band; Costa Rica retained the earlier blue-white-blue flag of Central America until 1848 when, in response to revolutionary activity in Europe, it was decided to incorporate the French colors into the national flag and a central red stripe was added; today the blue color is said to stand for the sky, opportunity, and perseverance, white denotes peace, happiness, and wisdom, while red represents the blood shed for freedom, as well as the generosity and vibrancy of the people
Diplomatic Statecraft & Global NetworksBack to top ↑
- Diplomatic Network & Consular Reach
- Multilateral Leadership & Norm Setting
- Agenda-Setting & Convening
- Mediation & Crisis Diplomacy
BCIE, CACM, CD, CELAC, FAO, G-77, IADB, IAEA, IBRD, ICAO, ICC (national committees), ICRM, IDA, IFAD, IFC, IFRCS, ILO, IMF, IMO, IMSO, Interpol, IOC, IOM, IPU, ISO, ITSO, ITU, ITUC (NGOs), LAES, LAIA (observer), MIGA, NAM (observer), OAS, OPANAL, OPCW, Pacific Alliance, PCA, SICA, UN, UNCTAD, UNESCO, UNHCR, UNIDO, Union Latina, UNWTO, UPU, WCO, WFTU (NGOs), WHO, WIPO, WMO, WTO
Alliances & Security CooperationBack to top ↑
Development Cooperation & Global AssistanceBack to top ↑
Culture, Language & Education DiplomacyBack to top ↑
- Cultural & Language Institutes
- Creative Industries & Cultural Export Reach
- Heritage & Cultural Institutions
- Education Diplomacy & Alumni Networks
- Sports & Major Events
Diaspora & Global CommunitiesBack to top ↑
Information Environment & Strategic CommunicationBack to top ↑
- Strategic Communications & Public Diplomacy
- International Media & Broadcasting
- Information Defence & Counter-Interference
multiple privately owned TV stations and 1 publicly owned TV station; cable network services are widely available; more than 100 privately owned radio stations and a public radio network (2007)
GINC Capability Domains · Chapter 10
Financial Strength
🇨🇷 Costa Rica’s fiscal depth, reserves and the capacity to act
Monetary & Currency CapabilityBack to top ↑
- Monetary Policy & Price Stability
- Exchange Rate & External Account Management
- Currency Issuance & Digital Money
5.6% (2013 est.)//4.5% (2012 est.)
Costa Rican colones (CRC) per US dollar -//500.9 (2013 est.)//502.9 (2012 est.)//525.83 (2010 est.)//573.29 (2009)//530.41 (2008)
$NA (31 December 2010 est.)//23% (31 December 2009 est.)
$NA (31 December 2013 est.)//$NA (31 December 2012 est.)
$4.633 billion (31 December 2013 est.)//$4.197 billion (31 December 2012 est.)
$14.57 billion (31 December 2013 est.)//$14.95 billion (31 December 2012 est.)
Fiscal Capacity & Public FinanceBack to top ↑
- Revenue Mobilisation & Tax Administration
- Public Expenditure & Budget Management
- Sovereign Debt & Treasury Management
- Public Investment Management
14.8% of GDP (2013 est.)
-5% of GDP (2013 est.)
55% of GDP (2013 est.)//51.9% of GDP (2012 est.)
calendar year
Financial System Depth & AccessBack to top ↑
- Banking System Capacity
- Capital Markets Depth & Development
- Long-Term & Institutional Capital
- Financial Inclusion & Household Access
- Development & Policy Finance
$22.92 billion (31 December 2013 est.)//$21.93 billion (31 December 2012 est.)
$2.015 billion (31 December 2012 est.)//$1.443 billion (31 December 2011)//$1.445 billion (31 December 2010 est.)
16.3% of GDP (2013 est.)//15.9% of GDP (2012 est.)//16.2% of GDP (2011 est.)
Financial Regulation & IntegrityBack to top ↑
- Prudential Regulation & Supervision
- Financial Integrity & Illicit Finance Control
- Market Conduct & Consumer Protection
- Payment & Market Infrastructure Oversight
Financial Stability & Crisis ManagementBack to top ↑
- Macroprudential & Systemic Oversight
- Crisis Management, Resolution & Deposit Insurance
- External Liquidity & Financial Safety Nets
Sovereign Capital & External Financial PowerBack to top ↑
- Official Reserves Management
- Sovereign Wealth & Public Asset Management
- Currency Internationalisation & Reserve Status
- Capital Account & Flow Management
- International Financial Centre Capability
$7.406 billion (31 December 2013 est.)//$6.857 billion (31 December 2012 est.)
$15.1 billion (31 December 2013 est.)//$13.81 billion (31 December 2012 est.)
GINC Capability Domains · Chapter 11
Production and Innovation
🇨🇷 Costa Rica’s output, industry and the engine of prosperity
Economic Output & ProductivityBack to top ↑
Prior to the global economic crisis, Costa Rica enjoyed stable economic growth. The economy contracted 1.3% in 2009 but resumed growth at about 4.5% per year in 2010-12. While the traditional agricultural exports of bananas, coffee, sugar, and beef are still the backbone of commodity export trade, a variety of industrial and specialized agricultural products have broadened export trade in recent years. High value-added goods and services, including microchips, have further bolstered exports. Tourism continues to bring in foreign exchange, as Costa Rica's impressive biodiversity makes it a key destination for ecotourism. Foreign investors remain attracted by the country's political stability and relatively high education levels, as well as the incentives offered in the free-trade zones; and Costa Rica has attracted one of the highest levels of foreign direct investment per capita in Latin America. However, many business impediments remain, such as high levels of bureaucracy, legal uncertainty due to overlapping and at times conflicting responsibilities between agencies, difficulty of enforcing contracts, and weak investor protection. Poverty has remained around 20-25% for nearly 20 years, and the strong social safety net that had been put into place by the government has eroded due to increased financial constraints on government expenditures. Unlike the rest of Central America, Costa Rica is not highly dependent on remittances as they only represent about 2% of GDP. Immigration from Nicaragua has increasingly become a concern for the government. The estimated 300,000-500,000 Nicaraguans in Costa Rica legally and illegally are an important source of mostly unskilled labor but also place heavy demands on the social welfare system. The US-Central American-Dominican Republic Free Trade Agreement (CAFTA-DR) entered into force on 1 January 2009 after significant delays within the Costa Rican legislature. CAFTA-DR has increased foreign direct investment in key sectors of the economy, including the insurance and telecommunications sectors recently opened to private investors. President CHINCHILLA was not able to gain legislative approval for fiscal reform, her top priority, though she continued to pursue fiscal reform in 2012. President CHINCHILLA and the PLN were successful in passing a tax on corporations to fund an increase for security services.
$61.43 billion (2013 est.)//$59.35 billion (2012 est.)//$56.45 billion (2011 est.)
3.5% (2013 est.)//5.1% (2012 est.)//4.4% (2011 est.)
$12,900 (2013 est.)//$12,700 (2012 est.)//$12,200 (2011 est.)
$48.51 billion (2013 est.)
Labour & EmploymentBack to top ↑
- Employment & Labour Force Participation
- Labour Market Institutions & Wage Setting
- Employment Services & Skills Matching
- Labour Adjustment, Transition & Formalisation
2.222 million
7.9% (2013 est.)//7.8% (2012 est.)
Industrial & Sectoral BaseBack to top ↑
- Manufacturing & Advanced Industry
- Foundational & Process Industries
- Agrifood & Primary Production
- Services Economy
bananas, pineapples, coffee, melons, ornamental plants, sugar, corn, rice, beans, potatoes; beef, poultry, dairy; timber
microprocessors, food processing, medical equipment, textiles and clothing, construction materials, fertilizer, plastic products
4.3% (2013 est.)
Structural Transformation & ComplexityBack to top ↑
Business Dynamism & EntrepreneurshipBack to top ↑
- Entrepreneurship & Firm Creation
- Risk Capital & Scale-Up Finance
- Firm Growth, Exit & Renewal
- Competition & Market Contestability
Innovation & CommercialisationBack to top ↑
- Business Innovation Capability
- Research Commercialisation & Knowledge Transfer
- Intellectual Property & Intangible Assets
- Innovation Ecosystems & Clusters
Technology Adoption & DiffusionBack to top ↑
GINC Capability Domains · Chapter 12
Trade and Investment
🇨🇷 Costa Rica’s markets, capital and the terms of global exchange
Overall tradeBack to top ↑
$27.2B of exports to 167 partners and $23.7B of imports from 199 in 2024, a surplus of $3.48B.
- Exports
- $27.2B167 partners
- Imports
- $23.7B199 partners
- Balance
- +$3.48Bsurplus
- Total trade
- $50.9B2024
ExportsBack to top ↑
Where its exports go
The largest partners in 2024, with each one's share of the nation's exports.
| Partner | Value | Share | |
|---|---|---|---|
| United States | $10.5B | 39% | |
| Netherlands | $1.84B | 6.8% | |
| China | $1.40B | 5.2% | |
| Mexico | $1.31B | 4.8% | |
| Guatemala | $995M | 3.7% | |
| Belgium | $870M | 3.2% | |
| Nicaragua | $707M | 2.6% | |
| Honduras | $553M | 2.0% | |
| Panama | $546M | 2.0% | |
| Germany | $524M | 1.9% | |
| Japan | $477M | 1.8% | |
| Hong Kong | $469M | 1.7% | |
| United Kingdom | $468M | 1.7% | |
| El Salvador | $457M | 1.7% | |
| Spain | $445M | 1.6% | |
| Czech Republic | $443M | 1.6% | |
| Canada | $436M | 1.6% | |
| Taiwan | $408M | 1.5% | |
| Singapore | $387M | 1.4% | |
| France | $375M | 1.4% |
What it exports
The largest categories in 2024.
| Category | Value | Share | |
|---|---|---|---|
| Optical, photo, technical, medical apparatus | $10.2B | 38% | |
| Electrical, electronic equipment | $5.18B | 19% | |
| Edible fruits, nuts, peel of citrus fruit, melons | $3.80B | 14% | |
| Miscellaneous edible preparations | $1.01B | 3.7% | |
| Plastics | $680M | 2.5% | |
| Vegetable, fruit, nut food preparations | $588M | 2.2% | |
| Coffee, tea, mate and spices | $440M | 1.6% | |
| Machinery, nuclear reactors, boilers | $437M | 1.6% | |
| Rubbers | $328M | 1.2% | |
| Edible vegetables and certain roots and tubers | $269M | 1.0% | |
| Animal, vegetable fats and oils, cleavage products | $256M | 0.9% | |
| Iron and steel | $245M | 0.9% | |
| Paper and paperboard, articles of pulp, paper and board | $241M | 0.9% | |
| Pharmaceutical products | $238M | 0.9% | |
| Cereal, flour, starch, milk preparations and products | $225M | 0.8% |
ImportsBack to top ↑
Where its imports come from
The largest partners in 2024, with each one's share of the nation's imports.
| Partner | Value | Share | |
|---|---|---|---|
| United States | $8.65B | 36% | |
| China | $4.06B | 17% | |
| Mexico | $1.48B | 6.2% | |
| Brazil | $676M | 2.9% | |
| Guatemala | $641M | 2.7% | |
| Japan | $607M | 2.6% | |
| Germany | $555M | 2.3% | |
| Spain | $411M | 1.7% | |
| Colombia | $404M | 1.7% | |
| Panama | $382M | 1.6% | |
| Chile | $358M | 1.5% | |
| Netherlands | $357M | 1.5% | |
| El Salvador | $310M | 1.3% | |
| South Korea | $286M | 1.2% | |
| Italy | $286M | 1.2% | |
| India | $285M | 1.2% | |
| Canada | $260M | 1.1% | |
| Nicaragua | $225M | 0.9% | |
| Thailand | $222M | 0.9% | |
| Vietnam | $218M | 0.9% |
What it imports
The largest categories in 2024.
| Category | Value | Share | |
|---|---|---|---|
| Mineral fuels, oils, distillation products | $2.51B | 11% | |
| Electrical, electronic equipment | $2.38B | 10% | |
| Vehicles other than railway, tramway | $2.19B | 9.3% | |
| Machinery, nuclear reactors, boilers | $2.09B | 8.8% | |
| Plastics | $1.81B | 7.6% | |
| Optical, photo, technical, medical apparatus | $1.32B | 5.6% | |
| Pharmaceutical products | $1.07B | 4.5% | |
| Iron and steel | $806M | 3.4% | |
| Paper and paperboard, articles of pulp, paper and board | $752M | 3.2% | |
| Articles of iron or steel | $532M | 2.2% | |
| Cereals | $522M | 2.2% | |
| Essential oils, perfumes, cosmetics, toiletries | $358M | 1.5% | |
| Miscellaneous chemical products | $344M | 1.5% | |
| Furniture, lighting signs, prefabricated buildings | $328M | 1.4% | |
| Rubbers | $278M | 1.2% |
In a list, the bar runs to the largest in that list. The line is each figure’s history from 2000, drawn to its own peak: it shows the shape of the years, and the value shows the size.
External balanceBack to top ↑
-$2.673 billion (2013 est.)//-$2.341 billion (2012 est.)
Trade Facilitation & LogisticsBack to top ↑
Trade Policy & Market AccessBack to top ↑
- Trade Policy & Negotiation Capability
- Market Access & Agreements Network
- Trade Law & Enforcement
- Standards, Conformity & Quality Infrastructure
Digital & Services TradeBack to top ↑
- Services Trade Capability
- Digital Trade & E-Commerce
- Data Flows & Digital Trade Governance
- Tourism & Visitor Economy
Investment Attraction & ProjectionBack to top ↑
- Investment Attraction & Facilitation
- Investment Absorption & Linkages
- Outward Investment & Global Corporate Presence
$21.7 billion (31 December 2013 est.)//$18.98 billion (31 December 2012 est.)
$1.681 billion (31 December 2013 est.)//$1.481 billion (31 December 2012 est.)
Export Capability & SophisticationBack to top ↑
$11.66 billion (2013 est.)//$11.44 billion (2012 est.)
US 38.9%, Netherlands 7.5%, Panama 5.1%, Hong Kong 4.6%, Nicaragua 4.4% (2012)
bananas, pineapples, coffee, melons, ornamental plants, sugar; beef; seafood; electronic components, medical equipment
Global Value Chain PositionBack to top ↑
- Value Chain Participation & Integration
- Value Chain Position & Upgrading
- Regional Integration & Hub Anchoring
Economic Leverage & DependenceBack to top ↑
- Strategic Supply Security
- Concentration Risk & Revenue Stabilisation
- Economic Leverage & Coercion Resistance
$17.56 billion (2013 est.)//$16.75 billion (2012 est.)
US 49.8%, China 8.2%, Mexico 6.6% (2012)
raw materials, consumer goods, capital equipment, petroleum, construction materials
Costa Rica · you are in
Historical Context
Foundations
GINC Capability Domains
Find in this brief · Costa Rica