
Panama
Panama is a constitutional democracy in Central America and the Caribbean, home to 3.6 million people, with its capital at Panama City.
Contents
12 chapters
Foundations
01–03
At a glance
- Area
- 75.4Kkm²#118 World#5 C. America
- Population
- 3.6M#130 World#10 C. America
- GDP (market)
- $40.6B
- GDP (PPP)
- $61.5B#89 World#5 C. America
- GDP per capita
- $16.5K#82 World#10 C. America
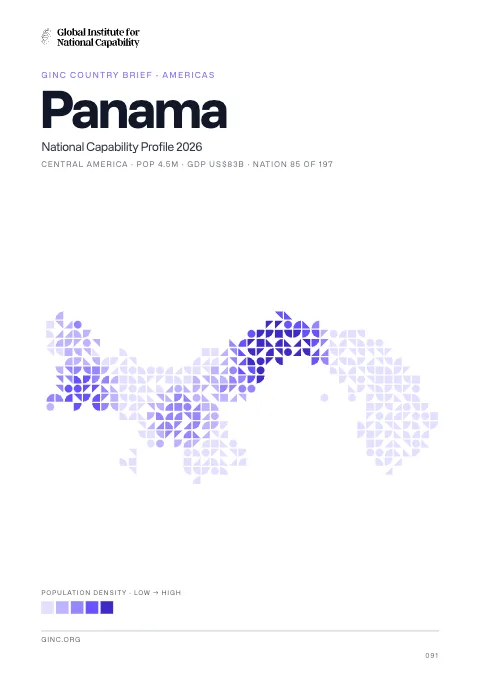
The whole brief
Panama National Capability Profile 2026
Foundations · Chapter 01
Historical Context
🇵🇦 Panama’s understanding the origins and evolution of the modern nation
BackgroundBack to top ↑
Explored and settled by the Spanish in the 16th century, Panama broke with Spain in 1821 and joined a union of Colombia, Ecuador, and Venezuela - named the Republic of Gran Colombia. When the latter dissolved in 1830, Panama remained part of Colombia. With US backing, Panama seceded from Colombia in 1903 and promptly signed a treaty with the US allowing for the construction of a canal and US sovereignty over a strip of land on either side of the structure (the Panama Canal Zone). The Panama Canal was built by the US Army Corps of Engineers between 1904 and 1914. In 1977, an agreement was signed for the complete transfer of the Canal from the US to Panama by the end of the century. Certain portions of the Zone and increasing responsibility over the Canal were turned over in the subsequent decades. With US help, dictator Manuel NORIEGA was deposed in 1989. The entire Panama Canal, the area supporting the Canal, and remaining US military bases were transferred to Panama by the end of 1999. In October 2006, Panamanians approved an ambitious plan (estimated to cost $5.3 billion) to expand the Canal. The project, which began in 2007 and could double the Canal's capacity, is expected to be completed in 2015.
IndependenceBack to top ↑
3 November 1903 (from Colombia; became independent from Spain on 28 November 1821)
National holidayBack to top ↑
Independence Day, 3 November (1903)
Foundations · Chapter 02
Geography
🇵🇦 Panama’s territory, resources and strategic position
Location and areaBack to top ↑
Central America, bordering both the Caribbean Sea and the North Pacific Ocean, between Colombia and Costa Rica
9 00 N, 80 00 W
Central America and the Caribbean
slightly smaller than South Carolina
2,490 km
Terrain and resourcesBack to top ↑
interior mostly steep, rugged mountains and dissected, upland plains; coastal areas largely plains and rolling hills
copper, mahogany forests, shrimp, hydropower
346.2 sq km (2003)
Settlement and hazardsBack to top ↑
occasional severe storms and forest fires in the Darien area
strategic location on eastern end of isthmus forming land bridge connecting North and South America; controls Panama Canal that links North Atlantic Ocean via Caribbean Sea with North Pacific Ocean
OtherBack to top ↑
148 cu km (2011)
water pollution from agricultural runoff threatens fishery resources; deforestation of tropical rain forest; land degradation and soil erosion threatens siltation of Panama Canal; air pollution in urban areas; mining threatens natural resources
Foundations · Chapter 03
Environment
🇵🇦 Panama’s environmental conditions, resources and national resilience
ClimateBack to top ↑
tropical maritime; hot, humid, cloudy; prolonged rainy season (May to January), short dry season (January to May)
Emissions and pollutionBack to top ↑
Water, waste and foodBack to top ↑
Resources and agreementsBack to top ↑
GINC Capability Domains · Chapter 04
Critical Technology
🇵🇦 Panama’s technology frontiers and the pursuit of national advantage
Two counts are set side by side for 2015–2024: on the left, the papers researchers in Panama published; on the right, the patent families that began there and were filed in more than one country. First by capability group, then group by group with each group’s capabilities. The badge on a card is the nation’s place among all nations. Papers are from GINC Research Analytics, patent families from GINC Patents.
Research by capability group
#121 WorldPapers published, 2015–2024
Patents by capability group
#69 WorldInternational patent families, 2015–2024
Advanced Materials & ManufacturingBack to top ↑
Research
#105 WorldPapers published, 2015–2024
Patents
#63 WorldInternational patent families, 2015–2024
Energy TechnologiesBack to top ↑
Research
#130 WorldPapers published, 2015–2024
Patents
#71 WorldInternational patent families, 2015–2024
Semiconductors & Advanced ComputingBack to top ↑
Research
#106 WorldPapers published, 2015–2024
No research topic: Semiconductor Design & EDA · Advanced Semiconductor Fabrication · Semiconductor Equipment & Materials · Advanced Packaging & Heterogeneous Integration
Patents
International patent families, 2015–2024
No international patent families on record for 2015–2024.
Artificial IntelligenceBack to top ↑
Research
#137 WorldPapers published, 2015–2024
Patents
#62 WorldInternational patent families, 2015–2024
Quantum TechnologiesBack to top ↑
Research
#106 WorldPapers published, 2015–2024
Patents
International patent families, 2015–2024
No international patent families on record for 2015–2024.
Connectivity, Cyber & Trust TechnologiesBack to top ↑
Research
#139 WorldPapers published, 2015–2024
Patents
#55 WorldInternational patent families, 2015–2024
Sensing, Timing & NavigationBack to top ↑
Research
#107 WorldPapers published, 2015–2024
Patents
#54 WorldInternational patent families, 2015–2024
Robotics & Autonomous SystemsBack to top ↑
Research
#113 WorldPapers published, 2015–2024
No research topic: Human-Machine Interfaces
Patents
#67 WorldInternational patent families, 2015–2024
Biotechnology & Health TechnologiesBack to top ↑
Research
#106 WorldPapers published, 2015–2024
Patents
#78 WorldInternational patent families, 2015–2024
Medicine and BioTech
Clinical research and life-science invention, drawn from the same series that drive the metric pages. Each card opens the full cross-country comparison.
Space TechnologiesBack to top ↑
Research
Papers published, 2015–2024
No papers on record for 2015–2024.
Patents
#53 WorldInternational patent families, 2015–2024
GINC Capability Domains · Chapter 05
Strategic Infrastructure
🇵🇦 Panama’s energy, connectivity and the material foundations of capability
Resource InfrastructureBack to top ↑
0 bbl/day (2012 est.)
0 bbl/day (2010 est.)
0 bbl/day (2010 est.)
0 bbl (1 January 2010 est.)
0 bbl/day (2010 est.)
98,890 bbl/day (2011 est.)
0 bbl/day (2010 est.)
111,100 bbl/day (2010 est.)
0 cu m (2011 est.)
0 cu m (2010 est.)
0 cu m (2011 est.)
0 cu m (2011 est.)
0 cu m (1 January 2013 est.)
oil 128 km (2013)
Agriculture & Food InfrastructureBack to top ↑
- Irrigation & Agricultural Water
- Livestock & Veterinary
- Fisheries & Aquaculture
- Storage, Cold Chain & Markets
Energy InfrastructureBack to top ↑
- Thermal Generation
- Nuclear Generation
- Nuclear Fuel Cycle & Radioactive Waste
- Hydropower
- Renewable Generation
- Transmission & Distribution
- System Control & Dispatch
- Storage & Fuel Supply
1.976 million kW (2010 est.)
7.257 billion kWh (2010 est.)
6.209 billion kWh (2010 est.)
39 million kWh (2010 est.)
72 million kWh (2011 est.)
52.6% of total installed capacity (2010 est.)
0% of total installed capacity (2010 est.)
47.4% of total installed capacity (2010 est.)
0% of total installed capacity (2010 est.)
15.9 million Mt (2011 est.)
Water, Sanitation & Waste InfrastructureBack to top ↑
- Dams, Reservoirs & Flood Defence
- Water Supply & Treatment
- Bulk Water Transfer & Desalination
- Wastewater & Sanitation
- Solid Waste & Recycling
Advanced ManufacturingBack to top ↑
- Materials & Inputs
- Chemicals & Hazardous Process Industry
- Production Systems
- Supply Chain & Ecosystem
- Workforce & Innovation
Transport InfrastructureBack to top ↑
- Seaports & Terminals
- Air Infrastructure
- Air Navigation & Traffic Management
- Inland Waterways & Ferries
- Rail Infrastructure
- Roads & Bridges
- Logistics, Multimodal & Border Infrastructure
- Postal & Parcel
117 (2013)
3 (2013)
800 km (includes the 82-km Panama Canal that is being widened) (2011)
Communications & Digital InfrastructureBack to top ↑
- Subsea Cables & International Gateways
- Core & Backbone Networks
- Mobile & Wireless Networks
- Spectrum & Broadcasting
- Data Centres, Compute & Cloud
- Data Resources
- AI Tools & Applications
640,000 (2012)
6.77 million (2012)
959,800 (2009)
11,022 (2012)
.pa
Financial InfrastructureBack to top ↑
- Currency & Reserves
- Payments & Settlement Systems
- Markets, Exchanges & Depositories
- Banks, Insurers & Systemic Institutions
Social InfrastructureBack to top ↑
- Health Infrastructure
- Public Health & Laboratories
- Medical Supply & Stockpiles
- Education & Skills Infrastructure
- Research & Scientific Facilities
- Housing, Community & Social Services
- Government & Public Administration
- Cultural, Community & Recreational Infrastructure
- Justice & Corrections
- Emergency Services & Civil Protection
- Hydrometeorology & Early Warning
Space, Aerospace & Defence InfrastructureBack to top ↑
GINC Capability Domains · Chapter 06
National Security
🇵🇦 Panama’s force, intelligence and the defence of the nation
Disputes and terrorismBack to top ↑
organized illegal narcotics operations in Colombia operate within the remote border region with Panama
Force Generation & MobilisationBack to top ↑
no regular military forces; Panamanian Public Security Forces (subordinate to the Ministry of Public Security), comprising the National Police (PNP), National Air-Naval Service (SENAN), National Border Service (SENAFRONT) (2013)
on 10 February 1990, the government of then President ENDARA abolished Panama's military and reformed the security apparatus by creating the Panamanian Public Forces; in October 1994, Panama's Legislative Assembly approved a constitutional amendment prohibiting the creation of a standing military force but allowing the temporary establishment of special police units to counter acts of "external aggression"
Forces under arms
Active-duty strength on the Correlates of War series, which reaches back to 1816 and so carries a nation’s whole record of mobilisation rather than its present establishment. The card opens the full cross-country comparison.
Intelligence & AssessmentBack to top ↑
- Imagery & Geospatial Intelligence
- Signals & Cyber Intelligence
- Technical & Measurement Intelligence
- Open-Source & Financial Intelligence
- Human Intelligence & Counterintelligence
- All-Source Analysis & Warning
Joint Command, Projection & SustainmentBack to top ↑
- Command, Control & Communications
- Strategic Lift & Mobility
- Expeditionary & Peace Operations
- Operational Sustainment & War Reserves
- Defence Industrial Mobilisation
- CBRN Defence
Land PowerBack to top ↑
- Combined Arms Manoeuvre
- Land Fires
- Battlefield Aviation & Uncrewed Systems
- Special Operations & Irregular Warfare
Maritime PowerBack to top ↑
- Maritime Security & Constabulary
- Sea Denial & Undersea Warfare
- Sea Control
- Amphibious & Expeditionary Operations
Air PowerBack to top ↑
- Air Sovereignty & Policing
- Control of the Air
- Air Strike & Interdiction
- Airborne ISR, Early Warning & Battle Management
Strategic Strike & Missile DefenceBack to top ↑
Space OperationsBack to top ↑
Cyber & Electromagnetic OperationsBack to top ↑
Nuclear DeterrenceBack to top ↑
GINC Capability Domains · Chapter 07
Human Capital
🇵🇦 Panama’s population, health and the skills that sustain capability
DemographyBack to top ↑
3,608,431 (July 2014 est.)
Panama is a country of demographic and economic contrasts. It is in the midst of a demographic transition, characterized by steadily declining rates of fertility, mortality, and population growth, but disparities persist based on wealth, geography, and ethnicity. Panama has one of the fastest growing economies in Latin America and dedicates substantial funding to social programs, yet poverty and inequality remain prevalent. The indigenous population accounts for a growing share of Panama's poor and extreme poor, while the non-indigenous rural poor have been more successful at rising out of poverty through rural-to-urban labor migration. The government's large expenditures on untargeted, indirect subsidies for water, electricity, and fuel have been ineffective, but its conditional cash transfer program has shown some promise in helping to decrease extreme poverty among the indigenous population.//Panama has expanded access to education and clean water, but the availability of sanitation and, to a lesser extent, electricity remains poor. The increase in secondary schooling - led by female enrollment - is spreading to rural and indigenous areas, which probably will help to alleviate poverty if educational quality and the availability of skilled jobs improve. Inadequate access to sanitation contributes to a high incidence of diarrhea in Panama's children, which is one of the main causes of Panama's elevated chronic malnutrition rate, especially among indigenous communities.
1.35% (2014 est.)
18.61 births/1,000 population (2014 est.)
4.77 deaths/1,000 population (2014 est.)
2.38 children born/woman (2014 est.)
52.2% (2009)
Migration and urbanisationBack to top ↑
-0.32 migrant(s)/1,000 population (2014 est.)
PANAMA CITY (capital) 1.426 million (2011)
Welfare and equityBack to top ↑
26% (2012 est.)
51.9 (2010 est.)//56.1 (2003)
DisplacementBack to top ↑
Early Childhood DevelopmentBack to top ↑
3.9% (2008)
Foundational EducationBack to top ↑
3.5% of GDP (2011)
Advanced EducationBack to top ↑
Technical & Vocational SkillsBack to top ↑
Digital & AI CompetenceBack to top ↑
Generative AI adoption
Modelled share of working-age adults using generative AI, from Microsoft telemetry scaled to each country’s 15–64 population. A measure of how fast a workforce is absorbing the technology rather than of how much of it a nation builds. The card opens the full cross-country comparison.
Lifelong Learning & ReskillingBack to top ↑
Research Talent & Knowledge CreationBack to top ↑
Population HealthBack to top ↑
92 deaths/100,000 live births (2010)
25.4% (2008)
0.7% (2012 est.)
16,700 (2012 est.)
600 (2012 est.)
Health System CapabilityBack to top ↑
8.2% of GDP (2011)
1.5 physicians/1,000 population (2000)
2.4 beds/1,000 population (2010)
GINC Capability Domains · Chapter 08
Governance and Integrity
🇵🇦 Panama’s institutions, law and the integrity of the state
State structureBack to top ↑
constitutional democracy
10 provinces (provincias, singular - provincia) and 3 indigenous territories* (comarcas); Bocas del Toro, Chiriqui, Cocle, Colon, Darien, Embera-Wounaan*, Herrera, Kuna Yala*, Los Santos, Ngobe-Bugle*, Panama, Panama Oeste, Veraguas
several previous; latest effective 11 October 1972; amended several times, last in 2004 (2010)
18 years of age; universal and compulsory
Political Institutions & Civic ParticipationBack to top ↑
- Electoral Management & Integrity
- Legislature & Deliberative Institutions
- Citizen Participation & Civic Space
unicameral National Assembly or Asamblea Nacional (71 seats; members elected by popular vote to serve five-year terms)
Democratic Change or CD [Ricardo MARTINELLI Berrocal]//Democratic Revolutionary Party or PRD [Juan Carlos NAVARRO Quelquejeu]//Nationalist Republican Liberal Movement or MOLIRENA [Sergio GONZALEZ-Ruiz]//Panamenista Party [Juan Carlos VARELA Rodriguez] (formerly the Arnulfista Party)//Popular Party or PP [Milton HENRIQUEZ] (formerly Christian Democratic Party or PDC)
Chamber of Commerce//Concertacion Nacional (mechanism for government of Panama to formally dialogue with representatives of civil society)//National Council of Organized Workers or CONATO//National Council of Private Enterprise or CONEP//National Union of Construction and Similar Workers (SUNTRACS)//Panamanian Association of Business Executives or APEDE//Panamanian Industrialists Society or SIP//Workers Confederation of the Republic of Panama or CTRP
Justice System & Fundamental RightsBack to top ↑
- Judicial Independence & Court Capability
- Access to Justice & Legal Services
- Fundamental Rights Protection
- Human Rights Institutions & Equality Bodies
civil law system; judicial review of legislative acts in the Supreme Court of Justice
accepts compulsory ICJ jurisdiction with reservations; accepts ICCt jurisdiction
Internal Security & OrderBack to top ↑
major cocaine transshipment point and primary money-laundering center for narcotics revenue; money-laundering activity is especially heavy in the Colon Free Zone; offshore financial center; negligible signs of coca cultivation; monitoring of financial transactions is improving; official corruption remains a major problem
Regulatory Governance & Strategic ControlsBack to top ↑
- Regulatory Quality & Better Regulation
- Regulatory Delivery & Independent Regulators
- Strategic Controls & Economic Security Administration
Government Effectiveness & Public AdministrationBack to top ↑
- Centre of Government & Policy Coordination
- Civil Service & Public Workforce
- Digital Government & Service Delivery
- Legal Identity & Civil Registration
- Statistical & Data Capability
Public Integrity & Anti-CorruptionBack to top ↑
Transparency, Oversight & AccountabilityBack to top ↑
- Right to Information & Open Government
- Independent Oversight & Supreme Audit
- Independent Media & Journalist Safety
National Resilience & Crisis ManagementBack to top ↑
GINC Capability Domains · Chapter 09
Information and Influence
🇵🇦 Panama’s identity, media and the projection of influence
Identity and cultureBack to top ↑
Spanish (official), English 14%
Roman Catholic 85%, Protestant 15%
mestizo (mixed Amerindian and white) 70%, Amerindian and mixed (West Indian) 14%, white 10%, Amerindian 6%
harpy eagle
divided into four, equal rectangles; the top quadrants are white (hoist side) with a blue five-pointed star in the center and plain red; the bottom quadrants are plain blue (hoist side) and white with a red five-pointed star in the center; the blue and red colors are those of the main political parties (Conservatives and Liberals respectively) and the white denotes peace between them; the blue star stands for the civic virtues of purity and honesty, the red star signifies authority and law
Diplomatic Statecraft & Global NetworksBack to top ↑
- Diplomatic Network & Consular Reach
- Multilateral Leadership & Norm Setting
- Agenda-Setting & Convening
- Mediation & Crisis Diplomacy
BCIE, CAN (observer), CD, CELAC, CSN (observer), FAO, G-77, IADB, IAEA, IBRD, ICAO, ICC (national committees), ICRM, IDA, IFAD, IFC, IFRCS, ILO, IMF, IMO, IMSO, Interpol, IOC, IOM, IPU, ISO, ITSO, ITU, ITUC (NGOs), LAES, LAIA, MIGA, NAM, OAS, OPANAL, OPCW, Pacific Alliance (observer), PCA, SICA, UN, UNASUR (observer), UNCTAD, UNESCO, UNIDO, Union Latina, UNWTO, UPU, WCO, WFTU (NGOs), WHO, WIPO, WMO, WTO
Alliances & Security CooperationBack to top ↑
Development Cooperation & Global AssistanceBack to top ↑
Culture, Language & Education DiplomacyBack to top ↑
- Cultural & Language Institutes
- Creative Industries & Cultural Export Reach
- Heritage & Cultural Institutions
- Education Diplomacy & Alumni Networks
- Sports & Major Events
Diaspora & Global CommunitiesBack to top ↑
Information Environment & Strategic CommunicationBack to top ↑
- Strategic Communications & Public Diplomacy
- International Media & Broadcasting
- Information Defence & Counter-Interference
multiple privately owned TV networks and a government-owned educational TV station; multi-channel cable and satellite TV subscription services are available; more than 100 commercial radio stations (2007)
GINC Capability Domains · Chapter 10
Financial Strength
🇵🇦 Panama’s fiscal depth, reserves and the capacity to act
Monetary & Currency CapabilityBack to top ↑
- Monetary Policy & Price Stability
- Exchange Rate & External Account Management
- Currency Issuance & Digital Money
4.1% (2013 est.)//5.7% (2012 est.)
balboas (PAB) per US dollar -//1 (2013 est.)//1 (2012 est.)//1 (2010 est.)//1 (2009)//1 (2008)
NA% (31 December 2013 est.)//6.91% (31 December 2012 est.)
$8.976 billion (31 December 2013 est.)//$7.659 billion (31 December 2012 est.)
$29.72 billion (31 December 2012 est.)//$25.73 billion (31 December 2011 est.)
Fiscal Capacity & Public FinanceBack to top ↑
- Revenue Mobilisation & Tax Administration
- Public Expenditure & Budget Management
- Sovereign Debt & Treasury Management
- Public Investment Management
25.4% of GDP (2013 est.)
-2.6% of GDP (2013 est.)
39.8% of GDP (2013 est.)//39.6% of GDP (2012 est.)
calendar year
Financial System Depth & AccessBack to top ↑
- Banking System Capacity
- Capital Markets Depth & Development
- Long-Term & Institutional Capital
- Financial Inclusion & Household Access
- Development & Policy Finance
$35.57 billion (31 December 2013 est.)//$32.27 billion (31 December 2012 est.)
$12.54 billion (31 December 2012 est.)//$10.68 billion (31 December 2011)//$8.348 billion (31 December 2010 est.)
Financial Regulation & IntegrityBack to top ↑
- Prudential Regulation & Supervision
- Financial Integrity & Illicit Finance Control
- Market Conduct & Consumer Protection
- Payment & Market Infrastructure Oversight
Financial Stability & Crisis ManagementBack to top ↑
- Macroprudential & Systemic Oversight
- Crisis Management, Resolution & Deposit Insurance
- External Liquidity & Financial Safety Nets
Sovereign Capital & External Financial PowerBack to top ↑
- Official Reserves Management
- Sovereign Wealth & Public Asset Management
- Currency Internationalisation & Reserve Status
- Capital Account & Flow Management
- International Financial Centre Capability
$2.666 billion (31 December 2013 est.)//$2.466 billion (31 December 2012 est.)
$15.22 billion (31 December 2013 est.)//$13.56 billion (31 December 2012 est.)
GINC Capability Domains · Chapter 11
Production and Innovation
🇵🇦 Panama’s output, industry and the engine of prosperity
Economic Output & ProductivityBack to top ↑
Panama's dollar-based economy rests primarily on a well-developed services sector that accounts for more than three-quarters of GDP. Services include operating the Panama Canal, logistics, banking, the Colon Free Zone, insurance, container ports, flagship registry, and tourism. Economic growth will be bolstered by the Panama Canal expansion project that began in 2007 and is estimated to be completed by 2015 at a cost of $5.3 billion - about 10-15% of current GDP. The expansion project will more than double the Canal's capacity, enabling it to accommodate ships that are too large to traverse the existing canal. The United States and China are the top users of the Canal. Panama is also constructing a metro system in Panama City, valued at $1.2 billion and scheduled to be completed by 2014. Panama's booming transportation and logistics services sectors, along with aggressive infrastructure development projects, have lead the economy to continued high growth in 2012. Foreign investment, at around 10% of GDP in both 2011 and 2012, has continued to be a source of growth. Strong economic performance has not translated into broadly shared prosperity, as Panama has the second worst income distribution in Latin America. About one-fourth of the population lives in poverty; however, from 2006 to 2012 poverty was reduced by 10 percentage points, while unemployment dropped from 12% to 4.5% of the labor force in 2013. The US-Panama Trade Promotion Agreement was approved by Congress and signed into law in October 2011, and entered into force in October 2012. Panama also achieved removal from the Organization of Economic Development's gray-list of tax havens by signing various double taxation treaties with other nations.
$61.54 billion (2013 est.)//$57.24 billion (2012 est.)//$51.72 billion (2011 est.)
7.5% (2013 est.)//10.7% (2012 est.)//10.8% (2011 est.)
$16,500 (2013 est.)//$15,700 (2012 est.)//$14,400 (2011 est.)
$40.62 billion (2013 est.)
Labour & EmploymentBack to top ↑
- Employment & Labour Force Participation
- Labour Market Institutions & Wage Setting
- Employment Services & Skills Matching
- Labour Adjustment, Transition & Formalisation
1.54 million
4.5% (2013 est.)//4.4% (2012 est.)
Industrial & Sectoral BaseBack to top ↑
- Manufacturing & Advanced Industry
- Foundational & Process Industries
- Agrifood & Primary Production
- Services Economy
bananas, rice, corn, coffee, sugarcane, vegetables; livestock; shrimp
construction, brewing, cement and other construction materials, sugar milling
9.2% (2013 est.)
Structural Transformation & ComplexityBack to top ↑
Business Dynamism & EntrepreneurshipBack to top ↑
- Entrepreneurship & Firm Creation
- Risk Capital & Scale-Up Finance
- Firm Growth, Exit & Renewal
- Competition & Market Contestability
Innovation & CommercialisationBack to top ↑
- Business Innovation Capability
- Research Commercialisation & Knowledge Transfer
- Intellectual Property & Intangible Assets
- Innovation Ecosystems & Clusters
Technology Adoption & DiffusionBack to top ↑
GINC Capability Domains · Chapter 12
Trade and Investment
🇵🇦 Panama’s markets, capital and the terms of global exchange
Overall tradeBack to top ↑
$3.83B of exports to 147 partners and $37.9B of imports from 122 in 2024, a deficit of $34.0B.
- Exports
- $3.83B147 partners
- Imports
- $37.9B122 partners
- Balance
- −$34.0Bdeficit
- Total trade
- $41.7B2024
ExportsBack to top ↑
Where its exports go
The largest partners in 2024, with each one's share of the nation's exports.
| Partner | Value | Share | |
|---|---|---|---|
| United States | $444M | 12% | |
| Costa Rica | $382M | 10.0% | |
| Netherlands | $224M | 5.9% | |
| Denmark | $223M | 5.8% | |
| Thailand | $162M | 4.2% | |
| Turkey | $155M | 4.0% | |
| South Korea | $149M | 3.9% | |
| Guatemala | $130M | 3.4% | |
| Ecuador | $122M | 3.2% | |
| Dominican Republic | $113M | 2.9% | |
| Taiwan | $104M | 2.7% | |
| Germany | $95.6M | 2.5% | |
| Japan | $82.6M | 2.2% | |
| China | $81.0M | 2.1% | |
| India | $77.5M | 2.0% | |
| Guyana | $68.3M | 1.8% | |
| Peru | $61.5M | 1.6% | |
| Switzerland | $61.3M | 1.6% | |
| Chile | $59.3M | 1.5% | |
| Norway | $56.3M | 1.5% |
What it exports
The largest categories in 2024.
| Category | Value | Share | |
|---|---|---|---|
| Ships, boats, and other floating structures | $697M | 18% | |
| Edible fruits, nuts, peel of citrus fruit, melons | $333M | 8.7% | |
| Fish, crustaceans, molluscs, aquatics invertebrates | $280M | 7.3% | |
| Mineral fuels, oils, distillation products | $279M | 7.3% | |
| Pearls, precious stones, metals, coins | $204M | 5.3% | |
| Pharmaceutical products | $198M | 5.2% | |
| Electrical, electronic equipment | $180M | 4.7% | |
| Animal, vegetable fats and oils, cleavage products | $143M | 3.7% | |
| Machinery, nuclear reactors, boilers | $142M | 3.7% | |
| Aluminum | $107M | 2.8% | |
| Iron and steel | $91.4M | 2.4% | |
| Beverages, spirits and vinegar | $77.2M | 2.0% | |
| Plastics | $60.0M | 1.6% | |
| Wood and articles of wood, wood charcoal | $50.3M | 1.3% | |
| Sugars and sugar confectionery | $49.3M | 1.3% |
ImportsBack to top ↑
Where its imports come from
The largest partners in 2024, with each one's share of the nation's imports.
| Partner | Value | Share | |
|---|---|---|---|
| China | $5.90B | 16% | |
| Ecuador | $5.66B | 15% | |
| United States | $4.61B | 12% | |
| Japan | $4.35B | 11% | |
| Colombia | $4.30B | 11% | |
| Guyana | $2.54B | 6.7% | |
| Spain | $2.17B | 5.7% | |
| South Korea | $1.32B | 3.5% | |
| Brazil | $902M | 2.4% | |
| Mexico | $678M | 1.8% | |
| Peru | $611M | 1.6% | |
| Costa Rica | $546M | 1.4% | |
| Guatemala | $318M | 0.8% | |
| Germany | $314M | 0.8% | |
| Italy | $269M | 0.7% | |
| Turkey | $230M | 0.6% | |
| France | $216M | 0.6% | |
| Argentina | $210M | 0.6% | |
| India | $208M | 0.6% | |
| Canada | $193M | 0.5% |
What it imports
The largest categories in 2024.
| Category | Value | Share | |
|---|---|---|---|
| Mineral fuels, oils, distillation products | $15.6B | 41% | |
| Ships, boats, and other floating structures | $7.61B | 20% | |
| Organic chemicals | $2.08B | 5.5% | |
| Machinery, nuclear reactors, boilers | $1.61B | 4.3% | |
| Electrical, electronic equipment | $1.33B | 3.5% | |
| Vehicles other than railway, tramway | $1.28B | 3.4% | |
| Pharmaceutical products | $839M | 2.2% | |
| Plastics | $520M | 1.4% | |
| Optical, photo, technical, medical apparatus | $343M | 0.9% | |
| Beverages, spirits and vinegar | $332M | 0.9% | |
| Articles of iron or steel | $308M | 0.8% | |
| Paper and paperboard, articles of pulp, paper and board | $297M | 0.8% | |
| Essential oils, perfumes, cosmetics, toiletries | $287M | 0.8% | |
| Residues, wastes of food industry, animal fodder | $284M | 0.7% | |
| Miscellaneous edible preparations | $276M | 0.7% |
In a list, the bar runs to the largest in that list. The line is each figure’s history from 2000, drawn to its own peak: it shows the shape of the years, and the value shows the size.
External balanceBack to top ↑
-$5.064 billion (2013 est.)//-$3.267 billion (2012 est.)
Trade Facilitation & LogisticsBack to top ↑
Trade Policy & Market AccessBack to top ↑
- Trade Policy & Negotiation Capability
- Market Access & Agreements Network
- Trade Law & Enforcement
- Standards, Conformity & Quality Infrastructure
Digital & Services TradeBack to top ↑
- Services Trade Capability
- Digital Trade & E-Commerce
- Data Flows & Digital Trade Governance
- Tourism & Visitor Economy
Investment Attraction & ProjectionBack to top ↑
- Investment Attraction & Facilitation
- Investment Absorption & Linkages
- Outward Investment & Global Corporate Presence
$32.89 billion (31 December 2013 est.)//$29.27 billion (31 December 2012 est.)
$3.233 billion (31 December 2013 est.)//$3.11 billion (31 December 2012 est.)
Export Capability & SophisticationBack to top ↑
$18.87 billion (2013 est.)//$18.88 billion (2012 est.)
US 20.2%, Canada 14.6%, Costa Rica 6.6%, Netherlands 5.9%, Sweden 4.8%, China 4.1%, Italy 4% (2012)
gold, bananas, shrimp, sugar, iron and steel waste, pineapples, watermelons
Global Value Chain PositionBack to top ↑
- Value Chain Participation & Integration
- Value Chain Position & Upgrading
- Regional Integration & Hub Anchoring
Economic Leverage & DependenceBack to top ↑
- Strategic Supply Security
- Concentration Risk & Revenue Stabilisation
- Economic Leverage & Coercion Resistance
$26.61 billion (2013 est.)//$24.61 billion (2012 est.)
US 23.6%, China 6.4%, Costa Rica 4.6%, Mexico 4.4% (2012)
fuel products, medicines, vehicles, iron and steel rods, cellular phones
Panama · you are in
Historical Context
Foundations
GINC Capability Domains
Find in this brief · Panama