
Peru
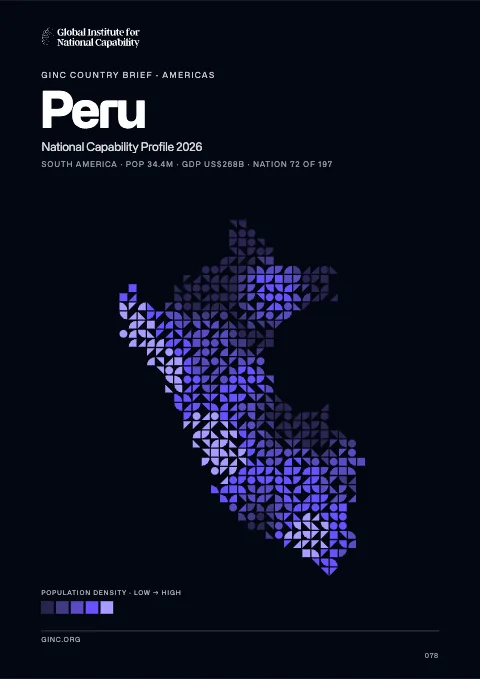
Peru is a constitutional republic in South America, home to 30 million people, with its capital at Lima, and the world’s 20th-largest country by area.
Contents
12 chapters
Foundations
01–03
At a glance
- Area
- 1.3Mkm²#20 World#3 S. America
- Population
- 30.1M#42 World#4 S. America
- GDP (market)
- $210B
- GDP (PPP)
- $344B#39 World#5 S. America
- GDP per capita
- $11.1K#112 World#9 S. America
The whole brief
Peru National Capability Profile 2026
Foundations · Chapter 01
Historical Context
🇵🇪 Peru’s understanding the origins and evolution of the modern nation
BackgroundBack to top ↑
Ancient Peru was the seat of several prominent Andean civilizations, most notably that of the Incas whose empire was captured by Spanish conquistadors in 1533. Peruvian independence was declared in 1821, and remaining Spanish forces were defeated in 1824. After a dozen years of military rule, Peru returned to democratic leadership in 1980, but experienced economic problems and the growth of a violent insurgency. President Alberto FUJIMORI's election in 1990 ushered in a decade that saw a dramatic turnaround in the economy and significant progress in curtailing guerrilla activity. Nevertheless, the president's increasing reliance on authoritarian measures and an economic slump in the late 1990s generated mounting dissatisfaction with his regime, which led to his resignation in 2000. A caretaker government oversaw new elections in the spring of 2001, which installed Alejandro TOLEDO Manrique as the new head of government - Peru's first democratically elected president of indigenous ethnicity. The presidential election of 2006 saw the return of Alan GARCIA Perez who, after a disappointing presidential term from 1985 to 1990, oversaw a robust economic rebound. In June 2011, former army officer Ollanta HUMALA Tasso was elected president, defeating Keiko FUJIMORI Higuchi, the daughter of Alberto FUJIMORI. Since his election, HUMALA has carried on the sound, market-oriented economic policies of the three preceding administrations.
IndependenceBack to top ↑
28 July 1821 (from Spain)
National holidayBack to top ↑
Independence Day, 28 July (1821)
Foundations · Chapter 02
Geography
🇵🇪 Peru’s territory, resources and strategic position
Location and areaBack to top ↑
Western South America, bordering the South Pacific Ocean, between Chile and Ecuador
10 00 S, 76 00 W
South America
slightly smaller than Alaska
2,414 km
Terrain and resourcesBack to top ↑
western coastal plain (costa), high and rugged Andes in center (sierra), eastern lowland jungle of Amazon Basin (selva)
copper, silver, gold, petroleum, timber, fish, iron ore, coal, phosphate, potash, hydropower, natural gas
11,960 sq km (2003)
Settlement and hazardsBack to top ↑
earthquakes, tsunamis, flooding, landslides, mild volcanic activity
shares control of Lago Titicaca, world's highest navigable lake, with Bolivia; a remote slope of Nevado Mismi, a 5,316 m peak, is the ultimate source of the Amazon River
OtherBack to top ↑
1,913 cu km (2011)
deforestation (some the result of illegal logging); overgrazing of the slopes of the costa and sierra leading to soil erosion; desertification; air pollution in Lima; pollution of rivers and coastal waters from municipal and mining wastes
Foundations · Chapter 03
Environment
🇵🇪 Peru’s environmental conditions, resources and national resilience
ClimateBack to top ↑
varies from tropical in east to dry desert in west; temperate to frigid in Andes
Emissions and pollutionBack to top ↑
Water, waste and foodBack to top ↑
Resources and agreementsBack to top ↑
GINC Capability Domains · Chapter 04
Critical Technology
🇵🇪 Peru’s technology frontiers and the pursuit of national advantage
Two counts are set side by side for 2015–2024: on the left, the papers researchers in Peru published; on the right, the patent families that began there and were filed in more than one country. First by capability group, then group by group with each group’s capabilities. The badge on a card is the nation’s place among all nations. Papers are from GINC Research Analytics, patent families from GINC Patents.
Research by capability group
#75 WorldPapers published, 2015–2024
718
397
222
114
113
87
49
26
25
13
Patents by capability group
#70 WorldInternational patent families, 2015–2024
Advanced Materials & ManufacturingBack to top ↑
Research
#89 WorldPapers published, 2015–2024
Patents
#67 WorldInternational patent families, 2015–2024
Energy TechnologiesBack to top ↑
Research
#93 WorldPapers published, 2015–2024
Patents
#67 WorldInternational patent families, 2015–2024
Semiconductors & Advanced ComputingBack to top ↑
Research
#85 WorldPapers published, 2015–2024
No research topic: Semiconductor Design & EDA · Advanced Semiconductor Fabrication · Semiconductor Equipment & Materials · Advanced Packaging & Heterogeneous Integration
Patents
#61 WorldInternational patent families, 2015–2024
Artificial IntelligenceBack to top ↑
Research
#68 WorldPapers published, 2015–2024
Patents
#74 WorldInternational patent families, 2015–2024
Quantum TechnologiesBack to top ↑
Research
#84 WorldPapers published, 2015–2024
Patents
International patent families, 2015–2024
No international patent families on record for 2015–2024.
Connectivity, Cyber & Trust TechnologiesBack to top ↑
Research
#81 WorldPapers published, 2015–2024
Patents
#74 WorldInternational patent families, 2015–2024
Sensing, Timing & NavigationBack to top ↑
Research
#65 WorldPapers published, 2015–2024
Patents
International patent families, 2015–2024
No international patent families on record for 2015–2024.
Robotics & Autonomous SystemsBack to top ↑
Research
#72 WorldPapers published, 2015–2024
No research topic: Human-Machine Interfaces
Patents
#62 WorldInternational patent families, 2015–2024
Biotechnology & Health TechnologiesBack to top ↑
Research
#58 WorldPapers published, 2015–2024
Patents
#52 WorldInternational patent families, 2015–2024
Medicine and BioTech
Clinical research and life-science invention, drawn from the same series that drive the metric pages. Each card opens the full cross-country comparison.
Space TechnologiesBack to top ↑
Research
#47 WorldPapers published, 2015–2024
Patents
International patent families, 2015–2024
No international patent families on record for 2015–2024.
GINC Capability Domains · Chapter 05
Strategic Infrastructure
🇵🇪 Peru’s energy, connectivity and the material foundations of capability
Resource InfrastructureBack to top ↑
160,400 bbl/day (2012 est.)
15,610 bbl/day (2012 est.)
99,590 bbl/day (2012 est.)
579.2 million bbl (1 January 2013 est.)
159,500 bbl/day (2012 est.)
206,900 bbl/day (2012 est.)
82,080 bbl/day (2012 est.)
43,480 bbl/day (2012 est.)
32.4 billion cu m (2012)
5.49 billion cu m (2010 est.)
8.73 billion cu m (2012 est.)
0 cu m (2012)
359.6 billion cu m (1 January 2013 est.)
extra heavy crude 786 km; gas 1,526 km; liquid petroleum gas 679 km; oil 1,033 km; refined products 15 km (2013)
Agriculture & Food InfrastructureBack to top ↑
- Irrigation & Agricultural Water
- Livestock & Veterinary
- Fisheries & Aquaculture
- Storage, Cold Chain & Markets
Energy InfrastructureBack to top ↑
- Thermal Generation
- Nuclear Generation
- Nuclear Fuel Cycle & Radioactive Waste
- Hydropower
- Renewable Generation
- Transmission & Distribution
- System Control & Dispatch
- Storage & Fuel Supply
8.613 million kW (2010 est.)
38.4 billion kWh (2012 est.)
34.25 billion kWh (2011 est.)
112 million kWh (2010 est.)
0 kWh (2012 est.)
60.1% of total installed capacity (2010 est.)
0% of total installed capacity (2010 est.)
39.9% of total installed capacity (2010 est.)
0% of total installed capacity (2010 est.)
37.71 million Mt (2011 est.)
Water, Sanitation & Waste InfrastructureBack to top ↑
- Dams, Reservoirs & Flood Defence
- Water Supply & Treatment
- Bulk Water Transfer & Desalination
- Wastewater & Sanitation
- Solid Waste & Recycling
Advanced ManufacturingBack to top ↑
- Materials & Inputs
- Chemicals & Hazardous Process Industry
- Production Systems
- Supply Chain & Ecosystem
- Workforce & Innovation
Transport InfrastructureBack to top ↑
- Seaports & Terminals
- Air Infrastructure
- Air Navigation & Traffic Management
- Inland Waterways & Ferries
- Rail Infrastructure
- Roads & Bridges
- Logistics, Multimodal & Border Infrastructure
- Postal & Parcel
191 (2013)
5 (2013)
8,808 km (there are 8,600 km of navigable tributaries on the Amazon system and 208 km on Lago Titicaca) (2011)
Communications & Digital InfrastructureBack to top ↑
- Subsea Cables & International Gateways
- Core & Backbone Networks
- Mobile & Wireless Networks
- Spectrum & Broadcasting
- Data Centres, Compute & Cloud
- Data Resources
- AI Tools & Applications
3.42 million (2012)
29.4 million (2012)
9.158 million (2009)
234,102 (2012)
.pe
Financial InfrastructureBack to top ↑
- Currency & Reserves
- Payments & Settlement Systems
- Markets, Exchanges & Depositories
- Banks, Insurers & Systemic Institutions
Social InfrastructureBack to top ↑
- Health Infrastructure
- Public Health & Laboratories
- Medical Supply & Stockpiles
- Education & Skills Infrastructure
- Research & Scientific Facilities
- Housing, Community & Social Services
- Government & Public Administration
- Cultural, Community & Recreational Infrastructure
- Justice & Corrections
- Emergency Services & Civil Protection
- Hydrometeorology & Early Warning
Space, Aerospace & Defence InfrastructureBack to top ↑
GINC Capability Domains · Chapter 06
National Security
🇵🇪 Peru’s force, intelligence and the defence of the nation
Disputes and terrorismBack to top ↑
Chile and Ecuador rejected Peru's November 2005 unilateral legislation to shift the axis of their joint treaty-defined maritime boundaries along the parallels of latitude to equidistance lines which favor Peru; organized illegal narcotics operations in Colombia have penetrated Peru's shared border; Peru rejects Bolivia's claim to restore maritime access through a sovereign corridor through Chile along the Peruvian border
Force Generation & MobilisationBack to top ↑
Peruvian Army (Ejercito Peruano), Peruvian Navy (Marina de Guerra del Peru, MGP; includes naval air, naval infantry, and Coast Guard), Air Force of Peru (Fuerza Aerea del Peru, FAP) (2013)
18-50 years of age for male and 18-45 years of age for female voluntary military service; no conscription (2012)
1.28% of GDP (2012)//1.15% of GDP (2011)//1.28% of GDP (2010)
Forces under arms
Active-duty strength on the Correlates of War series, which reaches back to 1816 and so carries a nation’s whole record of mobilisation rather than its present establishment. The card opens the full cross-country comparison.
Intelligence & AssessmentBack to top ↑
- Imagery & Geospatial Intelligence
- Signals & Cyber Intelligence
- Technical & Measurement Intelligence
- Open-Source & Financial Intelligence
- Human Intelligence & Counterintelligence
- All-Source Analysis & Warning
Joint Command, Projection & SustainmentBack to top ↑
- Command, Control & Communications
- Strategic Lift & Mobility
- Expeditionary & Peace Operations
- Operational Sustainment & War Reserves
- Defence Industrial Mobilisation
- CBRN Defence
Land PowerBack to top ↑
- Combined Arms Manoeuvre
- Land Fires
- Battlefield Aviation & Uncrewed Systems
- Special Operations & Irregular Warfare
Maritime PowerBack to top ↑
- Maritime Security & Constabulary
- Sea Denial & Undersea Warfare
- Sea Control
- Amphibious & Expeditionary Operations
Air PowerBack to top ↑
- Air Sovereignty & Policing
- Control of the Air
- Air Strike & Interdiction
- Airborne ISR, Early Warning & Battle Management
Strategic Strike & Missile DefenceBack to top ↑
Space OperationsBack to top ↑
Cyber & Electromagnetic OperationsBack to top ↑
Nuclear DeterrenceBack to top ↑
GINC Capability Domains · Chapter 07
Human Capital
🇵🇪 Peru’s population, health and the skills that sustain capability
DemographyBack to top ↑
30,147,935 (July 2014 est.)
Peru's urban and coastal communities have benefited much more from recent economic growth than rural, Afro-Peruvian, indigenous, and poor populations of the Amazon and mountain regions. The poverty rate has dropped substantially during the last decade but remains stubbornly high at about 30% (more than 55% in rural areas). After remaining almost static for about a decade, Peru's malnutrition rate began falling in 2005, when the government introduced a coordinated strategy focusing on hygiene, sanitation, and clean water. School enrollment has improved, but achievement scores reflect ongoing problems with educational quality. Many poor children temporarily or permanently drop out of school to help support their families. About a quarter to a third of Peruvian children aged 6 to 14 work, often putting in long hours at hazardous mining or construction sites.//Peru was a country of immigration in the 19th and early 20th centuries, but has become a country of emigration in the last few decades. Beginning in the 19th century, Peru brought in Asian contract laborers mainly to work on coastal plantations. Populations of Chinese and Japanese descent - among the largest in Latin America - are economically and culturally influential in Peru today. Peruvian emigration began rising in the 1980s due to an economic crisis and a violent internal conflict, but outflows have stabilized in the last few years as economic conditions have improved. Nonetheless, more than 2 million Peruvians have emigrated in the last decade, principally to the US, Spain, and Argentina.
0.99% (2014 est.)
18.57 births/1,000 population (2014 est.)
5.99 deaths/1,000 population (2014 est.)
2.22 children born/woman (2014 est.)
22.2
68.9% (2011)
Migration and urbanisationBack to top ↑
-2.69 migrant(s)/1,000 population (2014 est.)
LIMA (capital) 9.13 million; Arequipa 804,000 (2011)
Welfare and equityBack to top ↑
25.8% (2012 est.)
48.1 (2010)//51 (2005)
DisplacementBack to top ↑
Early Childhood DevelopmentBack to top ↑
4.5% (2008)
Foundational EducationBack to top ↑
2.8% of GDP (2012)
Advanced EducationBack to top ↑
Technical & Vocational SkillsBack to top ↑
Digital & AI CompetenceBack to top ↑
Generative AI adoption
Modelled share of working-age adults using generative AI, from Microsoft telemetry scaled to each country’s 15–64 population. A measure of how fast a workforce is absorbing the technology rather than of how much of it a nation builds. The card opens the full cross-country comparison.
Lifelong Learning & ReskillingBack to top ↑
Research Talent & Knowledge CreationBack to top ↑
Population HealthBack to top ↑
67 deaths/100,000 live births (2010)
15.7% (2008)
0.4% (2012 est.)
75,500 (2012 est.)
4,100 (2012 est.)
Health System CapabilityBack to top ↑
4.8% of GDP (2011)
0.92 physicians/1,000 population (2009)
1.5 beds/1,000 population (2011)
GINC Capability Domains · Chapter 08
Governance and Integrity
🇵🇪 Peru’s institutions, law and the integrity of the state
State structureBack to top ↑
constitutional republic
25 regions (regiones, singular - region) and 1 province* (provincia); Amazonas, Ancash, Apurimac, Arequipa, Ayacucho, Cajamarca, Callao, Cusco, Huancavelica, Huanuco, Ica, Junin, La Libertad, Lambayeque, Lima, Lima*, Loreto, Madre de Dios, Moquegua, Pasco, Piura, Puno, San Martin, Tacna, Tumbes, Ucayali
several previous; latest promulgated 29 December 1993, enacted 31 December 1993; amended several times, last in 2009 (2009)
18 years of age; universal and compulsory until the age of 70
Political Institutions & Civic ParticipationBack to top ↑
- Electoral Management & Integrity
- Legislature & Deliberative Institutions
- Citizen Participation & Civic Space
unicameral Congress of the Republic of Peru or Congreso de la Republica del Peru (130 seats; members are elected by popular vote to serve five-year terms)
Alliance for Progress (Alianza para el Progreso) or APP [Cesar ACUNA Peralta]//Fuerza Popular (formerly Fuerza 2011) [Keiko FUJIMORI Higuchi]//National Solidarity (Solidaridad Nacional) or SN [Luis CASTANEDA Lossio]//Peru Posible or PP (a coalition of Accion Popular and Somos Peru) [Alejandro TOLEDO Manrique]//Peruvian Aprista Party (Partido Aprista Peruano) or PAP [Alan GARCIA Perez] (also referred to by its original name Alianza Popular Revolucionaria Americana or APRA)//Peruvian Nationalist Party [Nadine HEREDIA Alarcon]//Popular Christian Party (Partido Popular Cristiano) or PPC [Lourdes FLORES Nano]//Wide Front (Frente Amplio), a coalition of left-of-center parties including Tierra y Libertad [Marco ARANA Zegarra], Ciudadanos por el Gran Cambio [Salomon LERNER Ghitis], and Fuerza Social [Susana VILLARAN de la Puente]
General Workers Confederation of Peru (Confederacion General de Trabajadores del Peru) or CGTP [Mario HUAMAN]//Shining Path (Sendero Luminoso) or SL [Abimael GUZMAN Reynoso (imprisoned), Victor QUISPE Palomino (top leader at-large)] (leftist guerrilla group)
Justice System & Fundamental RightsBack to top ↑
- Judicial Independence & Court Capability
- Access to Justice & Legal Services
- Fundamental Rights Protection
- Human Rights Institutions & Equality Bodies
civil law system
accepts compulsory ICJ jurisdiction with reservations; accepts ICCt jurisdiction
Internal Security & OrderBack to top ↑
until 1996 the world's largest coca leaf producer, Peru is now the world's second largest producer of coca leaf, though it lags far behind Colombia; cultivation of coca in Peru was estimated at 40,000 hectares in 2009, a slight decrease over 2008; second largest producer of cocaine, estimated at 225 metric tons of potential pure cocaine in 2009; finished cocaine is shipped out from Pacific ports to the international drug market; increasing amounts of base and finished cocaine, however, are being moved to Brazil, Chile, Argentina, and Bolivia for use in the Southern Cone or transshipment to Europe and Africa; increasing domestic drug consumption
Regulatory Governance & Strategic ControlsBack to top ↑
- Regulatory Quality & Better Regulation
- Regulatory Delivery & Independent Regulators
- Strategic Controls & Economic Security Administration
Government Effectiveness & Public AdministrationBack to top ↑
- Centre of Government & Policy Coordination
- Civil Service & Public Workforce
- Digital Government & Service Delivery
- Legal Identity & Civil Registration
- Statistical & Data Capability
Public Integrity & Anti-CorruptionBack to top ↑
Transparency, Oversight & AccountabilityBack to top ↑
- Right to Information & Open Government
- Independent Oversight & Supreme Audit
- Independent Media & Journalist Safety
National Resilience & Crisis ManagementBack to top ↑
GINC Capability Domains · Chapter 09
Information and Influence
🇵🇪 Peru’s identity, media and the projection of influence
Identity and cultureBack to top ↑
Spanish (official) 84.1%, Quechua (official) 13%, Aymara (official) 1.7%, Ashaninka 0.3%, other native languages (includes a large number of minor Amazonian languages) 0.7%, other (includes foreign languages and sign language) 0.2% (2007 est.)
Roman Catholic 81.3%, Evangelical 12.5%, other 3.3%, none 2.9% (2007 est.)
Amerindian 45%, mestizo (mixed Amerindian and white) 37%, white 15%, black, Japanese, Chinese, and other 3%
vicuna (a camelid related to the llama)
three equal, vertical bands of red (hoist side), white, and red with the coat of arms centered in the white band; the coat of arms features a shield bearing a vicuna (representing fauna), a cinchona tree (the source of quinine, signifying flora), and a yellow cornucopia spilling out coins (denoting mineral wealth); red recalls blood shed for independence, white symbolizes peace
Diplomatic Statecraft & Global NetworksBack to top ↑
- Diplomatic Network & Consular Reach
- Multilateral Leadership & Norm Setting
- Agenda-Setting & Convening
- Mediation & Crisis Diplomacy
APEC, BIS, CAN, CD, CELAC, EITI (compliant country), FAO, G-24, G-77, IADB, IAEA, IBRD, ICAO, ICC (NGOs), ICRM, IDA, IFAD, IFC, IFRCS, IHO, ILO, IMF, IMO, IMSO, Interpol, IOC, IOM, IPU, ISO, ITSO, ITU, ITUC (NGOs), LAES, LAIA, Mercosur (associate), MIGA, MINURSO, MINUSTAH, MONUSCO, NAM, OAS, OPANAL, OPCW, Pacific Alliance, PCA, SICA (observer), UN, UNASUR, UNCTAD, UNESCO, UNIDO, Union Latina, UNISFA, UNMIL, UNMISS, UNOCI, UNWTO, UPU, WCO, WFTU (NGOs), WHO, WIPO, WMO, WTO
Alliances & Security CooperationBack to top ↑
Development Cooperation & Global AssistanceBack to top ↑
Culture, Language & Education DiplomacyBack to top ↑
- Cultural & Language Institutes
- Creative Industries & Cultural Export Reach
- Heritage & Cultural Institutions
- Education Diplomacy & Alumni Networks
- Sports & Major Events
Diaspora & Global CommunitiesBack to top ↑
Information Environment & Strategic CommunicationBack to top ↑
- Strategic Communications & Public Diplomacy
- International Media & Broadcasting
- Information Defence & Counter-Interference
10 major TV networks of which only one, Television Nacional de Peru, is state-owned; multi-channel cable TV services are available; in excess of 2,000 radio stations including a substantial number of indigenous language stations (2010)
GINC Capability Domains · Chapter 10
Financial Strength
🇵🇪 Peru’s fiscal depth, reserves and the capacity to act
Monetary & Currency CapabilityBack to top ↑
- Monetary Policy & Price Stability
- Exchange Rate & External Account Management
- Currency Issuance & Digital Money
2.9% (2013 est.)//3.4% (2011 est.)
nuevo sol (PEN) per US dollar -//2.699 (2013 est.)//2.6376 (2012 est.)//2.8251 (2010 est.)//3.0115 (2009)//2.91 (2008)
5.05% (31 December 2012)//5.05% (31 December 2011)
20.3% (31 December 2013 est.)//19.23% (31 December 2012 est.)
$32.2 billion (31 December 2013 est.)//$32.61 billion (31 December 2012 est.)
$80.91 billion (31 December 2013 est.)//$77.62 billion (31 December 2012 est.)
Fiscal Capacity & Public FinanceBack to top ↑
- Revenue Mobilisation & Tax Administration
- Public Expenditure & Budget Management
- Sovereign Debt & Treasury Management
- Public Investment Management
29% of GDP (2013 est.)
1% of GDP (2013 est.)
14.9% of GDP (2013 est.)//16.6% of GDP (2012 est.)
calendar year
Financial System Depth & AccessBack to top ↑
- Banking System Capacity
- Capital Markets Depth & Development
- Long-Term & Institutional Capital
- Financial Inclusion & Household Access
- Development & Policy Finance
$37.96 billion (31 December 2013 est.)//$36.76 billion (31 December 2012 est.)
$NA (31 December 2012)//$121.6 billion (31 December 2011)//$160.9 billion (31 December 2010)
22.2% of GDP (2013 est.)//23.3% of GDP (2012 est.)//23.4% of GDP (2011 est.)
Financial Regulation & IntegrityBack to top ↑
- Prudential Regulation & Supervision
- Financial Integrity & Illicit Finance Control
- Market Conduct & Consumer Protection
- Payment & Market Infrastructure Oversight
Financial Stability & Crisis ManagementBack to top ↑
- Macroprudential & Systemic Oversight
- Crisis Management, Resolution & Deposit Insurance
- External Liquidity & Financial Safety Nets
Sovereign Capital & External Financial PowerBack to top ↑
- Official Reserves Management
- Sovereign Wealth & Public Asset Management
- Currency Internationalisation & Reserve Status
- Capital Account & Flow Management
- International Financial Centre Capability
$65.15 billion (31 December 2013 est.)//$64.17 billion (31 December 2012 est.)
$50.15 billion (31 December 2013 est.)//$50.47 billion (31 December 2012 est.)
GINC Capability Domains · Chapter 11
Production and Innovation
🇵🇪 Peru’s output, industry and the engine of prosperity
Economic Output & ProductivityBack to top ↑
Peru's economy reflects its varied topography - an arid lowland coastal region, the central high sierra of the Andes, the dense forest of the Amazon, with tropical lands bordering Colombia and Brazil. A wide range of important mineral resources are found in the mountainous and coastal areas, and Peru's coastal waters provide excellent fishing grounds. Peru is the world's second largest producer of silver and third largest producer of copper. The Peruvian economy has been growing by an average of 5.6% for the past five years with a stable exchange rate and low inflation, which in 2013 was just below the upper limit of the Central Bank target range of 1 to 3%. For the last three years, this growth was due partly to high international prices for Peru's metals and minerals exports, which account for almost 60% of the country's total exports. Despite Peru's strong macroeconomic performance, dependence on minerals and metals exports and imported foodstuffs makes the economy vulnerable to fluctuations in world prices. Peru's rapid expansion coupled with cash transfers and other programs have helped to reduce the national poverty rate by 28 percentage points since 2002, but inequality persists and continues to pose a challenge for the Ollanta HUMALA administration, which has championed a policy of social inclusion and a more equitable distribution of income. Poor infrastructure hinders the spread of growth to Peru's non-coastal areas. Peru's free trade policy has continued under the HUMALA administration; since 2006, Peru has signed trade deals with the US, Canada, Singapore, China, Korea, Mexico, Japan, the EU, the European Free Trade Association, Chile, Thailand, Costa Rica, Panama, Venezuela, concluded negotiations with Guatemala, and begun trade talks with Honduras and El Salvador, Turkey and the Trans-Pacific Partnership. Peru also has signed a trade pact with Chile, Colombia, and Mexico, called the Pacific Alliance, that rivals Mercosur. Since the US-Peru Trade Promotion Agreement entered into force in February 2009, total trade between Peru and the United States has doubled. Although Peru has continued to attract foreign investment, political activism and protests are hampering development of some projects related to natural resource extraction.
$344 billion (2013 est.)//$327.3 billion (2012 est.)//$308 billion (2011 est.)
5.1% (2013 est.)//6.3% (2012 est.)//6.9% (2011 est.)
$11,100 (2013 est.)//$10,700 (2012 est.)//$10,300 (2011 est.)
$210.3 billion (2013 est.)
Labour & EmploymentBack to top ↑
- Employment & Labour Force Participation
- Labour Market Institutions & Wage Setting
- Employment Services & Skills Matching
- Labour Adjustment, Transition & Formalisation
16.16 million
3.6% (2012 est.)//3.9% (2011 est.)
Industrial & Sectoral BaseBack to top ↑
- Manufacturing & Advanced Industry
- Foundational & Process Industries
- Agrifood & Primary Production
- Services Economy
asparagus, coffee, cocoa, cotton, sugarcane, rice, potatoes, corn, plantains, grapes, oranges, pineapples, guavas, bananas, apples, lemons, pears, coca, tomatoes, mangoes, barley, medicinal plants, palm oil, marigold, onion, wheat, dry beans; poultry, beef, pork, dairy products; guinea pigs; fish
mining and refining of minerals; steel, metal fabrication; petroleum extraction and refining, natural gas and natural gas liquefaction; fishing and fish processing, cement, glass, textiles, clothing, food processing, beer, soft drinks, rubber, machinery, electrical machinery, chemicals, furniture
5% (2013 est.)
Structural Transformation & ComplexityBack to top ↑
Business Dynamism & EntrepreneurshipBack to top ↑
- Entrepreneurship & Firm Creation
- Risk Capital & Scale-Up Finance
- Firm Growth, Exit & Renewal
- Competition & Market Contestability
Innovation & CommercialisationBack to top ↑
- Business Innovation Capability
- Research Commercialisation & Knowledge Transfer
- Intellectual Property & Intangible Assets
- Innovation Ecosystems & Clusters
Technology Adoption & DiffusionBack to top ↑
GINC Capability Domains · Chapter 12
Trade and Investment
🇵🇪 Peru’s markets, capital and the terms of global exchange
Overall tradeBack to top ↑
$76.8B of exports to 171 partners and $54.7B of imports from 196 in 2024, a surplus of $22.1B.
- Exports
- $76.8B171 partners
- Imports
- $54.7B196 partners
- Balance
- +$22.1Bsurplus
- Total trade
- $132B2024
ExportsBack to top ↑
Where its exports go
The largest partners in 2024, with each one's share of the nation's exports.
| Partner | Value | Share | |
|---|---|---|---|
| China | $25.3B | 33% | |
| United States | $9.88B | 13% | |
| India | $4.72B | 6.1% | |
| Canada | $4.09B | 5.3% | |
| Japan | $3.25B | 4.2% | |
| Switzerland | $3.07B | 4.0% | |
| South Korea | $2.28B | 3.0% | |
| Netherlands | $2.21B | 2.9% | |
| Spain | $2.11B | 2.7% | |
| Chile | $2.08B | 2.7% | |
| United Arab Emirates | $1.94B | 2.5% | |
| Brazil | $1.56B | 2.0% | |
| Germany | $1.10B | 1.4% | |
| United Kingdom | $1.00B | 1.3% | |
| Ecuador | $975M | 1.3% | |
| Colombia | $898M | 1.2% | |
| Mexico | $853M | 1.1% | |
| Italy | $842M | 1.1% | |
| Bolivia | $612M | 0.8% | |
| Panama | $611M | 0.8% |
What it exports
The largest categories in 2024.
| Category | Value | Share | |
|---|---|---|---|
| Ores slag and ash | $29.4B | 38% | |
| Pearls, precious stones, metals, coins | $13.7B | 18% | |
| Edible fruits, nuts, peel of citrus fruit, melons | $7.27B | 9.5% | |
| Mineral fuels, oils, distillation products | $4.34B | 5.6% | |
| Copper | $3.65B | 4.8% | |
| Residues, wastes of food industry, animal fodder | $1.87B | 2.4% | |
| Coffee, tea, mate and spices | $1.46B | 1.9% | |
| Cocoa and cocoa preparations | $1.24B | 1.6% | |
| Articles of apparel, knit or crocheted | $1.17B | 1.5% | |
| Fish, crustaceans, molluscs, aquatics invertebrates | $1.12B | 1.5% | |
| Animal, vegetable fats and oils, cleavage products | $941M | 1.2% | |
| Tin | $930M | 1.2% | |
| Zinc | $896M | 1.2% | |
| Edible vegetables and certain roots and tubers | $890M | 1.2% | |
| Vegetable, fruit, nut food preparations | $780M | 1.0% |
ImportsBack to top ↑
Where its imports come from
The largest partners in 2024, with each one's share of the nation's imports.
| Partner | Value | Share | |
|---|---|---|---|
| China | $16.0B | 29% | |
| United States | $10.2B | 19% | |
| Brazil | $3.34B | 6.1% | |
| Argentina | $2.65B | 4.8% | |
| Mexico | $1.66B | 3.0% | |
| Ecuador | $1.53B | 2.8% | |
| Canada | $1.41B | 2.6% | |
| Chile | $1.40B | 2.6% | |
| Colombia | $1.40B | 2.5% | |
| India | $1.18B | 2.2% | |
| Germany | $1.17B | 2.1% | |
| Japan | $1.12B | 2.1% | |
| Spain | $853M | 1.6% | |
| Italy | $756M | 1.4% | |
| Bolivia | $743M | 1.4% | |
| South Korea | $738M | 1.3% | |
| Vietnam | $729M | 1.3% | |
| Nigeria | $641M | 1.2% | |
| Thailand | $557M | 1.0% | |
| Indonesia | $515M | 0.9% |
What it imports
The largest categories in 2024.
| Category | Value | Share | |
|---|---|---|---|
| Mineral fuels, oils, distillation products | $8.68B | 16% | |
| Machinery, nuclear reactors, boilers | $7.09B | 13% | |
| Vehicles other than railway, tramway | $4.75B | 8.7% | |
| Electrical, electronic equipment | $4.72B | 8.6% | |
| Plastics | $2.62B | 4.8% | |
| Iron and steel | $1.91B | 3.5% | |
| Cereals | $1.79B | 3.3% | |
| Articles of iron or steel | $1.20B | 2.2% | |
| Optical, photo, technical, medical apparatus | $1.11B | 2.0% | |
| Pharmaceutical products | $1.08B | 2.0% | |
| Rubbers | $1.02B | 1.9% | |
| Miscellaneous chemical products | $972M | 1.8% | |
| Residues, wastes of food industry, animal fodder | $894M | 1.6% | |
| Fertilizers | $891M | 1.6% | |
| Paper and paperboard, articles of pulp, paper and board | $785M | 1.4% |
In a list, the bar runs to the largest in that list. The line is each figure’s history from 2000, drawn to its own peak: it shows the shape of the years, and the value shows the size.
External balanceBack to top ↑
-$10.31 billion (2013 est.)//-$7.137 billion (2012 est.)
Trade Facilitation & LogisticsBack to top ↑
Trade Policy & Market AccessBack to top ↑
- Trade Policy & Negotiation Capability
- Market Access & Agreements Network
- Trade Law & Enforcement
- Standards, Conformity & Quality Infrastructure
Digital & Services TradeBack to top ↑
- Services Trade Capability
- Digital Trade & E-Commerce
- Data Flows & Digital Trade Governance
- Tourism & Visitor Economy
Investment Attraction & ProjectionBack to top ↑
- Investment Attraction & Facilitation
- Investment Absorption & Linkages
- Outward Investment & Global Corporate Presence
$76.57 billion (31 December 2013 est.)//$63.51 billion (31 December 2012 est.)
$3.165 billion (31 December 2013 est.)//$3.041 billion (31 December 2012 est.)
Export Capability & SophisticationBack to top ↑
$41.48 billion (2013 est.)//$45.64 billion (2012 est.)
China 19.9%, US 15.7%, Canada 9.5%, Japan 6.6%, Spain 5.2%, Chile 4.9% (2012)
copper, gold, lead, zinc, tin, iron ore, molybdenum, silver; crude petroleum and petroleum products, natural gas; coffee, asparagus and other vegetables, fruit, apparel and textiles, fishmeal, fish, chemicals, fabricated metal products and machinery, alloys
Global Value Chain PositionBack to top ↑
- Value Chain Participation & Integration
- Value Chain Position & Upgrading
- Regional Integration & Hub Anchoring
Economic Leverage & DependenceBack to top ↑
- Strategic Supply Security
- Concentration Risk & Revenue Stabilisation
- Economic Leverage & Coercion Resistance
$42.13 billion (2013 est.)//$41.11 billion (2012 est.)
US 24.6%, China 14%, Brazil 6.4%, Argentina 5%, Chile 4.8%, Colombia 4.2%, Ecuador 4.1%, Mexico 4% (2012)
petroleum and petroleum products, chemicals, plastics, machinery, vehicles, color TV sets, power shovels, front-end loaders, telephones and telecommunication equipment, iron and steel, wheat, corn, soybean products, paper, cotton, vaccines and medicines
Peru · you are in
Historical Context
Foundations
GINC Capability Domains
Find in this brief · Peru