
Pakistan
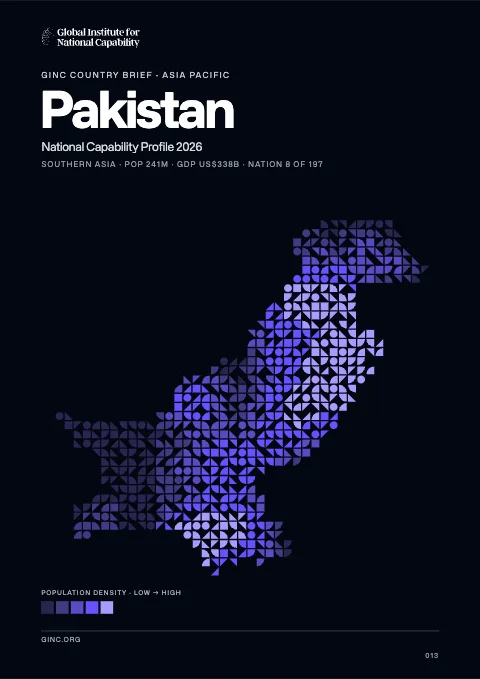
Pakistan is a federal republic in South Asia, home to 196 million people, with its capital at Islamabad.
Contents
12 chapters
Foundations
01–03
At a glance
- Area
- 796.1Kkm²#36 World#1 South Asia
- Population
- 196.2M#6 World#1 South Asia
- GDP (market)
- $237B
- GDP (PPP)
- $574.1B#26 World#1 South Asia
- GDP per capita
- $3.1K#177 World#4 South Asia
The whole brief
Pakistan National Capability Profile 2026
Foundations · Chapter 01
Historical Context
🇵🇰 Pakistan’s understanding the origins and evolution of the modern nation
BackgroundBack to top ↑
The Indus Valley civilization, one of the oldest in the world and dating back at least 5,000 years, spread over much of what is presently Pakistan. During the second millennium B.C., remnants of this culture fused with the migrating Indo-Aryan peoples. The area underwent successive invasions in subsequent centuries from the Persians, Greeks, Scythians, Arabs (who brought Islam), Afghans, and Turks. The Mughal Empire flourished in the 16th and 17th centuries; the British came to dominate the region in the 18th century. The separation in 1947 of British India into the Muslim state of Pakistan (with West and East sections) and largely Hindu India was never satisfactorily resolved, and India and Pakistan fought two wars - in 1947-48 and 1965 - over the disputed Kashmir territory. A third war between these countries in 1971 - in which India capitalized on Islamabad's marginalization of Bengalis in Pakistani politics - resulted in East Pakistan becoming the separate nation of Bangladesh. In response to Indian nuclear weapons testing, Pakistan conducted its own tests in 1998. India-Pakistan relations have been rocky since the November 2008 Mumbai attacks, but both countries are taking small steps to put relations back on track. In February 2008, Pakistan held parliamentary elections and in September 2008, after the resignation of former President MUSHARRAF, elected Asif Ali ZARDARI to the presidency. Pakistani government and military leaders are struggling to control domestic insurgents, many of whom are located in the tribal areas adjacent to the border with Afghanistan.
IndependenceBack to top ↑
14 August 1947 (from British India)
National holidayBack to top ↑
Pakistan Day (also referred to as Pakistan Resolution Day or Republic Day), 23 March (1940); note - commemorates both the adoption of the Lahore Resolution by the All-India Muslim League during its 22-24 March 1940 session, which called for the creation of independent Muslim states, and the adoption of the first constitution of Pakistan on 23 March 1956 during the transition to the Islamic Republic of Pakistan
Foundations · Chapter 02
Geography
🇵🇰 Pakistan’s territory, resources and strategic position
Location and areaBack to top ↑
Southern Asia, bordering the Arabian Sea, between India on the east and Iran and Afghanistan on the west and China in the north
30 00 N, 70 00 E
Asia
slightly more than five times the size of Georgia; slightly less than twice the size of California
1,046 km
Terrain and resourcesBack to top ↑
flat Indus plain in east; mountains in north and northwest; Balochistan plateau in west
land, extensive natural gas reserves, limited petroleum, poor quality coal, iron ore, copper, salt, limestone
199,900 sq km (2008)
Settlement and hazardsBack to top ↑
frequent earthquakes, occasionally severe especially in north and west; flooding along the Indus after heavy rains (July and August)
controls Khyber Pass and Bolan Pass, traditional invasion routes between Central Asia and the Indian Subcontinent
OtherBack to top ↑
246.8 cu km (2011)
water pollution from raw sewage, industrial wastes, and agricultural runoff; limited natural freshwater resources; most of the population does not have access to potable water; deforestation; soil erosion; desertification
Foundations · Chapter 03
Environment
🇵🇰 Pakistan’s environmental conditions, resources and national resilience
ClimateBack to top ↑
mostly hot, dry desert; temperate in northwest; arctic in north
Emissions and pollutionBack to top ↑
Water, waste and foodBack to top ↑
Resources and agreementsBack to top ↑
GINC Capability Domains · Chapter 04
Critical Technology
🇵🇰 Pakistan’s technology frontiers and the pursuit of national advantage
Two counts are set side by side for 2015–2024: on the left, the papers researchers in Pakistan published; on the right, the patent families that began there and were filed in more than one country. First by capability group, then group by group with each group’s capabilities. The badge on a card is the nation’s place among all nations. Papers are from GINC Research Analytics, patent families from GINC Patents.
Research by capability group
#25 WorldPapers published, 2015–2024
7,054
2,391
2,018
1,932
1,636
1,252
643
420
304
36
Patents by capability group
#97 WorldInternational patent families, 2015–2024
Advanced Materials & ManufacturingBack to top ↑
Research
#32 WorldPapers published, 2015–2024
Patents
International patent families, 2015–2024
No international patent families on record for 2015–2024.
Energy TechnologiesBack to top ↑
Research
#24 WorldPapers published, 2015–2024
Patents
International patent families, 2015–2024
No international patent families on record for 2015–2024.
Semiconductors & Advanced ComputingBack to top ↑
Research
#28 WorldPapers published, 2015–2024
No research topic: Semiconductor Design & EDA · Advanced Semiconductor Fabrication · Semiconductor Equipment & Materials · Advanced Packaging & Heterogeneous Integration
Patents
International patent families, 2015–2024
No international patent families on record for 2015–2024.
Artificial IntelligenceBack to top ↑
Research
#16 WorldPapers published, 2015–2024
Patents
#89 WorldInternational patent families, 2015–2024
Quantum TechnologiesBack to top ↑
Research
#35 WorldPapers published, 2015–2024
Patents
International patent families, 2015–2024
No international patent families on record for 2015–2024.
Connectivity, Cyber & Trust TechnologiesBack to top ↑
Research
#14 WorldPapers published, 2015–2024
Patents
International patent families, 2015–2024
No international patent families on record for 2015–2024.
Sensing, Timing & NavigationBack to top ↑
Research
#30 WorldPapers published, 2015–2024
Patents
International patent families, 2015–2024
No international patent families on record for 2015–2024.
Robotics & Autonomous SystemsBack to top ↑
Research
#34 WorldPapers published, 2015–2024
No research topic: Human-Machine Interfaces
Patents
#85 WorldInternational patent families, 2015–2024
Biotechnology & Health TechnologiesBack to top ↑
Research
#23 WorldPapers published, 2015–2024
Patents
#76 WorldInternational patent families, 2015–2024
Medicine and BioTech
Clinical research and life-science invention, drawn from the same series that drive the metric pages. Each card opens the full cross-country comparison.
Space TechnologiesBack to top ↑
Research
#25 WorldPapers published, 2015–2024
Patents
#53 WorldInternational patent families, 2015–2024
GINC Capability Domains · Chapter 05
Strategic Infrastructure
🇵🇰 Pakistan’s energy, connectivity and the material foundations of capability
Resource InfrastructureBack to top ↑
61,660 bbl/day (2012 est.)
0 bbl/day (2010 est.)
151,200 bbl/day (2010 est.)
247.5 million bbl (1 January 2013 est.)
210,100 bbl/day (2010 est.)
426,700 bbl/day (2011 est.)
34,660 bbl/day (2010 est.)
227,100 bbl/day (2010 est.)
39.15 billion cu m (2011 est.)
42.9 billion cu m (2011 est.)
0 cu m (2011 est.)
0 cu m (2011 est.)
679.6 billion cu m (1 January 2013 est.)
gas 12,646 km; oil 2,576 km; refined products 1,087 km (2013)
Agriculture & Food InfrastructureBack to top ↑
- Irrigation & Agricultural Water
- Livestock & Veterinary
- Fisheries & Aquaculture
- Storage, Cold Chain & Markets
Energy InfrastructureBack to top ↑
- Thermal Generation
- Nuclear Generation
- Nuclear Fuel Cycle & Radioactive Waste
- Hydropower
- Renewable Generation
- Transmission & Distribution
- System Control & Dispatch
- Storage & Fuel Supply
22.27 million kW (2010 est.)
94.65 billion kWh (2011 est.)
70.1 billion kWh (2011 est.)
0 kWh (2012 est.)
0 kWh (2012 est.)
68.3% of total installed capacity (2010 est.)
2.1% of total installed capacity (2010 est.)
29.6% of total installed capacity (2010 est.)
0% of total installed capacity (2010 est.)
139.7 million Mt (2011 est.)
Water, Sanitation & Waste InfrastructureBack to top ↑
- Dams, Reservoirs & Flood Defence
- Water Supply & Treatment
- Bulk Water Transfer & Desalination
- Wastewater & Sanitation
- Solid Waste & Recycling
Advanced ManufacturingBack to top ↑
- Materials & Inputs
- Chemicals & Hazardous Process Industry
- Production Systems
- Supply Chain & Ecosystem
- Workforce & Innovation
Transport InfrastructureBack to top ↑
- Seaports & Terminals
- Air Infrastructure
- Air Navigation & Traffic Management
- Inland Waterways & Ferries
- Rail Infrastructure
- Roads & Bridges
- Logistics, Multimodal & Border Infrastructure
- Postal & Parcel
151 (2013)
23 (2013)
Communications & Digital InfrastructureBack to top ↑
- Subsea Cables & International Gateways
- Core & Backbone Networks
- Mobile & Wireless Networks
- Spectrum & Broadcasting
- Data Centres, Compute & Cloud
- Data Resources
- AI Tools & Applications
5.803 million (2012)
125 million (2013)
20.431 million (2009)
365,813 (2012)
.pk
Financial InfrastructureBack to top ↑
- Currency & Reserves
- Payments & Settlement Systems
- Markets, Exchanges & Depositories
- Banks, Insurers & Systemic Institutions
Social InfrastructureBack to top ↑
- Health Infrastructure
- Public Health & Laboratories
- Medical Supply & Stockpiles
- Education & Skills Infrastructure
- Research & Scientific Facilities
- Housing, Community & Social Services
- Government & Public Administration
- Cultural, Community & Recreational Infrastructure
- Justice & Corrections
- Emergency Services & Civil Protection
- Hydrometeorology & Early Warning
Space, Aerospace & Defence InfrastructureBack to top ↑
GINC Capability Domains · Chapter 06
National Security
🇵🇰 Pakistan’s force, intelligence and the defence of the nation
Disputes and terrorismBack to top ↑
various talks and confidence-building measures cautiously have begun to defuse tensions over Kashmir, particularly since the October 2005 earthquake in the region; Kashmir nevertheless remains the site of the world's largest and most militarized territorial dispute with portions under the de facto administration of China (Aksai Chin), India (Jammu and Kashmir), and Pakistan (Azad Kashmir and Northern Areas); UN Military Observer Group in India and Pakistan has maintained a small group of peacekeepers since 1949; India does not recognize Pakistan's ceding historic Kashmir lands to China in 1964; India and Pakistan have maintained their 2004 cease-fire in Kashmir and initiated discussions on defusing the armed standoff in the Siachen glacier region; Pakistan protests India's fencing the highly militarized Line of Control and construction of the Baglihar Dam on the Chenab River in Jammu and Kashmir, which is part of the larger dispute on water sharing of the Indus River and its tributaries; to defuse tensions and prepare for discussions on a maritime boundary, India and Pakistan seek technical resolution of the disputed boundary in Sir Creek estuary at the mouth of the Rann of Kutch in the Arabian Sea; Pakistani maps continue to show the Junagadh claim in India's Gujarat State; since 2002, with UN assistance, Pakistan has repatriated 3.8 million Afghan refugees, leaving about 2.6 million; Pakistan has sent troops across and built fences along some remote tribal areas of its treaty-defined Durand Line border with Afghanistan, which serve as bases for foreign terrorists and other illegal activities; Afghan, Coalition, and Pakistan military meet periodically to clarify the alignment of the boundary on the ground and on maps
Force Generation & MobilisationBack to top ↑
Pakistan Army (includes National Guard), Pakistan Navy (includes Marines and Maritime Security Agency), Pakistan Air Force (Pakistan Fiza'ya) (2013)
16-23 years of age for voluntary military service; soldiers cannot be deployed for combat until age 18; the Pakistani Air Force and Pakistani Navy have inducted their first female pilots and sailors; the Pakistan Air Force recruits aviation technicians at age 15; service obligation (Navy) 10-18 years; retirement required after 18-30 years service or age 40-52 (2012)
3.04% of GDP (2012)//3.13% of GDP (2011)//3.04% of GDP (2010)
Forces under arms
Active-duty strength on the Correlates of War series, which reaches back to 1816 and so carries a nation’s whole record of mobilisation rather than its present establishment. The card opens the full cross-country comparison.
Intelligence & AssessmentBack to top ↑
- Imagery & Geospatial Intelligence
- Signals & Cyber Intelligence
- Technical & Measurement Intelligence
- Open-Source & Financial Intelligence
- Human Intelligence & Counterintelligence
- All-Source Analysis & Warning
Joint Command, Projection & SustainmentBack to top ↑
- Command, Control & Communications
- Strategic Lift & Mobility
- Expeditionary & Peace Operations
- Operational Sustainment & War Reserves
- Defence Industrial Mobilisation
- CBRN Defence
Land PowerBack to top ↑
- Combined Arms Manoeuvre
- Land Fires
- Battlefield Aviation & Uncrewed Systems
- Special Operations & Irregular Warfare
Maritime PowerBack to top ↑
- Maritime Security & Constabulary
- Sea Denial & Undersea Warfare
- Sea Control
- Amphibious & Expeditionary Operations
Air PowerBack to top ↑
- Air Sovereignty & Policing
- Control of the Air
- Air Strike & Interdiction
- Airborne ISR, Early Warning & Battle Management
Strategic Strike & Missile DefenceBack to top ↑
Space OperationsBack to top ↑
Cyber & Electromagnetic OperationsBack to top ↑
Nuclear DeterrenceBack to top ↑
GINC Capability Domains · Chapter 07
Human Capital
🇵🇰 Pakistan’s population, health and the skills that sustain capability
DemographyBack to top ↑
196,174,380 (July 2014 est.)
1.49% (2014 est.)
23.19 births/1,000 population (2014 est.)
6.58 deaths/1,000 population (2014 est.)
2.86 children born/woman (2014 est.)
23.4
27% (2007/08)
Migration and urbanisationBack to top ↑
-1.69 migrant(s)/1,000 population (2014 est.)
Karachi 13.876 million; Lahore 7.566 million; Faisalabad 3.038 million; Rawalpindi 2.164 million; Multan 1.775 million; ISLAMABAD (capital) 919,000 (2011)
Welfare and equityBack to top ↑
22.3% (FY05/06 est.)
30.6 (FY07/08)//41 (FY98/99)
DisplacementBack to top ↑
Early Childhood DevelopmentBack to top ↑
30.9% (2011)
Foundational EducationBack to top ↑
2.1% of GDP (2012)
Advanced EducationBack to top ↑
Technical & Vocational SkillsBack to top ↑
Digital & AI CompetenceBack to top ↑
Generative AI adoption
Modelled share of working-age adults using generative AI, from Microsoft telemetry scaled to each country’s 15–64 population. A measure of how fast a workforce is absorbing the technology rather than of how much of it a nation builds. The card opens the full cross-country comparison.
Lifelong Learning & ReskillingBack to top ↑
Research Talent & Knowledge CreationBack to top ↑
Population HealthBack to top ↑
260 deaths/100,000 live births (2010)
5.5% (2008)
0.1% (2012 est.)
86,700 (2012 est.)
3,500 (2012 est.)
Health System CapabilityBack to top ↑
2.5% of GDP (2011)
0.81 physicians/1,000 population (2009)
0.6 beds/1,000 population (2010)
GINC Capability Domains · Chapter 08
Governance and Integrity
🇵🇰 Pakistan’s institutions, law and the integrity of the state
State structureBack to top ↑
federal republic
4 provinces, 1 territory*, and 1 capital territory**; Balochistan, Federally Administered Tribal Areas*, Islamabad Capital Territory**, Khyber Pakhtunkhwa (formerly North-West Frontier Province), Punjab, Sindh
several previous; latest endorsed 12 April 1973, passed 19 April 1973, entered into force 14 August 1973 (suspended and restored several times); amended many times, last in 2012 (2012)
18 years of age; universal; note - there are joint electorates and reserved parliamentary seats for women and non-Muslims
Political Institutions & Civic ParticipationBack to top ↑
- Electoral Management & Integrity
- Legislature & Deliberative Institutions
- Citizen Participation & Civic Space
bicameral parliament or Majlis-e-Shoora consists of the Senate (104 seats; members indirectly elected by provincial assemblies and the territories' representatives in the National Assembly to serve six-year terms; one half are elected every three years) and the National Assembly (342 seats; 272 members elected by popular vote; 60 seats reserved for women; 10 seats reserved for non-Muslims; members serve five-year terms)
Awami National Party or ANP [Asfandyar Wali KHAN]//Balochistan National Party-Awami or BNP-A//Balochistan National Party-Hayee Group or BNP-H [Dr. Hayee BALOCH]//Balochistan National Party-Mengal or BNP-M//Jamaat-i Islami or JI [Syed Munawar HASAN]//Jamhoori Watan Party or JWP//Jamiat Ahle Hadith or JAH [Sajid MIR]//Jamiat-i Ulema-i Islam Fazl-ur Rehman or JUI-F [Fazl-ur REHMAN]//Jamiat-i Ulema-i Islam Sami-ul HAQ or JUI-S [Sami ul-HAQ]//Jamiat-i Ulema-i Pakistan or JUP [Abul Khair ZUBAIR]//Millat-e-Jafferia [Allama Sajid NAQVI]//Muttahida Qaumi Movement or MQM [Altaf HUSSAIN]//National Peoples Party or NPP//Pakhtun-khwa Milli Awami Party or PKMAP [Mahmood Khan ACHAKZAI]//Pakistan Awami Tehrik or PAT [Tahir ul QADRI]//Pakistan Muslim League-Quaid-i Azam or PML-Q [Chaudhry Shujaat HUSSAIN]//Pakistan Muslim League-Functional or PML-F [Pir PAGARO]//Pakistan Muslim League-Nawaz or PML-N [Nawaz SHARIF]//Pakistan Peoples Party Parliamentarians or PPPP [Bilawal Bhutto ZARDARI, chairman; Asif Ali ZARDARI, co-chairman]//Pakistan Peoples Party-S [Aftab Ahmad SHERPAO]//Quami Watan Party or QWP [Aftab Ahmed Khan SHERPAO]//Pakistan Tehrik-e Insaaf or PTI [Imran KHAN]//
Justice System & Fundamental RightsBack to top ↑
- Judicial Independence & Court Capability
- Access to Justice & Legal Services
- Fundamental Rights Protection
- Human Rights Institutions & Equality Bodies
common law system with Islamic law influence
accepts compulsory ICJ jurisdiction with reservations; non-party state to the ICCt
Internal Security & OrderBack to top ↑
significant transit area for Afghan drugs, including heroin, opium, morphine, and hashish, bound for Iran, Western markets, the Gulf States, Africa, and Asia; financial crimes related to drug trafficking, terrorism, corruption, and smuggling remain problems; opium poppy cultivation estimated to be 2,300 hectares in 2007 with 600 of those hectares eradicated; federal and provincial authorities continue to conduct anti-poppy campaigns that utilizes forced eradication, fines, and arrests
Regulatory Governance & Strategic ControlsBack to top ↑
- Regulatory Quality & Better Regulation
- Regulatory Delivery & Independent Regulators
- Strategic Controls & Economic Security Administration
Government Effectiveness & Public AdministrationBack to top ↑
- Centre of Government & Policy Coordination
- Civil Service & Public Workforce
- Digital Government & Service Delivery
- Legal Identity & Civil Registration
- Statistical & Data Capability
Public Integrity & Anti-CorruptionBack to top ↑
Transparency, Oversight & AccountabilityBack to top ↑
- Right to Information & Open Government
- Independent Oversight & Supreme Audit
- Independent Media & Journalist Safety
National Resilience & Crisis ManagementBack to top ↑
GINC Capability Domains · Chapter 09
Information and Influence
🇵🇰 Pakistan’s identity, media and the projection of influence
Identity and cultureBack to top ↑
Punjabi 48%, Sindhi 12%, Saraiki (a Punjabi variant) 10%, Pashto (alternate name, Pashtu) 8%, Urdu (official) 8%, Balochi 3%, Hindko 2%, Brahui 1%, English (official; lingua franca of Pakistani elite and most government ministries), Burushaski, and other 8%
Muslim (official) 96.4% (Sunni 85-90%, Shia 10-15%), other (includes Christian and Hindu) 3.6% (2010 est.)
Punjabi 44.68%, Pashtun (Pathan) 15.42%, Sindhi 14.1%, Sariaki 8.38%, Muhajirs 7.57%, Balochi 3.57%, other 6.28%
star and crescent
green with a vertical white band (symbolizing the role of religious minorities) on the hoist side; a large white crescent and star are centered in the green field; the crescent, star, and color green are traditional symbols of Islam
Diplomatic Statecraft & Global NetworksBack to top ↑
- Diplomatic Network & Consular Reach
- Multilateral Leadership & Norm Setting
- Agenda-Setting & Convening
- Mediation & Crisis Diplomacy
ADB, ARF, ASEAN (dialogue partner), C, CICA, CP, D-8, ECO, FAO, G-11, G-24, G-77, IAEA, IBRD, ICAO, ICC (national committees), ICRM, IDA, IDB, IFAD, IFC, IFRCS, IHO, ILO, IMF, IMO, IMSO, Interpol, IOC, IOM, IPU, ISO, ITSO, ITU, ITUC (NGOs), LAIA (observer), MIGA, MINURSO, MONUSCO, NAM, OAS (observer), OIC, OPCW, PCA, SAARC, SACEP, SCO (observer), UN, UNAMID, UNCTAD, UNESCO, UNHCR, UNIDO, UNISFA, UNMIL, UNMIT, UNOCI, UNWTO, UPU, WCO, WFTU (NGOs), WHO, WIPO, WMO, WTO
Alliances & Security CooperationBack to top ↑
Development Cooperation & Global AssistanceBack to top ↑
Culture, Language & Education DiplomacyBack to top ↑
- Cultural & Language Institutes
- Creative Industries & Cultural Export Reach
- Heritage & Cultural Institutions
- Education Diplomacy & Alumni Networks
- Sports & Major Events
Diaspora & Global CommunitiesBack to top ↑
Information Environment & Strategic CommunicationBack to top ↑
- Strategic Communications & Public Diplomacy
- International Media & Broadcasting
- Information Defence & Counter-Interference
media is government regulated; 1 dominant state-owned TV broadcaster, Pakistan Television Corporation (PTV), operates a network consisting of 5 channels; private TV broadcasters are permitted; to date 69 foreign satellite channels are operational; the state-owned radio network operates more than 40 stations; nearly 100 commercially licensed privately owned radio stations provide programming mostly limited to music and talk shows (2007)
GINC Capability Domains · Chapter 10
Financial Strength
🇵🇰 Pakistan’s fiscal depth, reserves and the capacity to act
Monetary & Currency CapabilityBack to top ↑
- Monetary Policy & Price Stability
- Exchange Rate & External Account Management
- Currency Issuance & Digital Money
7.7% (2013 est.)//9.7% (2012 est.)
Pakistani rupees (PKR) per US dollar -//100.4 (2013 est.)//93.3952 (2012 est.)//85.194 (2010 est.)//81.71 (2009)//70.64 (2008)
12% (31 January 2012 est.)//14% (31 December 2010 est.)
11.5% (31 December 2013 est.)//12.41% (31 December 2012 est.)
$71.96 billion (31 December 2013 est.)//$62.29 billion (31 December 2012 est.)
$93.11 billion (31 December 2013 est.)//$82.63 billion (31 December 2012 est.)
Fiscal Capacity & Public FinanceBack to top ↑
- Revenue Mobilisation & Tax Administration
- Public Expenditure & Budget Management
- Sovereign Debt & Treasury Management
- Public Investment Management
12.6% of GDP (2013 est.)
-7.7% of GDP (2013 est.)
54.6% of GDP (2013 est.)//52.1% of GDP (2012 est.)
1 July - 30 June
Financial System Depth & AccessBack to top ↑
- Banking System Capacity
- Capital Markets Depth & Development
- Long-Term & Institutional Capital
- Financial Inclusion & Household Access
- Development & Policy Finance
$106.8 billion (31 December 2013 est.)//$94.65 billion (31 December 2012 est.)
$NA (31 December 2012 est.)//$NA (31 December 2011)//$38.17 billion (31 December 2010 est.)
12.7% of GDP (2013 est.)//13.3% of GDP (2012 est.)//12.9% of GDP (2011 est.)
Financial Regulation & IntegrityBack to top ↑
- Prudential Regulation & Supervision
- Financial Integrity & Illicit Finance Control
- Market Conduct & Consumer Protection
- Payment & Market Infrastructure Oversight
Financial Stability & Crisis ManagementBack to top ↑
- Macroprudential & Systemic Oversight
- Crisis Management, Resolution & Deposit Insurance
- External Liquidity & Financial Safety Nets
Sovereign Capital & External Financial PowerBack to top ↑
- Official Reserves Management
- Sovereign Wealth & Public Asset Management
- Currency Internationalisation & Reserve Status
- Capital Account & Flow Management
- International Financial Centre Capability
$11.18 billion (31 December 2013 est.)//$13.8 billion (31 December 2012 est.)
$52.43 billion (31 December 2013 est.)//$54.5 billion (31 December 2012 est.)
GINC Capability Domains · Chapter 11
Production and Innovation
🇵🇰 Pakistan’s output, industry and the engine of prosperity
Economic Output & ProductivityBack to top ↑
Decades of internal political disputes and low levels of foreign investment have led to slow growth and underdevelopment in Pakistan. Agriculture accounts for more than one-fifth of output and two-fifths of employment. Textiles account for most of Pakistan's export earnings, and Pakistan's failure to expand a viable export base for other manufactures has left the country vulnerable to shifts in world demand. Official unemployment was 6.6% in 2013, but this fails to capture the true picture, because much of the economy is informal and underemployment remains high. Over the past few years, low growth and high inflation, led by a spurt in food prices, have increased the amount of poverty. As a result of political and economic instability, the Pakistani rupee has depreciated more than 40% since 2007. The government agreed to an International Monetary Fund Standby Arrangement in November 2008 in response to a balance of payments crisis. Although the economy has stabilized since the crisis, it has failed to recover. Foreign investment has not returned, due to investor concerns related to governance, energy, security, and a slow-down in the global economy. Remittances from overseas workers, averaging about $1 billion a month since March 2011, remain a bright spot for Pakistan. However, after a small current account surplus in fiscal year 2011 (July 2010/June 2011), Pakistan's current account turned to deficit in the following two years, spurred by higher prices for imported oil and lower prices for exported cotton. Pakistan remains stuck in a low-income, low-growth trap, with growth averaging about 3.5% per year from 2008 to 2013. Pakistan must address long standing issues related to government revenues and energy production in order to spur the amount of economic growth that will be necessary to employ its growing and rapidly urbanizing population, more than half of which is under 22. Other long term challenges include expanding investment in education and healthcare, adapting to the effects of climate change and natural disasters, and reducing dependence on foreign donors.
$574.1 billion (2013 est.)//$554.2 billion (2012 est.)//$531 billion (2011 est.)
3.6% (2013 est.)//4.4% (2012 est.)//3.7% (2011 est.)
$3,100 (2013 est.)//$3,100 (2012 est.)//$3,000 (2011 est.)
$236.5 billion (2013 est.)
Labour & EmploymentBack to top ↑
- Employment & Labour Force Participation
- Labour Market Institutions & Wage Setting
- Employment Services & Skills Matching
- Labour Adjustment, Transition & Formalisation
59.21 million
6.6% (2013 est.)//6% (2012 est.)
Industrial & Sectoral BaseBack to top ↑
- Manufacturing & Advanced Industry
- Foundational & Process Industries
- Agrifood & Primary Production
- Services Economy
cotton, wheat, rice, sugarcane, fruits, vegetables; milk, beef, mutton, eggs
textiles and apparel, food processing, pharmaceuticals, construction materials, paper products, fertilizer, shrimp
3.5% (2013 est.)
Structural Transformation & ComplexityBack to top ↑
Business Dynamism & EntrepreneurshipBack to top ↑
- Entrepreneurship & Firm Creation
- Risk Capital & Scale-Up Finance
- Firm Growth, Exit & Renewal
- Competition & Market Contestability
Innovation & CommercialisationBack to top ↑
- Business Innovation Capability
- Research Commercialisation & Knowledge Transfer
- Intellectual Property & Intangible Assets
- Innovation Ecosystems & Clusters
Technology Adoption & DiffusionBack to top ↑
GINC Capability Domains · Chapter 12
Trade and Investment
🇵🇰 Pakistan’s markets, capital and the terms of global exchange
Overall tradeBack to top ↑
$36.9B of exports to 204 partners and $60.8B of imports from 194 in 2024, a deficit of $23.9B.
- Exports
- $36.9B204 partners
- Imports
- $60.8B194 partners
- Balance
- −$23.9Bdeficit
- Total trade
- $97.6B2024
ExportsBack to top ↑
Where its exports go
The largest partners in 2024, with each one's share of the nation's exports.
| Partner | Value | Share | |
|---|---|---|---|
| United States | $5.49B | 15% | |
| China | $2.79B | 7.6% | |
| Germany | $2.65B | 7.2% | |
| United Kingdom | $2.32B | 6.3% | |
| United Arab Emirates | $1.76B | 4.8% | |
| Spain | $1.59B | 4.3% | |
| Afghanistan | $1.51B | 4.1% | |
| France | $1.45B | 3.9% | |
| Italy | $1.10B | 3.0% | |
| Netherlands | $1.04B | 2.8% | |
| Poland | $960M | 2.6% | |
| Saudi Arabia | $831M | 2.3% | |
| Bangladesh | $778M | 2.1% | |
| Indonesia | $620M | 1.7% | |
| Malaysia | $529M | 1.4% | |
| Sri Lanka | $445M | 1.2% | |
| Canada | $444M | 1.2% | |
| Turkey | $406M | 1.1% | |
| Thailand | $390M | 1.1% | |
| Austria | $339M | 0.9% |
What it exports
The largest categories in 2024.
| Category | Value | Share | |
|---|---|---|---|
| Articles of apparel, knit or crocheted | $5.76B | 16% | |
| Other made textile articles, sets, worn clothing | $5.60B | 15% | |
| Articles of apparel, not knit or crocheted | $5.03B | 14% | |
| Cereals | $4.20B | 11% | |
| Cotton | $2.78B | 7.5% | |
| Copper | $999M | 2.7% | |
| Mineral fuels, oils, distillation products | $851M | 2.3% | |
| Articles of leather, animal gut, harness, travel good | $816M | 2.2% | |
| Salt, sulphur, earth, stone, plaster, lime and cement | $609M | 1.7% | |
| Optical, photo, technical, medical apparatus | $587M | 1.6% | |
| Meat and edible meat offal | $546M | 1.5% | |
| Sugars and sugar confectionery | $538M | 1.5% | |
| Plastics | $537M | 1.5% | |
| Pharmaceutical products | $530M | 1.4% | |
| Toys, games, sports requisites | $475M | 1.3% |
ImportsBack to top ↑
Where its imports come from
The largest partners in 2024, with each one's share of the nation's imports.
| Partner | Value | Share | |
|---|---|---|---|
| China | $17.6B | 29% | |
| United Arab Emirates | $5.66B | 9.3% | |
| Saudi Arabia | $4.43B | 7.3% | |
| Qatar | $3.84B | 6.3% | |
| Indonesia | $3.19B | 5.3% | |
| Kuwait | $2.08B | 3.4% | |
| United States | $1.51B | 2.5% | |
| Singapore | $1.30B | 2.1% | |
| Japan | $1.24B | 2.0% | |
| Oman | $1.20B | 2.0% | |
| Iran | $1.20B | 2.0% | |
| Malaysia | $983M | 1.6% | |
| South Korea | $961M | 1.6% | |
| Thailand | $942M | 1.5% | |
| Germany | $846M | 1.4% | |
| Brazil | $722M | 1.2% | |
| United Kingdom | $680M | 1.1% | |
| Australia | $663M | 1.1% | |
| Afghanistan | $659M | 1.1% | |
| Russia | $632M | 1.0% |
What it imports
The largest categories in 2024.
| Category | Value | Share | |
|---|---|---|---|
| Mineral fuels, oils, distillation products | $18.0B | 30% | |
| Electrical, electronic equipment | $6.40B | 11% | |
| Machinery, nuclear reactors, boilers | $3.53B | 5.8% | |
| Animal, vegetable fats and oils, cleavage products | $3.03B | 5.0% | |
| Iron and steel | $2.91B | 4.8% | |
| Organic chemicals | $2.75B | 4.5% | |
| Plastics | $2.63B | 4.3% | |
| Vehicles other than railway, tramway | $1.81B | 3.0% | |
| Cotton | $1.78B | 2.9% | |
| Edible vegetables and certain roots and tubers | $1.22B | 2.0% | |
| Oil seed, oleaginous fruits, grain, seed, fruits | $1.17B | 1.9% | |
| Manmade filaments | $971M | 1.6% | |
| Pharmaceutical products | $925M | 1.5% | |
| Coffee, tea, mate and spices | $850M | 1.4% | |
| Optical, photo, technical, medical apparatus | $820M | 1.3% |
In a list, the bar runs to the largest in that list. The line is each figure’s history from 2000, drawn to its own peak: it shows the shape of the years, and the value shows the size.
External balanceBack to top ↑
-$2.36 billion (2013 est.)//-$2.072 billion (2012 est.)
Trade Facilitation & LogisticsBack to top ↑
Trade Policy & Market AccessBack to top ↑
- Trade Policy & Negotiation Capability
- Market Access & Agreements Network
- Trade Law & Enforcement
- Standards, Conformity & Quality Infrastructure
Digital & Services TradeBack to top ↑
- Services Trade Capability
- Digital Trade & E-Commerce
- Data Flows & Digital Trade Governance
- Tourism & Visitor Economy
Investment Attraction & ProjectionBack to top ↑
- Investment Attraction & Facilitation
- Investment Absorption & Linkages
- Outward Investment & Global Corporate Presence
$24.33 billion (31 December 2013 est.)//$22.73 billion (31 December 2012 est.)
$1.569 billion (31 December 2013 est.)//$1.519 billion (31 December 2012 est.)
Export Capability & SophisticationBack to top ↑
$25.05 billion (2013 est.)//$24.71 billion (2012 est.)
US 13.6%, China 11.1%, UAE 8.5%, Afghanistan 7.8% (2012)
textiles (garments, bed linen, cotton cloth, yarn), rice, leather goods, sports goods, chemicals, manufactures, carpets and rugs
Global Value Chain PositionBack to top ↑
- Value Chain Participation & Integration
- Value Chain Position & Upgrading
- Regional Integration & Hub Anchoring
Economic Leverage & DependenceBack to top ↑
- Strategic Supply Security
- Concentration Risk & Revenue Stabilisation
- Economic Leverage & Coercion Resistance
$39.27 billion (2013 est.)//$40.07 billion (2012 est.)
China 19.7%, Saudi Arabia 12.3%, UAE 12.1%, Kuwait 6.3% (2012)
petroleum, petroleum products, machinery, plastics, transportation equipment, edible oils, paper and paperboard, iron and steel, tea
Pakistan · you are in
Historical Context
Foundations
GINC Capability Domains
Find in this brief · Pakistan