
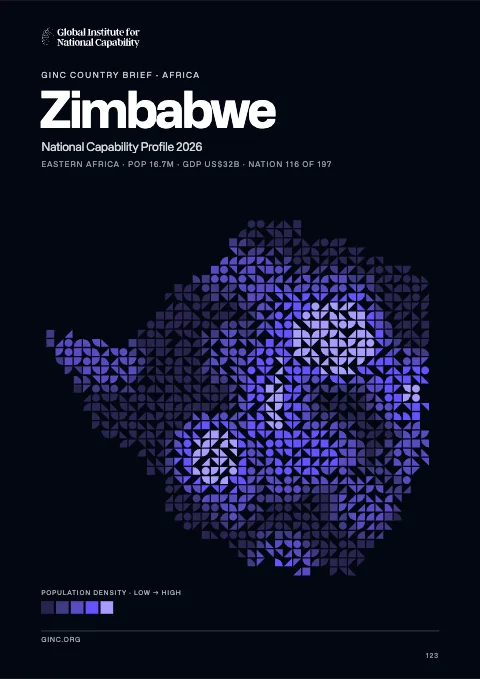
Zimbabwe
Zimbabwe is a landlocked parliamentary democracy in Africa, home to 14 million people, with its capital at Harare.
Contents
12 chapters
Foundations
01–03
At a glance
- Area
- 390.8Kkm²#61 World#26 Africa
- Population
- 13.8M#71 World#23 Africa
- GDP (market)
- $10.5B
- GDP (PPP)
- $7.5B#157 World#39 Africa
- GDP per capita
- $600#227 World#55 Africa
The whole brief
Zimbabwe National Capability Profile 2026
Foundations · Chapter 01
Historical Context
🇿🇼 Zimbabwe’s understanding the origins and evolution of the modern nation
BackgroundBack to top ↑
The UK annexed Southern Rhodesia from the [British] South Africa Company in 1923. A 1961 constitution was formulated that favored whites in power. In 1965 the government unilaterally declared its independence, but the UK did not recognize the act and demanded more complete voting rights for the black African majority in the country (then called Rhodesia). UN sanctions and a guerrilla uprising finally led to free elections in 1979 and independence (as Zimbabwe) in 1980. Robert MUGABE, the nation's first prime minister, has been the country's only ruler (as president since 1987) and has dominated the country's political system since independence. His chaotic land redistribution campaign, which began in 1997 and intensified after 2000, caused an exodus of white farmers, crippled the economy, and ushered in widespread shortages of basic commodities. Ignoring international condemnation, MUGABE rigged the 2002 presidential election to ensure his reelection. In April 2005, the capital city of Harare embarked on Operation Restore Order, ostensibly an urban rationalization program, which resulted in the destruction of the homes or businesses of 700,000 mostly poor supporters of the opposition. President MUGABE in June 2007 instituted price controls on all basic commodities causing panic buying and leaving store shelves empty for months; a period of increasing hyperinflation ensued. General elections held in March 2008 contained irregularities but still amounted to a censure of the ZANU-PF-led government with the opposition winning a majority of seats in parliament. MDC-T opposition leader Morgan TSVANGIRAI won the most votes in the presidential polls, but not enough to win outright. In the lead up to a run-off election in late June 2008, considerable violence enacted against opposition party members led to the withdrawal of TSVANGIRAI from the ballot. Extensive evidence of violence and intimidation resulted in international condemnation of the process. Difficult negotiations over a power-sharing "government of national unity," in which MUGABE remained president and TSVANGIRAI became prime minister, were finally settled in February 2009, although the leaders failed to agree upon many key outstanding governmental issues. MUGABE was reelected president in June 2013 in balloting that was severely flawed and internationally condemned. As a prerequisite to holding the elections, Zimbabwe enacted a new constitution by referendum, although many provisions in the new constitution have yet to be codified in law.
IndependenceBack to top ↑
18 April 1980 (from the UK)
National holidayBack to top ↑
Independence Day, 18 April (1980)
Foundations · Chapter 02
Geography
🇿🇼 Zimbabwe’s territory, resources and strategic position
Location and areaBack to top ↑
Southern Africa, between South Africa and Zambia
20 00 S, 30 00 E
Africa
slightly larger than Montana
0 km (landlocked)
none (landlocked)
Terrain and resourcesBack to top ↑
mostly high plateau with higher central plateau (high veld); mountains in east
coal, chromium ore, asbestos, gold, nickel, copper, iron ore, vanadium, lithium, tin, platinum group metals
1,735 sq km (2003)
Settlement and hazardsBack to top ↑
recurring droughts; floods and severe storms are rare
landlocked; the Zambezi forms a natural riverine boundary with Zambia; in full flood (February-April) the massive Victoria Falls on the river forms the world's largest curtain of falling water; Lake Kariba on the Zambia-Zimbabwe border forms the world's largest reservoir by volume (180 cu km; 43 cu mi)
OtherBack to top ↑
20 cu km (2011)
deforestation; soil erosion; land degradation; air and water pollution; the black rhinoceros herd - once the largest concentration of the species in the world - has been significantly reduced by poaching; poor mining practices have led to toxic waste and heavy metal pollution
Foundations · Chapter 03
Environment
🇿🇼 Zimbabwe’s environmental conditions, resources and national resilience
ClimateBack to top ↑
tropical; moderated by altitude; rainy season (November to March)
Emissions and pollutionBack to top ↑
Water, waste and foodBack to top ↑
Resources and agreementsBack to top ↑
GINC Capability Domains · Chapter 04
Critical Technology
🇿🇼 Zimbabwe’s technology frontiers and the pursuit of national advantage
Two counts are set side by side for 2015–2024: on the left, the papers researchers in Zimbabwe published; on the right, the patent families that began there and were filed in more than one country. First by capability group, then group by group with each group’s capabilities. The badge on a card is the nation’s place among all nations. Papers are from GINC Research Analytics, patent families from GINC Patents.
Research by capability group
#95 WorldPapers published, 2015–2024
178
145
134
38
32
23
19
19
11
0
Patents by capability group
#118 WorldInternational patent families, 2015–2024
Advanced Materials & ManufacturingBack to top ↑
Research
#80 WorldPapers published, 2015–2024
Patents
International patent families, 2015–2024
No international patent families on record for 2015–2024.
Energy TechnologiesBack to top ↑
Research
#108 WorldPapers published, 2015–2024
Patents
#98 WorldInternational patent families, 2015–2024
Semiconductors & Advanced ComputingBack to top ↑
Research
#95 WorldPapers published, 2015–2024
No research topic: Semiconductor Design & EDA · Advanced Semiconductor Fabrication · Semiconductor Equipment & Materials · Advanced Packaging & Heterogeneous Integration
Patents
International patent families, 2015–2024
No international patent families on record for 2015–2024.
Artificial IntelligenceBack to top ↑
Research
#97 WorldPapers published, 2015–2024
Patents
International patent families, 2015–2024
No international patent families on record for 2015–2024.
Quantum TechnologiesBack to top ↑
Research
#93 WorldPapers published, 2015–2024
Patents
International patent families, 2015–2024
No international patent families on record for 2015–2024.
Connectivity, Cyber & Trust TechnologiesBack to top ↑
Research
#99 WorldPapers published, 2015–2024
Patents
International patent families, 2015–2024
No international patent families on record for 2015–2024.
Sensing, Timing & NavigationBack to top ↑
Research
#94 WorldPapers published, 2015–2024
Patents
International patent families, 2015–2024
No international patent families on record for 2015–2024.
Robotics & Autonomous SystemsBack to top ↑
Research
#102 WorldPapers published, 2015–2024
No research topic: Human-Machine Interfaces
Patents
International patent families, 2015–2024
No international patent families on record for 2015–2024.
Biotechnology & Health TechnologiesBack to top ↑
Research
#87 WorldPapers published, 2015–2024
Patents
International patent families, 2015–2024
No international patent families on record for 2015–2024.
Medicine and BioTech
Clinical research and life-science invention, drawn from the same series that drive the metric pages. Each card opens the full cross-country comparison.
Space TechnologiesBack to top ↑
Research
Papers published, 2015–2024
No papers on record for 2015–2024.
Patents
#53 WorldInternational patent families, 2015–2024
GINC Capability Domains · Chapter 05
Strategic Infrastructure
🇿🇼 Zimbabwe’s energy, connectivity and the material foundations of capability
Resource InfrastructureBack to top ↑
120 bbl/day (2012 est.)
0 bbl/day (2010 est.)
0 bbl/day (2010 est.)
0 bbl (1 January 2013 est.)
0 bbl/day (2010 est.)
19,030 bbl/day (2011 est.)
0 bbl/day (2010 est.)
13,290 bbl/day (2010 est.)
0 cu m (2011 est.)
0 cu m (2010 est.)
0 cu m (2011 est.)
0 cu m (2011 est.)
0 cu m (1 January 2013 est.)
refined products 270 km (2013)
Agriculture & Food InfrastructureBack to top ↑
- Irrigation & Agricultural Water
- Livestock & Veterinary
- Fisheries & Aquaculture
- Storage, Cold Chain & Markets
Energy InfrastructureBack to top ↑
- Thermal Generation
- Nuclear Generation
- Nuclear Fuel Cycle & Radioactive Waste
- Hydropower
- Renewable Generation
- Transmission & Distribution
- System Control & Dispatch
- Storage & Fuel Supply
2.035 million kW (2010 est.)
7.808 billion kWh (2010 est.)
12.57 billion kWh (2010 est.)
56 million kWh (2010 est.)
5.338 billion kWh (2010 est.)
66.6% of total installed capacity (2010 est.)
0% of total installed capacity (2010 est.)
33.4% of total installed capacity (2010 est.)
0% of total installed capacity (2010 est.)
8.875 million Mt (2011 est.)
Water, Sanitation & Waste InfrastructureBack to top ↑
- Dams, Reservoirs & Flood Defence
- Water Supply & Treatment
- Bulk Water Transfer & Desalination
- Wastewater & Sanitation
- Solid Waste & Recycling
Advanced ManufacturingBack to top ↑
- Materials & Inputs
- Chemicals & Hazardous Process Industry
- Production Systems
- Supply Chain & Ecosystem
- Workforce & Innovation
Transport InfrastructureBack to top ↑
- Seaports & Terminals
- Air Infrastructure
- Air Navigation & Traffic Management
- Inland Waterways & Ferries
- Rail Infrastructure
- Roads & Bridges
- Logistics, Multimodal & Border Infrastructure
- Postal & Parcel
196 (2013)
(some navigation possible on Lake Kariba) (2011)
Communications & Digital InfrastructureBack to top ↑
- Subsea Cables & International Gateways
- Core & Backbone Networks
- Mobile & Wireless Networks
- Spectrum & Broadcasting
- Data Centres, Compute & Cloud
- Data Resources
- AI Tools & Applications
301,600 (2012)
12.614 million (2012)
1.423 million (2009)
30,615 (2012)
.zw
Financial InfrastructureBack to top ↑
- Currency & Reserves
- Payments & Settlement Systems
- Markets, Exchanges & Depositories
- Banks, Insurers & Systemic Institutions
Social InfrastructureBack to top ↑
- Health Infrastructure
- Public Health & Laboratories
- Medical Supply & Stockpiles
- Education & Skills Infrastructure
- Research & Scientific Facilities
- Housing, Community & Social Services
- Government & Public Administration
- Cultural, Community & Recreational Infrastructure
- Justice & Corrections
- Emergency Services & Civil Protection
- Hydrometeorology & Early Warning
Space, Aerospace & Defence InfrastructureBack to top ↑
GINC Capability Domains · Chapter 06
National Security
🇿🇼 Zimbabwe’s force, intelligence and the defence of the nation
Disputes and terrorismBack to top ↑
Namibia has supported, and in 2004 Zimbabwe dropped objections to, plans between Botswana and Zambia to build a bridge over the Zambezi River, thereby de facto recognizing a short, but not clearly delimited, Botswana-Zambia boundary in the river; South Africa has placed military units to assist police operations along the border of Lesotho, Zimbabwe, and Mozambique to control smuggling, poaching, and illegal migration
Force Generation & MobilisationBack to top ↑
Zimbabwe Defense Forces (ZDF): Zimbabwe National Army (ZNA), Air Force of Zimbabwe (AFZ) (2012)
18-24 years of age for voluntary military service; no conscription; women are eligible to serve (2012)
2.94% of GDP (2012)//2.05% of GDP (2011)//2.94% of GDP (2010)
Forces under arms
Active-duty strength on the Correlates of War series, which reaches back to 1816 and so carries a nation’s whole record of mobilisation rather than its present establishment. The card opens the full cross-country comparison.
Intelligence & AssessmentBack to top ↑
- Imagery & Geospatial Intelligence
- Signals & Cyber Intelligence
- Technical & Measurement Intelligence
- Open-Source & Financial Intelligence
- Human Intelligence & Counterintelligence
- All-Source Analysis & Warning
Joint Command, Projection & SustainmentBack to top ↑
- Command, Control & Communications
- Strategic Lift & Mobility
- Expeditionary & Peace Operations
- Operational Sustainment & War Reserves
- Defence Industrial Mobilisation
- CBRN Defence
Land PowerBack to top ↑
- Combined Arms Manoeuvre
- Land Fires
- Battlefield Aviation & Uncrewed Systems
- Special Operations & Irregular Warfare
Maritime PowerBack to top ↑
- Maritime Security & Constabulary
- Sea Denial & Undersea Warfare
- Sea Control
- Amphibious & Expeditionary Operations
Air PowerBack to top ↑
- Air Sovereignty & Policing
- Control of the Air
- Air Strike & Interdiction
- Airborne ISR, Early Warning & Battle Management
Strategic Strike & Missile DefenceBack to top ↑
Space OperationsBack to top ↑
Cyber & Electromagnetic OperationsBack to top ↑
Nuclear DeterrenceBack to top ↑
GINC Capability Domains · Chapter 07
Human Capital
🇿🇼 Zimbabwe’s population, health and the skills that sustain capability
DemographyBack to top ↑
13,771,721
4.36% (2014 est.)
32.47 births/1,000 population (2014 est.)
10.62 deaths/1,000 population (2014 est.)
3.56 children born/woman (2014 est.)
20.5
58.5% (2010/11)
Migration and urbanisationBack to top ↑
21.78 migrant(s)/1,000 population
HARARE (capital) 1.542 million (2011)
Welfare and equityBack to top ↑
68% (2004)
50.1 (2006)//50.1 (1995)
DisplacementBack to top ↑
Early Childhood DevelopmentBack to top ↑
10.1% (2011)
Foundational EducationBack to top ↑
2.5% of GDP (2010)
Advanced EducationBack to top ↑
Technical & Vocational SkillsBack to top ↑
Digital & AI CompetenceBack to top ↑
Generative AI adoption
Modelled share of working-age adults using generative AI, from Microsoft telemetry scaled to each country’s 15–64 population. A measure of how fast a workforce is absorbing the technology rather than of how much of it a nation builds. The card opens the full cross-country comparison.
Lifelong Learning & ReskillingBack to top ↑
Research Talent & Knowledge CreationBack to top ↑
Population HealthBack to top ↑
570 deaths/100,000 live births (2010)
7% (2008)
14.7% (2012 est.)
1,368,100 (2012 est.)
39,500 (2012 est.)
Health System CapabilityBack to top ↑
0.06 physicians/1,000 population (2009)
1.7 beds/1,000 population (2011)
GINC Capability Domains · Chapter 08
Governance and Integrity
🇿🇼 Zimbabwe’s institutions, law and the integrity of the state
State structureBack to top ↑
parliamentary democracy
8 provinces and 2 cities* with provincial status; Bulawayo*, Harare*, Manicaland, Mashonaland Central, Mashonaland East, Mashonaland West, Masvingo, Matabeleland North, Matabeleland South, Midlands
previous 1979; latest approved by referendum 16 March 2013, approved by Parliament 9 May 2013 (2013)
18 years of age; universal
Political Institutions & Civic ParticipationBack to top ↑
- Electoral Management & Integrity
- Legislature & Deliberative Institutions
- Citizen Participation & Civic Space
bicameral Parliament consists of a Senate (80 seats - 60 members elected by popular vote for a five-year term, 18 traditional chiefs elected by the Council of Chiefs and 2 seats reserved for people with disabilities) and a House of Assembly (270 seats - members elected by popular vote for five-year terms and 60 seats reserved for women who are identified by their parties and nominated by proportional representation)
African National Party or ANP [Egypt DZINEMUNHENZVA]//Movement for Democratic Change - Tsvangirai or MDC-T [Morgan TSVANGIRAI]//Movement for Democratic Change - Ncube or MDC-N [Welshman NCUBE]//Peace Action is Freedom for All or PAFA//United Parties [Abel MUZOREWA]//United People's Party or UPP [Daniel SHUMBA]//Zimbabwe African National Union-Ndonga or ZANU-Ndonga [Wilson KUMBULA]//Zimbabwe African National Union-Patriotic Front or ZANU-PF [Robert Gabriel MUGABE]//Zimbabwe African Peoples Union or ZAPU [Dumiso DABENGWA]//Zimbabwe Youth in Alliance or ZIYA
Crisis in Zimbabwe Coalition//National Constitutional Assembly or NCA [Lovemore MADHUKU]//Women of Zimbabwe Arise or WOZA [Jenni WILLIAMS]//Zimbabwe Congress of Trade Unions or ZCTU [Wellington CHIBEBE]
Justice System & Fundamental RightsBack to top ↑
- Judicial Independence & Court Capability
- Access to Justice & Legal Services
- Fundamental Rights Protection
- Human Rights Institutions & Equality Bodies
mixed legal system of English common law, Roman-Dutch civil law, and customary law
has not submitted an ICJ jurisdiction declaration; non-party state to the ICCt
Internal Security & OrderBack to top ↑
transit point for cannabis and South Asian heroin, mandrax, and methamphetamines en route to South Africa
Regulatory Governance & Strategic ControlsBack to top ↑
- Regulatory Quality & Better Regulation
- Regulatory Delivery & Independent Regulators
- Strategic Controls & Economic Security Administration
Government Effectiveness & Public AdministrationBack to top ↑
- Centre of Government & Policy Coordination
- Civil Service & Public Workforce
- Digital Government & Service Delivery
- Legal Identity & Civil Registration
- Statistical & Data Capability
Public Integrity & Anti-CorruptionBack to top ↑
Transparency, Oversight & AccountabilityBack to top ↑
- Right to Information & Open Government
- Independent Oversight & Supreme Audit
- Independent Media & Journalist Safety
National Resilience & Crisis ManagementBack to top ↑
GINC Capability Domains · Chapter 09
Information and Influence
🇿🇼 Zimbabwe’s identity, media and the projection of influence
Identity and cultureBack to top ↑
English (official), Shona, Sindebele (the language of the Ndebele, sometimes called Ndebele), numerous but minor tribal dialects
syncretic (part Christian, part indigenous beliefs) 50%, Christian 25%, indigenous beliefs 24%, Muslim and other 1%
African 98% (Shona 82%, Ndebele 14%, other 2%), mixed and Asian 1%, white less than 1%
Zimbabwe bird symbol, African fish eagle, flame lily
seven equal horizontal bands of green, yellow, red, black, red, yellow, and green with a white isosceles triangle edged in black with its base on the hoist side; a yellow Zimbabwe bird representing the long history of the country is superimposed on a red five-pointed star in the center of the triangle, which symbolizes peace; green represents agriculture, yellow mineral wealth, red the blood shed to achieve independence, and black stands for the native people
Diplomatic Statecraft & Global NetworksBack to top ↑
- Diplomatic Network & Consular Reach
- Multilateral Leadership & Norm Setting
- Agenda-Setting & Convening
- Mediation & Crisis Diplomacy
ACP, AfDB, AU, COMESA, FAO, G-15, G-77, IAEA, IBRD, ICAO, ICRM, IDA, IFAD, IFC, IFRCS, ILO, IMF, IMO, Interpol, IOC, IOM, IPU, ISO, ITSO, ITU, ITUC (NGOs), MIGA, NAM, OPCW, PCA, SADC, UN, UNAMID, UNCTAD, UNESCO, UNIDO, UNISFA, UNMIL, UNMISS, UNOCI, UNWTO, UPU, WCO, WFTU (NGOs), WHO, WIPO, WMO, WTO
Alliances & Security CooperationBack to top ↑
Development Cooperation & Global AssistanceBack to top ↑
Culture, Language & Education DiplomacyBack to top ↑
- Cultural & Language Institutes
- Creative Industries & Cultural Export Reach
- Heritage & Cultural Institutions
- Education Diplomacy & Alumni Networks
- Sports & Major Events
Diaspora & Global CommunitiesBack to top ↑
Information Environment & Strategic CommunicationBack to top ↑
- Strategic Communications & Public Diplomacy
- International Media & Broadcasting
- Information Defence & Counter-Interference
government owns all local radio and TV stations; foreign shortwave broadcasts and satellite TV are available to those who can afford antennas and receivers; in rural areas, access to TV broadcasts is extremely limited (2007)
GINC Capability Domains · Chapter 10
Financial Strength
🇿🇼 Zimbabwe’s fiscal depth, reserves and the capacity to act
Monetary & Currency CapabilityBack to top ↑
- Monetary Policy & Price Stability
- Exchange Rate & External Account Management
- Currency Issuance & Digital Money
8.5% (2013 est.)//8.2% (2012 est.)
Zimbabwean dollars (ZWD) per US dollar -//234.25 (2010)//234.25 (2009)//9,686.8 (2007)
7.17% (31 December 2010 est.)//975% (31 December 2007)
28% (31 December 2013 est.)//30% (31 December 2012 est.)
$23.03 billion (31 December 2013 est.)//$12.27 billion (31 December 2012 est.)
$22.7 billion (31 December 2012 est.)//$47.61 billion (31 December 2013 est.)
Fiscal Capacity & Public FinanceBack to top ↑
- Revenue Mobilisation & Tax Administration
- Public Expenditure & Budget Management
- Sovereign Debt & Treasury Management
- Public Investment Management
NA% of GDP
NA% of GDP
202.4% of GDP (2013 est.)//244.2% of GDP (2012 est.)
calendar year
Financial System Depth & AccessBack to top ↑
- Banking System Capacity
- Capital Markets Depth & Development
- Long-Term & Institutional Capital
- Financial Inclusion & Household Access
- Development & Policy Finance
$14.06 billion (31 December 2013 est.)//$9.844 billion (31 December 2012 est.)
$NA (31 December 2012 est.)//$10.9 billion (31 December 2011)//$11.48 billion (31 December 2010 est.)
Financial Regulation & IntegrityBack to top ↑
- Prudential Regulation & Supervision
- Financial Integrity & Illicit Finance Control
- Market Conduct & Consumer Protection
- Payment & Market Infrastructure Oversight
Financial Stability & Crisis ManagementBack to top ↑
- Macroprudential & Systemic Oversight
- Crisis Management, Resolution & Deposit Insurance
- External Liquidity & Financial Safety Nets
Sovereign Capital & External Financial PowerBack to top ↑
- Official Reserves Management
- Sovereign Wealth & Public Asset Management
- Currency Internationalisation & Reserve Status
- Capital Account & Flow Management
- International Financial Centre Capability
$437 million (31 December 2013 est.)//$575.6 million (31 December 2012 est.)
$8.445 billion (31 December 2013 est.)//$8.765 billion (31 December 2012 est.)
GINC Capability Domains · Chapter 11
Production and Innovation
🇿🇼 Zimbabwe’s output, industry and the engine of prosperity
Economic Output & ProductivityBack to top ↑
Zimbabwe's economy is growing despite continuing political uncertainty. Following a decade of contraction from 1998 to 2008, Zimbabwe's economy recorded real growth of roughly 10% per year in 2010-11, before slowing in 2012-13 due poor harvests and low diamond revenues. The government of Zimbabwe faces a number of difficult economic problems, including infrastructure and regulatory deficiencies, ongoing indigenization pressure, policy uncertainty, a large external debt burden, and insufficient formal employment. Until early 2009, the Reserve Bank of Zimbabwe routinely printed money to fund the budget deficit, causing hyperinflation. Dollarization in early 2009 - which allowed currencies such as the Botswana pula, the South Africa rand, and the US dollar to be used locally - ended hyperinflation and reduced inflation below 10% per year, but exposed structural weaknesses that continue to inhibit broad-based growth.
$7.496 billion (2013 est.)//$7.265 billion (2012 est.)//$6.957 billion (2011 est.)
3.2% (2013 est.)//4.4% (2012 est.)//10.6% (2011 est.)
$600 (2013 est.)//$600 (2012 est.)//$500 (2011 est.)
$10.48 billion (2013 est.)
Labour & EmploymentBack to top ↑
- Employment & Labour Force Participation
- Labour Market Institutions & Wage Setting
- Employment Services & Skills Matching
- Labour Adjustment, Transition & Formalisation
3.939 million (2013 est.)
95% (2009 est.)//80% (2005 est.)
Industrial & Sectoral BaseBack to top ↑
- Manufacturing & Advanced Industry
- Foundational & Process Industries
- Agrifood & Primary Production
- Services Economy
corn, cotton, tobacco, wheat, coffee, sugarcane, peanuts; sheep, goats, pigs
mining (coal, gold, platinum, copper, nickel, tin, diamonds, clay, numerous metallic and nonmetallic ores), steel; wood products, cement, chemicals, fertilizer, clothing and footwear, foodstuffs, beverages
3.7% (2013 est.)
Structural Transformation & ComplexityBack to top ↑
Business Dynamism & EntrepreneurshipBack to top ↑
- Entrepreneurship & Firm Creation
- Risk Capital & Scale-Up Finance
- Firm Growth, Exit & Renewal
- Competition & Market Contestability
Innovation & CommercialisationBack to top ↑
- Business Innovation Capability
- Research Commercialisation & Knowledge Transfer
- Intellectual Property & Intangible Assets
- Innovation Ecosystems & Clusters
Technology Adoption & DiffusionBack to top ↑
GINC Capability Domains · Chapter 12
Trade and Investment
🇿🇼 Zimbabwe’s markets, capital and the terms of global exchange
Overall tradeBack to top ↑
$7.99B of exports to 134 partners and $9.57B of imports from 135 in 2024, a deficit of $1.58B.
- Exports
- $7.99B134 partners
- Imports
- $9.57B135 partners
- Balance
- −$1.58Bdeficit
- Total trade
- $17.6B2024
ExportsBack to top ↑
Where its exports go
The largest partners in 2024, with each one's share of the nation's exports.
| Partner | Value | Share | |
|---|---|---|---|
| United Arab Emirates | $2.72B | 34% | |
| China | $2.13B | 27% | |
| South Africa | $1.38B | 17% | |
| Mozambique | $248M | 3.1% | |
| Zambia | $168M | 2.1% | |
| Indonesia | $125M | 1.6% | |
| India | $113M | 1.4% | |
| Belgium | $111M | 1.4% | |
| Germany | $101M | 1.3% | |
| France | $78.8M | 1.0% | |
| Vietnam | $71.7M | 0.9% | |
| Hong Kong | $69.8M | 0.9% | |
| United States | $69.0M | 0.9% | |
| Netherlands | $54.1M | 0.7% | |
| Poland | $47.6M | 0.6% | |
| Italy | $46.8M | 0.6% | |
| Botswana | $39.1M | 0.5% | |
| Malawi | $29.3M | 0.4% | |
| Spain | $27.9M | 0.3% | |
| Turkey | $23.5M | 0.3% |
What it exports
The largest categories in 2024.
| Category | Value | Share | |
|---|---|---|---|
| Pearls, precious stones, metals, coins | $2.85B | 36% | |
| Tobacco and manufactures tobacco substitutes | $1.45B | 18% | |
| Nickel | $986M | 12% | |
| Ores slag and ash | $674M | 8.4% | |
| Salt, sulphur, earth, stone, plaster, lime and cement | $671M | 8.4% | |
| Iron and steel | $474M | 5.9% | |
| Mineral fuels, oils, distillation products | $233M | 2.9% | |
| Edible fruits, nuts, peel of citrus fruit, melons | $138M | 1.7% | |
| Raw hides and skins (other than furskins) and leather | $99.2M | 1.2% | |
| Sugars and sugar confectionery | $60.3M | 0.8% | |
| Coffee, tea, mate and spices | $30.2M | 0.4% | |
| Cotton | $26.8M | 0.3% | |
| Machinery, nuclear reactors, boilers | $20.4M | 0.3% | |
| Cereals | $17.4M | 0.2% | |
| Electrical, electronic equipment | $16.6M | 0.2% |
ImportsBack to top ↑
Where its imports come from
The largest partners in 2024, with each one's share of the nation's imports.
| Partner | Value | Share | |
|---|---|---|---|
| South Africa | $3.76B | 39% | |
| China | $1.43B | 15% | |
| Bahamas | $732M | 7.6% | |
| Mozambique | $414M | 4.3% | |
| Singapore | $335M | 3.5% | |
| Zambia | $311M | 3.3% | |
| United Arab Emirates | $304M | 3.2% | |
| Bahrain | $275M | 2.9% | |
| Mauritius | $205M | 2.1% | |
| India | $204M | 2.1% | |
| Hong Kong | $176M | 1.8% | |
| United Kingdom | $134M | 1.4% | |
| Japan | $110M | 1.2% | |
| Thailand | $98.6M | 1.0% | |
| Germany | $80.8M | 0.8% | |
| Switzerland | $69.9M | 0.7% | |
| United States | $63.3M | 0.7% | |
| Namibia | $58.6M | 0.6% | |
| Italy | $58.2M | 0.6% | |
| Egypt | $56.6M | 0.6% |
What it imports
The largest categories in 2024.
| Category | Value | Share | |
|---|---|---|---|
| Mineral fuels, oils, distillation products | $2.01B | 21% | |
| Machinery, nuclear reactors, boilers | $1.22B | 13% | |
| Cereals | $941M | 9.8% | |
| Vehicles other than railway, tramway | $697M | 7.3% | |
| Electrical, electronic equipment | $575M | 6.0% | |
| Plastics | $375M | 3.9% | |
| Fertilizers | $346M | 3.6% | |
| Animal, vegetable fats and oils, cleavage products | $300M | 3.1% | |
| Articles of iron or steel | $280M | 2.9% | |
| Iron and steel | $251M | 2.6% | |
| Pharmaceutical products | $190M | 2.0% | |
| Miscellaneous chemical products | $189M | 2.0% | |
| Paper and paperboard, articles of pulp, paper and board | $174M | 1.8% | |
| Salt, sulphur, earth, stone, plaster, lime and cement | $140M | 1.5% | |
| Inorganic chemicals, precious metal compound, isotope | $121M | 1.3% |
In a list, the bar runs to the largest in that list. The line is each figure’s history from 2000, drawn to its own peak: it shows the shape of the years, and the value shows the size.
External balanceBack to top ↑
-$576 million (2013 est.)//-$416.5 million (2012 est.)
Trade Facilitation & LogisticsBack to top ↑
Trade Policy & Market AccessBack to top ↑
- Trade Policy & Negotiation Capability
- Market Access & Agreements Network
- Trade Law & Enforcement
- Standards, Conformity & Quality Infrastructure
Digital & Services TradeBack to top ↑
- Services Trade Capability
- Digital Trade & E-Commerce
- Data Flows & Digital Trade Governance
- Tourism & Visitor Economy
Investment Attraction & ProjectionBack to top ↑
- Investment Attraction & Facilitation
- Investment Absorption & Linkages
- Outward Investment & Global Corporate Presence
$NA
$NA
Export Capability & SophisticationBack to top ↑
$3.144 billion (2013 est.)//$3.314 billion (2012 est.)
China 21.1%, South Africa 15.1%, Democratic Republic of the Congo 12.1%, Botswana 10.8%, Italy 4.6% (2012)
platinum, cotton, tobacco, gold, ferroalloys, textiles/clothing
Global Value Chain PositionBack to top ↑
- Value Chain Participation & Integration
- Value Chain Position & Upgrading
- Regional Integration & Hub Anchoring
Economic Leverage & DependenceBack to top ↑
- Strategic Supply Security
- Concentration Risk & Revenue Stabilisation
- Economic Leverage & Coercion Resistance
$4.571 billion (2013 est.)//$4.569 billion (2012 est.)
South Africa 51.9%, China 10% (2012)
machinery and transport equipment, other manufactures, chemicals, fuels, food products
Zimbabwe · you are in
Historical Context
Foundations
GINC Capability Domains
Find in this brief · Zimbabwe