
DRC
DRC is a republic in Africa, home to 77 million people, with its capital at Kinshasa, and the world’s 11th-largest country by area.
Contents
12 chapters
Foundations
01–03
At a glance
- Area
- 2.3Mkm²#11 World#2 Africa
- Population
- 77.4M#19 World#4 Africa
- GDP (market)
- $18.6B
- GDP (PPP)
- $29.4B#114 World#19 Africa
- GDP per capita
- $400#228 World#56 Africa
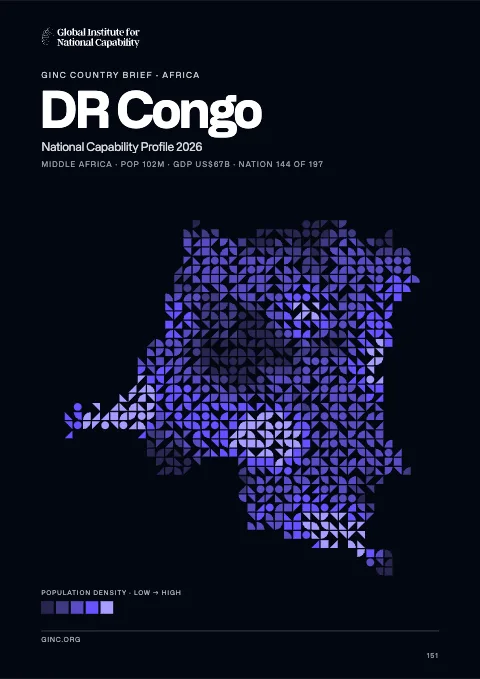
The whole brief
DRC National Capability Profile 2026
Foundations · Chapter 01
Historical Context
🇨🇩 DRC’s understanding the origins and evolution of the modern nation
BackgroundBack to top ↑
Established as a Belgian colony in 1908, the then-Republic of the Congo gained its independence in 1960, but its early years were marred by political and social instability. Col. Joseph MOBUTU seized power and declared himself president in a November 1965 coup. He subsequently changed his name - to MOBUTU Sese Seko - as well as that of the country - to Zaire. MOBUTU retained his position for 32 years through several sham elections, as well as through brutal force. Ethnic strife and civil war, touched off by a massive inflow of refugees in 1994 from fighting in Rwanda and Burundi, led in May 1997 to the toppling of the MOBUTU regime by a rebellion backed by Rwanda and Uganda and fronted by Laurent KABILA. He renamed the country the Democratic Republic of the Congo (DRC), but in August 1998 his regime was itself challenged by a second insurrection again backed by Rwanda and Uganda. Troops from Angola, Chad, Namibia, Sudan, and Zimbabwe intervened to support KABILA's regime. In January 2001, KABILA was assassinated and his son, Joseph KABILA, was named head of state. In October 2002, the new president was successful in negotiating the withdrawal of Rwandan forces occupying the eastern DRC; two months later, the Pretoria Accord was signed by all remaining warring parties to end the fighting and establish a government of national unity. A transitional government was set up in July 2003; it held a successful constitutional referendum in December 2005 and elections for the presidency, National Assembly, and provincial legislatures took place in 2006. In 2009, following a resurgence of conflict in the eastern DRC, the government signed a peace agreement with the National Congress for the Defense of the People (CNDP), a primarily Tutsi rebel group. An attempt to integrate CNDP members into the Congolese military failed, prompting their defection in 2012 and the formation of the M23 armed group - named after the 23 March 2009 peace agreements. Renewed conflict has lead to the displacement of large numbers of people and significant human rights abuses. As of February 2013, peace talks between the Congolese government and the M23 were on-going. In addition, the DRC continues to experience violence committed by other armed groups including the Democratic Forces for the Liberation of Rwanda and Mai Mai groups. In the most recent national elections, held in November 2011, disputed results allowed Joseph KABILA to be reelected to the presidency.
IndependenceBack to top ↑
30 June 1960 (from Belgium)
National holidayBack to top ↑
Independence Day, 30 June (1960)
Foundations · Chapter 02
Geography
🇨🇩 DRC’s territory, resources and strategic position
Location and areaBack to top ↑
Central Africa, northeast of Angola
0 00 N, 25 00 E
Africa
slightly less than one-fourth the size of the US
37 km
Terrain and resourcesBack to top ↑
vast central basin is a low-lying plateau; mountains in east
cobalt, copper, niobium, tantalum, petroleum, industrial and gem diamonds, gold, silver, zinc, manganese, tin, uranium, coal, hydropower, timber
105 sq km (2003)
Settlement and hazardsBack to top ↑
periodic droughts in south; Congo River floods (seasonal); active volcanoes in the east along the Great Rift Valley
second largest country in Africa (after Algeria) and largest country in Sub-Saharan Africa; straddles the equator; has narrow strip of land that controls the lower Congo River and is only outlet to South Atlantic Ocean; dense tropical rain forest in central river basin and eastern highlands
OtherBack to top ↑
1,283 cu km (2011)
poaching threatens wildlife populations; water pollution; deforestation; refugees responsible for significant deforestation, soil erosion, and wildlife poaching; mining of minerals (coltan - a mineral used in creating capacitors, diamonds, and gold) causing environmental damage
Foundations · Chapter 03
Environment
🇨🇩 DRC’s environmental conditions, resources and national resilience
ClimateBack to top ↑
tropical; hot and humid in equatorial river basin; cooler and drier in southern highlands; cooler and wetter in eastern highlands; north of Equator - wet season (April to October), dry season (December to February); south of Equator - wet season (November to March), dry season (April to October)
Emissions and pollutionBack to top ↑
Water, waste and foodBack to top ↑
Resources and agreementsBack to top ↑
GINC Capability Domains · Chapter 04
Critical Technology
🇨🇩 DRC’s technology frontiers and the pursuit of national advantage
Two counts are set side by side for 2015–2024: on the left, the papers researchers in DRC published; on the right, the patent families that began there and were filed in more than one country. First by capability group, then group by group with each group’s capabilities. The badge on a card is the nation’s place among all nations. Papers are from GINC Research Analytics, patent families from GINC Patents.
Research by capability group
#130 WorldPapers published, 2015–2024
Patents by capability group
#118 WorldInternational patent families, 2015–2024
Advanced Materials & ManufacturingBack to top ↑
Research
#155 WorldPapers published, 2015–2024
Patents
International patent families, 2015–2024
No international patent families on record for 2015–2024.
Energy TechnologiesBack to top ↑
Research
#142 WorldPapers published, 2015–2024
Patents
International patent families, 2015–2024
No international patent families on record for 2015–2024.
Semiconductors & Advanced ComputingBack to top ↑
Research
#136 WorldPapers published, 2015–2024
No research topic: Semiconductor Design & EDA · Advanced Semiconductor Fabrication · Semiconductor Equipment & Materials · Advanced Packaging & Heterogeneous Integration
Patents
International patent families, 2015–2024
No international patent families on record for 2015–2024.
Artificial IntelligenceBack to top ↑
Research
#140 WorldPapers published, 2015–2024
Patents
International patent families, 2015–2024
No international patent families on record for 2015–2024.
Quantum TechnologiesBack to top ↑
Connectivity, Cyber & Trust TechnologiesBack to top ↑
Research
#139 WorldPapers published, 2015–2024
Patents
#93 WorldInternational patent families, 2015–2024
Sensing, Timing & NavigationBack to top ↑
Research
#120 WorldPapers published, 2015–2024
Patents
International patent families, 2015–2024
No international patent families on record for 2015–2024.
Robotics & Autonomous SystemsBack to top ↑
Research
#141 WorldPapers published, 2015–2024
No research topic: Human-Machine Interfaces
Patents
International patent families, 2015–2024
No international patent families on record for 2015–2024.
Biotechnology & Health TechnologiesBack to top ↑
Research
#96 WorldPapers published, 2015–2024
Patents
#94 WorldInternational patent families, 2015–2024
Medicine and BioTech
Clinical research and life-science invention, drawn from the same series that drive the metric pages. Each card opens the full cross-country comparison.
Space TechnologiesBack to top ↑
- Space Launch & Reusable Systems
- Advanced Propulsion & Hypersonic Systems
- Satellite & Constellation Technologies
GINC Capability Domains · Chapter 05
Strategic Infrastructure
🇨🇩 DRC’s energy, connectivity and the material foundations of capability
Resource InfrastructureBack to top ↑
20,000 bbl/day (2012 est.)
22,240 bbl/day (2010 est.)
0 bbl/day (2010 est.)
180 million bbl (1 January 2013 est.)
0 bbl/day (2010 est.)
10,240 bbl/day (2011 est.)
0 bbl/day (2010 est.)
16,200 bbl/day (2010 est.)
0 cu m (2011 est.)
0 cu m (2010 est.)
0 cu m (2011 est.)
0 cu m (2011 est.)
991.1 million cu m (1 January 2013 est.)
gas 62 km; oil 77 km; refined products 756 km (2013)
Agriculture & Food InfrastructureBack to top ↑
- Irrigation & Agricultural Water
- Livestock & Veterinary
- Fisheries & Aquaculture
- Storage, Cold Chain & Markets
Energy InfrastructureBack to top ↑
- Thermal Generation
- Nuclear Generation
- Nuclear Fuel Cycle & Radioactive Waste
- Hydropower
- Renewable Generation
- Transmission & Distribution
- System Control & Dispatch
- Storage & Fuel Supply
2.437 million kW (2010 est.)
7.804 billion kWh (2010 est.)
6.197 billion kWh (2010 est.)
916 million kWh (2010 est.)
161 million kWh (2010 est.)
1.4% of total installed capacity (2010 est.)
0% of total installed capacity (2010 est.)
98.6% of total installed capacity (2010 est.)
0% of total installed capacity (2010 est.)
2.721 million Mt (2011 est.)
Water, Sanitation & Waste InfrastructureBack to top ↑
- Dams, Reservoirs & Flood Defence
- Water Supply & Treatment
- Bulk Water Transfer & Desalination
- Wastewater & Sanitation
- Solid Waste & Recycling
Advanced ManufacturingBack to top ↑
- Materials & Inputs
- Chemicals & Hazardous Process Industry
- Production Systems
- Supply Chain & Ecosystem
- Workforce & Innovation
Transport InfrastructureBack to top ↑
- Seaports & Terminals
- Air Infrastructure
- Air Navigation & Traffic Management
- Inland Waterways & Ferries
- Rail Infrastructure
- Roads & Bridges
- Logistics, Multimodal & Border Infrastructure
- Postal & Parcel
198 (2013)
1 (2013)
15,000 km (including the Congo, its tributaries, and unconnected lakes) (2011)
Communications & Digital InfrastructureBack to top ↑
- Subsea Cables & International Gateways
- Core & Backbone Networks
- Mobile & Wireless Networks
- Spectrum & Broadcasting
- Data Centres, Compute & Cloud
- Data Resources
- AI Tools & Applications
58,200 (2012)
19.487 million (2012)
290,000 (2008)
2,515 (2012)
.cd
Financial InfrastructureBack to top ↑
- Currency & Reserves
- Payments & Settlement Systems
- Markets, Exchanges & Depositories
- Banks, Insurers & Systemic Institutions
Social InfrastructureBack to top ↑
- Health Infrastructure
- Public Health & Laboratories
- Medical Supply & Stockpiles
- Education & Skills Infrastructure
- Research & Scientific Facilities
- Housing, Community & Social Services
- Government & Public Administration
- Cultural, Community & Recreational Infrastructure
- Justice & Corrections
- Emergency Services & Civil Protection
- Hydrometeorology & Early Warning
Space, Aerospace & Defence InfrastructureBack to top ↑
GINC Capability Domains · Chapter 06
National Security
🇨🇩 DRC’s force, intelligence and the defence of the nation
Disputes and terrorismBack to top ↑
heads of the Great Lakes states and UN pledged in 2004 to abate tribal, rebel, and militia fighting in the region, including northeast Congo, where the UN Organization Mission in the Democratic Republic of the Congo (MONUC), organized in 1999, maintains over 16,500 uniformed peacekeepers; members of Uganda's Lords Resistance Army forces continue to seek refuge in Congo's Garamba National Park as peace talks with the Uganda government evolve; the location of the boundary in the broad Congo River with the Republic of the Congo is indefinite except in the Pool Malebo/Stanley Pool area; Uganda and DRC dispute Rukwanzi Island in Lake Albert and other areas on the Semliki River with hydrocarbon potential; boundary commission continues discussions over Congolese-administered triangle of land on the right bank of the Lunkinda River claimed by Zambia near the DRC village of Pweto; DRC accuses Angola of shifting monuments
Force Generation & MobilisationBack to top ↑
Armed Forces of the Democratic Republic of the Congo (Forces d'Armees de la Republique Democratique du Congo, FARDC): Army, National Navy (La Marine Nationale), Congolese Air Force (Force Aerienne Congolaise, FAC) (2011)
18-45 years of age for voluntary and compulsory military service (2012)
1.72% of GDP (2012)//1.53% of GDP (2011)//1.72% of GDP (2010)
Forces under arms
Active-duty strength on the Correlates of War series, which reaches back to 1816 and so carries a nation’s whole record of mobilisation rather than its present establishment. The card opens the full cross-country comparison.
Intelligence & AssessmentBack to top ↑
- Imagery & Geospatial Intelligence
- Signals & Cyber Intelligence
- Technical & Measurement Intelligence
- Open-Source & Financial Intelligence
- Human Intelligence & Counterintelligence
- All-Source Analysis & Warning
Joint Command, Projection & SustainmentBack to top ↑
- Command, Control & Communications
- Strategic Lift & Mobility
- Expeditionary & Peace Operations
- Operational Sustainment & War Reserves
- Defence Industrial Mobilisation
- CBRN Defence
Land PowerBack to top ↑
- Combined Arms Manoeuvre
- Land Fires
- Battlefield Aviation & Uncrewed Systems
- Special Operations & Irregular Warfare
Maritime PowerBack to top ↑
- Maritime Security & Constabulary
- Sea Denial & Undersea Warfare
- Sea Control
- Amphibious & Expeditionary Operations
Air PowerBack to top ↑
- Air Sovereignty & Policing
- Control of the Air
- Air Strike & Interdiction
- Airborne ISR, Early Warning & Battle Management
Strategic Strike & Missile DefenceBack to top ↑
Space OperationsBack to top ↑
Cyber & Electromagnetic OperationsBack to top ↑
Nuclear DeterrenceBack to top ↑
GINC Capability Domains · Chapter 07
Human Capital
🇨🇩 DRC’s population, health and the skills that sustain capability
DemographyBack to top ↑
77,433,744
2.5% (2014 est.)
35.62 births/1,000 population (2014 est.)
10.3 deaths/1,000 population (2014 est.)
4.8 children born/woman (2014 est.)
20.2
17.7% (2010)
Migration and urbanisationBack to top ↑
-0.33 migrant(s)/1,000 population (2014 est.)
KINSHASA (capital) 8.798 million; Lubumbashi 1.556 million; Mbuji-Mayi 1.504 million; Kananga 888,000; Kisangani 820,000 (2011)
Welfare and equityBack to top ↑
71% (2006 est.)
DisplacementBack to top ↑
Early Childhood DevelopmentBack to top ↑
28.2% (2007)
Foundational EducationBack to top ↑
2.5% of GDP (2010)
Advanced EducationBack to top ↑
Technical & Vocational SkillsBack to top ↑
Digital & AI CompetenceBack to top ↑
Generative AI adoption
Modelled share of working-age adults using generative AI, from Microsoft telemetry scaled to each country’s 15–64 population. A measure of how fast a workforce is absorbing the technology rather than of how much of it a nation builds. The card opens the full cross-country comparison.
Lifelong Learning & ReskillingBack to top ↑
Research Talent & Knowledge CreationBack to top ↑
Population HealthBack to top ↑
540 deaths/100,000 live births (2010)
1.7% (2008)
1.1% (2012 est.)
481,500 (2012 est.)
31,700 (2012 est.)
Health System CapabilityBack to top ↑
8.5% of GDP (2011)
0.11 physicians/1,000 population (2004)
0.8 beds/1,000 population (2006)
GINC Capability Domains · Chapter 08
Governance and Integrity
🇨🇩 DRC’s institutions, law and the integrity of the state
State structureBack to top ↑
republic
10 provinces (provinces, singular - province) and 1 city* (ville); Bandundu, Bas-Congo (Lower Congo), Equateur, Kasai-Occidental (West Kasai), Kasai-Oriental (East Kasai), Katanga, Kinshasa*, Maniema, Nord-Kivu (North Kivu), Orientale, Sud-Kivu (South Kivu)
several previous; latest adopted 13 May 2005, approved by referendum 18-19 December 2005, promulgated 18 February 2006; revised 2011 (2011)
18 years of age; universal and compulsory
Political Institutions & Civic ParticipationBack to top ↑
- Electoral Management & Integrity
- Legislature & Deliberative Institutions
- Citizen Participation & Civic Space
bicameral legislature consists of a Senate (108 seats; members elected by provincial assemblies to serve five-year terms) and a National Assembly (500 seats; 61 members elected by majority vote in single-member constituencies, 439 members elected by open list proportional-representation in multi-member constituencies to serve five-year terms)
Christian Democrat Party or PDC [Jose ENDUNDO]//Congolese Rally for Democracy or RCD [Azarias RUBERWA]//Convention of Christian Democrats or CDC//Forces of Renewal or FR [Mbusa NYAMWISI]//Movement for the Liberation of the Congo or MLC [Jean-Pierre BEMBA]//People's Party for Reconstruction and Democracy or PPRD [Evariste BOSHAB]//Social Movement for Renewal or MSR [Pierre LUMBI]//Unified Lumumbist Party or PALU [Antoine GIZENGA]//Union for the Congolese Nation or UNC [Vital KAMERHE]//Union for Democracy and Social Progress or UDPS [Etienne TSHISEKEDI]//Union of Mobutuist Democrats or UDEMO [MOBUTU Nzanga]
FARDC (Forces Armées de la République Démocratique du Congo) - Army of the Democratic Republic of the Congo, which commits atrocities on citizens//FDLR (Forces Democratiques de Liberation du Rwanda) - Rwandan militia group made up of some of the perpetrators of Rwanda's Genocide in 1994//CNDP (National Congress for the Defense of the People) - mainly Congolese Tutsis who want refugees returned and more representation in government//M23 - rebel group comprised largely from ex-CNDP forces
Justice System & Fundamental RightsBack to top ↑
- Judicial Independence & Court Capability
- Access to Justice & Legal Services
- Fundamental Rights Protection
- Human Rights Institutions & Equality Bodies
civil legal system based on Belgian version of French civil law
accepts compulsory ICJ jurisdiction with reservations; accepts ICCt jurisdiction
Internal Security & OrderBack to top ↑
one of Africa's biggest producers of cannabis, but mostly for domestic consumption; traffickers exploit lax shipping controls to transit pseudoephedrine through the capital; while rampant corruption and inadequate supervision leaves the banking system vulnerable to money laundering, the lack of a well-developed financial system limits the country's utility as a money-laundering center (2008)
Regulatory Governance & Strategic ControlsBack to top ↑
- Regulatory Quality & Better Regulation
- Regulatory Delivery & Independent Regulators
- Strategic Controls & Economic Security Administration
Government Effectiveness & Public AdministrationBack to top ↑
- Centre of Government & Policy Coordination
- Civil Service & Public Workforce
- Digital Government & Service Delivery
- Legal Identity & Civil Registration
- Statistical & Data Capability
Public Integrity & Anti-CorruptionBack to top ↑
Transparency, Oversight & AccountabilityBack to top ↑
- Right to Information & Open Government
- Independent Oversight & Supreme Audit
- Independent Media & Journalist Safety
National Resilience & Crisis ManagementBack to top ↑
GINC Capability Domains · Chapter 09
Information and Influence
🇨🇩 DRC’s identity, media and the projection of influence
Identity and cultureBack to top ↑
French (official), Lingala (a lingua franca trade language), Kingwana (a dialect of Kiswahili or Swahili), Kikongo, Tshiluba
Roman Catholic 50%, Protestant 20%, Kimbanguist 10%, Muslim 10%, other (includes syncretic sects and indigenous beliefs) 10%
over 200 African ethnic groups of which the majority are Bantu; the four largest tribes - Mongo, Luba, Kongo (all Bantu), and the Mangbetu-Azande (Hamitic) make up about 45% of the population
leopard
sky blue field divided diagonally from the lower hoist corner to upper fly corner by a red stripe bordered by two narrow yellow stripes; a yellow, five-pointed star appears in the upper hoist corner; blue represents peace and hope, red the blood of the country's martyrs, and yellow the country's wealth and prosperity; the star symbolizes unity and the brilliant future for the country
Diplomatic Statecraft & Global NetworksBack to top ↑
- Diplomatic Network & Consular Reach
- Multilateral Leadership & Norm Setting
- Agenda-Setting & Convening
- Mediation & Crisis Diplomacy
ACP, AfDB, AU, CEPGL, COMESA, EITI (candidate country), FAO, G-24, G-77, IAEA, IBRD, ICAO, ICRM, IDA, IFAD, IFC, IFRCS, IHO, ILO, IMF, IMO, Interpol, IOC, IOM, IPU, ISO, ITSO, ITU, ITUC (NGOs), MIGA, NAM, OIF, OPCW, PCA, SADC, UN, UNCTAD, UNESCO, UNHCR, UNIDO, UNWTO, UPU, WCO, WFTU (NGOs), WHO, WIPO, WMO, WTO
Alliances & Security CooperationBack to top ↑
Development Cooperation & Global AssistanceBack to top ↑
Culture, Language & Education DiplomacyBack to top ↑
- Cultural & Language Institutes
- Creative Industries & Cultural Export Reach
- Heritage & Cultural Institutions
- Education Diplomacy & Alumni Networks
- Sports & Major Events
Diaspora & Global CommunitiesBack to top ↑
Information Environment & Strategic CommunicationBack to top ↑
- Strategic Communications & Public Diplomacy
- International Media & Broadcasting
- Information Defence & Counter-Interference
state-owned TV broadcast station with near national coverage; more than a dozen privately owned TV stations with 2 having near national coverage; 2 state-owned radio stations are supplemented by more than 100 private radio stations; transmissions of at least 2 international broadcasters are available (2007)
GINC Capability Domains · Chapter 10
Financial Strength
🇨🇩 DRC’s fiscal depth, reserves and the capacity to act
Monetary & Currency CapabilityBack to top ↑
- Monetary Policy & Price Stability
- Exchange Rate & External Account Management
- Currency Issuance & Digital Money
7.1% (2013 est.)//9.5% (2012 est.)
Congolese francs (CDF) per US dollar -//918 (2013 est.)//920.25 (2012 est.)//905.91 (2010 est.)//472.19 (2009)//559 (2008)
4% (31 December 2012 est.)//20% (31 December 2011 est.)
18.6% (31 December 2013 est.)//28.45% (31 December 2012 est.)
$1.06 billion (31 December 2013 est.)//$986.6 million (31 December 2012 est.)
$3.502 billion (31 December 2013 est.)//$3.042 billion (31 December 2012 est.)
Fiscal Capacity & Public FinanceBack to top ↑
- Revenue Mobilisation & Tax Administration
- Public Expenditure & Budget Management
- Sovereign Debt & Treasury Management
- Public Investment Management
31.3% of GDP (2013 est.)
-3.5% of GDP (2013 est.)
calendar year
Financial System Depth & AccessBack to top ↑
- Banking System Capacity
- Capital Markets Depth & Development
- Long-Term & Institutional Capital
- Financial Inclusion & Household Access
- Development & Policy Finance
$1.862 billion (31 December 2013 est.)//$1.708 billion (31 December 2012 est.)
$NA
Financial Regulation & IntegrityBack to top ↑
- Prudential Regulation & Supervision
- Financial Integrity & Illicit Finance Control
- Market Conduct & Consumer Protection
- Payment & Market Infrastructure Oversight
Financial Stability & Crisis ManagementBack to top ↑
- Macroprudential & Systemic Oversight
- Crisis Management, Resolution & Deposit Insurance
- External Liquidity & Financial Safety Nets
Sovereign Capital & External Financial PowerBack to top ↑
- Official Reserves Management
- Sovereign Wealth & Public Asset Management
- Currency Internationalisation & Reserve Status
- Capital Account & Flow Management
- International Financial Centre Capability
$1.582 billion (31 December 2013 est.)//$1.633 billion (31 December 2012 est.)
$6.874 billion (31 December 2013 est.)//$6.087 billion (31 December 2012 est.)
GINC Capability Domains · Chapter 11
Production and Innovation
🇨🇩 DRC’s output, industry and the engine of prosperity
Economic Output & ProductivityBack to top ↑
The economy of the Democratic Republic of the Congo - a nation endowed with vast natural resource wealth - is slowly recovering after decades of decline. Systemic corruption since independence in 1960, combined with country-wide instability and conflict that began in the mid-90s has dramatically reduced national output and government revenue and increased external debt. With the installation of a transitional government in 2003 after peace accords, economic conditions slowly began to improve as the transitional government reopened relations with international financial institutions and international donors, and President KABILA began implementing reforms. Progress has been slow to reach the interior of the country although clear changes are evident in Kinshasa and Lubumbashi. An uncertain legal framework, corruption, and a lack of transparency in government policy are long-term problems for the mining sector and for the economy as a whole. Much economic activity still occurs in the informal sector and is not reflected in GDP data. Renewed activity in the mining sector, the source of most export income, has boosted Kinshasa's fiscal position and GDP growth in recent years. The global recession cut economic growth in 2009 to less than half its 2008 level, but growth returned to around 7% per year in 2010-12. The DRC signed a Poverty Reduction and Growth Facility with the IMF in 2009 and received $12 billion in multilateral and bilateral debt relief in 2010, but the IMF at the end of 2012 suspended the last three payments under the loan facility - worth $240 million - because of concerns about the lack of transparency in mining contracts. In 2012, the DRC updated its business laws by adhering to OHADA, the Organization for the Harmonization of Business Law in Africa. The country marked its tenth consecutive year of positive economic expansion in 2012.
$29.39 billion (2013 est.)//$27.66 billion (2012 est.)//$25.82 billion (2011 est.)
6.2% (2013 est.)//7.2% (2012 est.)//6.9% (2011 est.)
$400 (2013 est.)//$400 (2012 est.)//$400 (2011 est.)
$18.56 billion (2013 est.)
Labour & EmploymentBack to top ↑
- Employment & Labour Force Participation
- Labour Market Institutions & Wage Setting
- Employment Services & Skills Matching
- Labour Adjustment, Transition & Formalisation
35.18 million (2013 est.)
NA%
Industrial & Sectoral BaseBack to top ↑
- Manufacturing & Advanced Industry
- Foundational & Process Industries
- Agrifood & Primary Production
- Services Economy
coffee, sugar, palm oil, rubber, tea, cotton, cocoa, quinine, cassava (manioc), bananas, plantains, peanuts, root crops, corn, fruits; wood products
mining (copper, cobalt, gold, diamonds, coltan, zinc, tin, tungsten), mineral processing, consumer products (textiles, plastics, footwear, cigarettes), metal products, processed foods and beverages, timber, cement, commercial ship repair
12% (2013 est.)
Structural Transformation & ComplexityBack to top ↑
Business Dynamism & EntrepreneurshipBack to top ↑
- Entrepreneurship & Firm Creation
- Risk Capital & Scale-Up Finance
- Firm Growth, Exit & Renewal
- Competition & Market Contestability
Innovation & CommercialisationBack to top ↑
- Business Innovation Capability
- Research Commercialisation & Knowledge Transfer
- Intellectual Property & Intangible Assets
- Innovation Ecosystems & Clusters
Technology Adoption & DiffusionBack to top ↑
GINC Capability Domains · Chapter 12
Trade and Investment
🇨🇩 DRC’s markets, capital and the terms of global exchange
Overall tradeBack to top ↑
$29.6B of exports to 91 partners and $11.5B of imports from 88 in 2024, a surplus of $18.1B.
- Exports
- $29.6B91 partners
- Imports
- $11.5B88 partners
- Balance
- +$18.1Bsurplus
- Total trade
- $41.1B2024
ExportsBack to top ↑
Where its exports go
The largest partners in 2024, with each one's share of the nation's exports.
| Partner | Value | Share | |
|---|---|---|---|
| China | $21.6B | 73% | |
| South Korea | $966M | 3.3% | |
| India | $864M | 2.9% | |
| Saudi Arabia | $861M | 2.9% | |
| Spain | $734M | 2.5% | |
| Egypt | $662M | 2.2% | |
| Belgium | $443M | 1.5% | |
| Italy | $411M | 1.4% | |
| Thailand | $371M | 1.3% | |
| United States | $326M | 1.1% | |
| Zambia | $320M | 1.1% | |
| Malaysia | $315M | 1.1% | |
| Germany | $278M | 0.9% | |
| Serbia | $223M | 0.8% | |
| Namibia | $180M | 0.6% | |
| Netherlands | $164M | 0.6% | |
| Canada | $161M | 0.5% | |
| France | $153M | 0.5% | |
| South Africa | $90.8M | 0.3% | |
| Bahrain | $86.2M | 0.3% |
What it exports
The largest categories in 2024.
| Category | Value | Share | |
|---|---|---|---|
| Copper | $20.7B | 70% | |
| Ores slag and ash | $3.86B | 13% | |
| Base metals not specified elsewhere, cermets | $3.05B | 10% | |
| Mineral fuels, oils, distillation products | $628M | 2.1% | |
| Pearls, precious stones, metals, coins | $528M | 1.8% | |
| Cocoa and cocoa preparations | $351M | 1.2% | |
| Inorganic chemicals, precious metal compound, isotope | $224M | 0.8% | |
| Wood and articles of wood, wood charcoal | $126M | 0.4% | |
| Coffee, tea, mate and spices | $28.9M | <0.1% | |
| Residues, wastes of food industry, animal fodder | $20.3M | <0.1% | |
| Oil seed, oleaginous fruits, grain, seed, fruits | $12.6M | <0.1% | |
| Rubbers | $12.0M | <0.1% | |
| Iron and steel | $9.34M | <0.1% | |
| Aluminum | $8.86M | <0.1% | |
| Nickel | $6.51M | <0.1% |
ImportsBack to top ↑
Where its imports come from
The largest partners in 2024, with each one's share of the nation's imports.
| Partner | Value | Share | |
|---|---|---|---|
| China | $4.33B | 38% | |
| South Africa | $1.36B | 12% | |
| Zambia | $1.20B | 10% | |
| India | $544M | 4.7% | |
| Uganda | $478M | 4.2% | |
| Belgium | $373M | 3.2% | |
| Tanzania | $313M | 2.7% | |
| United States | $240M | 2.1% | |
| Kenya | $236M | 2.0% | |
| France | $222M | 1.9% | |
| Namibia | $216M | 1.9% | |
| Brazil | $191M | 1.7% | |
| Angola | $173M | 1.5% | |
| Japan | $157M | 1.4% | |
| Turkey | $136M | 1.2% | |
| Poland | $134M | 1.2% | |
| Germany | $134M | 1.2% | |
| Netherlands | $88.3M | 0.8% | |
| Italy | $82.1M | 0.7% | |
| Thailand | $75.6M | 0.7% |
What it imports
The largest categories in 2024.
| Category | Value | Share | |
|---|---|---|---|
| Machinery, nuclear reactors, boilers | $1.78B | 15% | |
| Electrical, electronic equipment | $1.10B | 9.5% | |
| Vehicles other than railway, tramway | $1.08B | 9.4% | |
| Articles of iron or steel | $512M | 4.4% | |
| Plastics | $447M | 3.9% | |
| Salt, sulphur, earth, stone, plaster, lime and cement | $380M | 3.3% | |
| Pharmaceutical products | $351M | 3.0% | |
| Beverages, spirits and vinegar | $343M | 3.0% | |
| Mineral fuels, oils, distillation products | $331M | 2.9% | |
| Iron and steel | $319M | 2.8% | |
| Milling products, malt, starches, inulin, wheat gluten | $313M | 2.7% | |
| Meat and edible meat offal | $304M | 2.6% | |
| Inorganic chemicals, precious metal compound, isotope | $244M | 2.1% | |
| Sugars and sugar confectionery | $224M | 1.9% | |
| Cereals | $222M | 1.9% |
In a list, the bar runs to the largest in that list. The line is each figure’s history from 2000, drawn to its own peak: it shows the shape of the years, and the value shows the size.
External balanceBack to top ↑
-$2.544 billion (2013 est.)//-$2.254 billion (2012 est.)
Trade Facilitation & LogisticsBack to top ↑
Trade Policy & Market AccessBack to top ↑
- Trade Policy & Negotiation Capability
- Market Access & Agreements Network
- Trade Law & Enforcement
- Standards, Conformity & Quality Infrastructure
Digital & Services TradeBack to top ↑
- Services Trade Capability
- Digital Trade & E-Commerce
- Data Flows & Digital Trade Governance
- Tourism & Visitor Economy
Investment Attraction & ProjectionBack to top ↑
- Investment Attraction & Facilitation
- Investment Absorption & Linkages
- Outward Investment & Global Corporate Presence
Export Capability & SophisticationBack to top ↑
$9.936 billion (2013 est.)//$8.872 billion (2012 est.)
China 54.3%, Zambia 22.6%, Belgium 5.7% (2012)
diamonds, copper, gold, cobalt, wood products, crude oil, coffee
Global Value Chain PositionBack to top ↑
- Value Chain Participation & Integration
- Value Chain Position & Upgrading
- Regional Integration & Hub Anchoring
Economic Leverage & DependenceBack to top ↑
- Strategic Supply Security
- Concentration Risk & Revenue Stabilisation
- Economic Leverage & Coercion Resistance
$8.924 billion (2013 est.)//$8.187 billion (2012 est.)
South Africa 22.3%, China 15.3%, Belgium 8%, Zambia 6.9%, Zimbabwe 5.6%, France 4.9%, Kenya 4.7% (2012)
foodstuffs, mining and other machinery, transport equipment, fuels
DRC · you are in
Historical Context
Foundations
GINC Capability Domains
Find in this brief · DRC