
Ethiopia
Ethiopia is a landlocked federal republic in Africa, home to 97 million people, with its capital at Addis Ababa.
Contents
12 chapters
Foundations
01–03
At a glance
- Area
- 1.1Mkm²#27 World#10 Africa
- Population
- 96.6M#13 World#2 Africa
- GDP (market)
- $47.3B
- GDP (PPP)
- $118.2B#68 World#7 Africa
- GDP per capita
- $1.3K#210 World#41 Africa
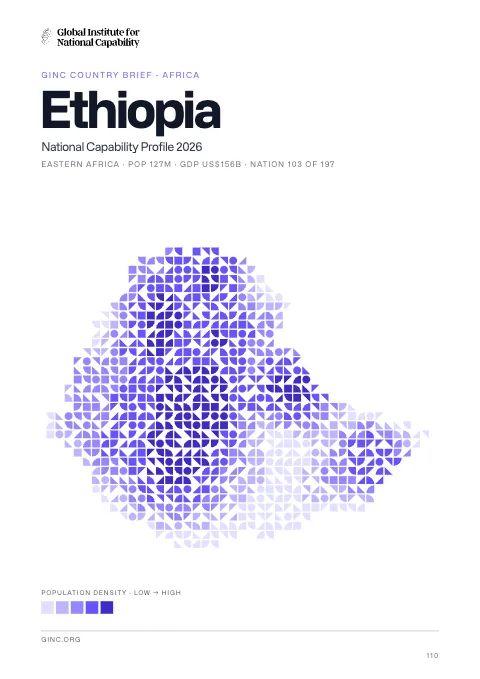
The whole brief
Ethiopia National Capability Profile 2026
Foundations · Chapter 01
Historical Context
🇪🇹 Ethiopia’s understanding the origins and evolution of the modern nation
BackgroundBack to top ↑
Unique among African countries, the ancient Ethiopian monarchy maintained its freedom from colonial rule with the exception of a short-lived Italian occupation from 1936-41. In 1974, a military junta, the Derg, deposed Emperor Haile SELASSIE (who had ruled since 1930) and established a socialist state. Torn by bloody coups, uprisings, wide-scale drought, and massive refugee problems, the regime was finally toppled in 1991 by a coalition of rebel forces, the Ethiopian People's Revolutionary Democratic Front (EPRDF). A constitution was adopted in 1994, and Ethiopia's first multiparty elections were held in 1995. A border war with Eritrea late in the 1990s ended with a peace treaty in December 2000. In November 2007, the Eritrea-Ethiopia Border Commission (EEBC) issued specific coordinates as virtually demarcating the border and pronounced its work finished. Alleging that the EEBC acted beyond its mandate in issuing the coordinates, Ethiopia has not accepted them and has not withdrawn troops from previously contested areas pronounced by the EEBC as belonging to Eritrea. In August 2012, longtime leader Prime Minister MELES Zenawi died in office and was replaced by his Deputy Prime Minister HAILEMARIAM Desalegn, marking the first peaceful transition of power in decades.
IndependenceBack to top ↑
oldest independent country in Africa and one of the oldest in the world - at least 2,000 years (may be traced to the Aksumite Kingdom, which coalesced in the first century B.C.)
National holidayBack to top ↑
National Day (defeat of MENGISTU regime), 28 May (1991)
Foundations · Chapter 02
Geography
🇪🇹 Ethiopia’s territory, resources and strategic position
Location and areaBack to top ↑
Eastern Africa, west of Somalia
8 00 N, 38 00 E
Africa
slightly less than twice the size of Texas
0 km (landlocked)
none (landlocked)
Terrain and resourcesBack to top ↑
high plateau with central mountain range divided by Great Rift Valley
small reserves of gold, platinum, copper, potash, natural gas, hydropower
2,896 sq km (2003)
Settlement and hazardsBack to top ↑
geologically active Great Rift Valley susceptible to earthquakes, volcanic eruptions; frequent droughts
landlocked - entire coastline along the Red Sea was lost with the de jure independence of Eritrea on 24 May 1993; Ethiopia is, therefore, the most populous landlocked country in the world; the Blue Nile, the chief headstream of the Nile by water volume, rises in T'ana Hayk (Lake Tana) in northwest Ethiopia; three major crops are believed to have originated in Ethiopia: coffee, grain sorghum, and castor bean
OtherBack to top ↑
122 cu km (2011)
deforestation; overgrazing; soil erosion; desertification; water shortages in some areas from water-intensive farming and poor management
Foundations · Chapter 03
Environment
🇪🇹 Ethiopia’s environmental conditions, resources and national resilience
ClimateBack to top ↑
tropical monsoon with wide topographic-induced variation
Emissions and pollutionBack to top ↑
Water, waste and foodBack to top ↑
Resources and agreementsBack to top ↑
GINC Capability Domains · Chapter 04
Critical Technology
🇪🇹 Ethiopia’s technology frontiers and the pursuit of national advantage
Two counts are set side by side for 2015–2024: on the left, the papers researchers in Ethiopia published; on the right, the patent families that began there and were filed in more than one country. First by capability group, then group by group with each group’s capabilities. The badge on a card is the nation’s place among all nations. Papers are from GINC Research Analytics, patent families from GINC Patents.
Research by capability group
#65 WorldPapers published, 2015–2024
965
611
415
198
129
129
30
25
18
3
Patents by capability group
International patent families, 2015–2024
No international patent families on record for 2015–2024.
Advanced Materials & ManufacturingBack to top ↑
Research
#62 WorldPapers published, 2015–2024
Patents
International patent families, 2015–2024
No international patent families on record for 2015–2024.
Energy TechnologiesBack to top ↑
Research
#64 WorldPapers published, 2015–2024
Patents
International patent families, 2015–2024
No international patent families on record for 2015–2024.
Semiconductors & Advanced ComputingBack to top ↑
Research
#90 WorldPapers published, 2015–2024
No research topic: Semiconductor Design & EDA · Advanced Semiconductor Fabrication · Semiconductor Equipment & Materials · Advanced Packaging & Heterogeneous Integration
Patents
International patent families, 2015–2024
No international patent families on record for 2015–2024.
Artificial IntelligenceBack to top ↑
Research
#59 WorldPapers published, 2015–2024
Patents
International patent families, 2015–2024
No international patent families on record for 2015–2024.
Quantum TechnologiesBack to top ↑
Research
#84 WorldPapers published, 2015–2024
Patents
International patent families, 2015–2024
No international patent families on record for 2015–2024.
Connectivity, Cyber & Trust TechnologiesBack to top ↑
Research
#78 WorldPapers published, 2015–2024
Patents
International patent families, 2015–2024
No international patent families on record for 2015–2024.
Sensing, Timing & NavigationBack to top ↑
Research
#85 WorldPapers published, 2015–2024
Patents
International patent families, 2015–2024
No international patent families on record for 2015–2024.
Robotics & Autonomous SystemsBack to top ↑
Research
#74 WorldPapers published, 2015–2024
No research topic: Human-Machine Interfaces
Patents
International patent families, 2015–2024
No international patent families on record for 2015–2024.
Biotechnology & Health TechnologiesBack to top ↑
Research
#49 WorldPapers published, 2015–2024
Patents
International patent families, 2015–2024
No international patent families on record for 2015–2024.
Medicine and BioTech
Clinical research and life-science invention, drawn from the same series that drive the metric pages. Each card opens the full cross-country comparison.
Space TechnologiesBack to top ↑
Research
#70 WorldPapers published, 2015–2024
Patents
International patent families, 2015–2024
No international patent families on record for 2015–2024.
GINC Capability Domains · Chapter 05
Strategic Infrastructure
🇪🇹 Ethiopia’s energy, connectivity and the material foundations of capability
Resource InfrastructureBack to top ↑
100 bbl/day (2012 est.)
0 bbl/day (2010 est.)
0 bbl/day (2010 est.)
430,000 bbl (1 January 2013 est.)
0 bbl/day (2010 est.)
49,080 bbl/day (2011 est.)
0 bbl/day (2010 est.)
42,500 bbl/day (2010 est.)
0 cu m (2011 est.)
0 cu m (2010 est.)
0 cu m (2011 est.)
0 cu m (2011 est.)
24.92 billion cu m (1 January 2013 est.)
Agriculture & Food InfrastructureBack to top ↑
- Irrigation & Agricultural Water
- Livestock & Veterinary
- Fisheries & Aquaculture
- Storage, Cold Chain & Markets
Energy InfrastructureBack to top ↑
- Thermal Generation
- Nuclear Generation
- Nuclear Fuel Cycle & Radioactive Waste
- Hydropower
- Renewable Generation
- Transmission & Distribution
- System Control & Dispatch
- Storage & Fuel Supply
2.061 million kW (2010 est.)
4.929 billion kWh (2010 est.)
4.451 billion kWh (2010 est.)
0 kWh (2012 est.)
0 kWh (2012 est.)
9.9% of total installed capacity (2010 est.)
0% of total installed capacity (2010 est.)
89.7% of total installed capacity (2010 est.)
0.4% of total installed capacity (2010 est.)
6.703 million Mt (2011 est.)
Water, Sanitation & Waste InfrastructureBack to top ↑
- Dams, Reservoirs & Flood Defence
- Water Supply & Treatment
- Bulk Water Transfer & Desalination
- Wastewater & Sanitation
- Solid Waste & Recycling
Advanced ManufacturingBack to top ↑
- Materials & Inputs
- Chemicals & Hazardous Process Industry
- Production Systems
- Supply Chain & Ecosystem
- Workforce & Innovation
Transport InfrastructureBack to top ↑
- Seaports & Terminals
- Air Infrastructure
- Air Navigation & Traffic Management
- Inland Waterways & Ferries
- Rail Infrastructure
- Roads & Bridges
- Logistics, Multimodal & Border Infrastructure
- Postal & Parcel
57 (2013)
Ethiopia is landlocked and uses the ports of Djibouti in Djibouti and Berbera in Somalia
Communications & Digital InfrastructureBack to top ↑
- Subsea Cables & International Gateways
- Core & Backbone Networks
- Mobile & Wireless Networks
- Spectrum & Broadcasting
- Data Centres, Compute & Cloud
- Data Resources
- AI Tools & Applications
797,500 (2012)
20.524 million (2012)
447,300 (2009)
179 (2012)
.et
Financial InfrastructureBack to top ↑
- Currency & Reserves
- Payments & Settlement Systems
- Markets, Exchanges & Depositories
- Banks, Insurers & Systemic Institutions
Social InfrastructureBack to top ↑
- Health Infrastructure
- Public Health & Laboratories
- Medical Supply & Stockpiles
- Education & Skills Infrastructure
- Research & Scientific Facilities
- Housing, Community & Social Services
- Government & Public Administration
- Cultural, Community & Recreational Infrastructure
- Justice & Corrections
- Emergency Services & Civil Protection
- Hydrometeorology & Early Warning
Space, Aerospace & Defence InfrastructureBack to top ↑
GINC Capability Domains · Chapter 06
National Security
🇪🇹 Ethiopia’s force, intelligence and the defence of the nation
Disputes and terrorismBack to top ↑
Eritrea and Ethiopia agreed to abide by the 2002 Eritrea-Ethiopia Boundary Commission's (EEBC) delimitation decision, but neither party responded to the revised line detailed in the November 2006 EEBC Demarcation Statement; the undemarcated former British administrative line has little meaning as a political separation to rival clans within Ethiopia's Ogaden and southern Somalia's Oromo region; Ethiopian forces invaded southern Somalia and routed Islamist Courts from Mogadishu in January 2007; "Somaliland" secessionists provide port facilities in Berbera and trade ties to landlocked Ethiopia; civil unrest in eastern Sudan has hampered efforts to demarcate the porous boundary with Ethiopia
Force Generation & MobilisationBack to top ↑
Ethiopian National Defense Force (ENDF): Ground Forces, Ethiopian Air Force (Ye Ityopya Ayer Hayl, ETAF) (2013)
18 years of age for voluntary military service; no compulsory military service, but the military can conduct callups when necessary and compliance is compulsory (2012)
0.91% of GDP (2012)//1.1% of GDP (2011)//0.91% of GDP (2010)
Forces under arms
Active-duty strength on the Correlates of War series, which reaches back to 1816 and so carries a nation’s whole record of mobilisation rather than its present establishment. The card opens the full cross-country comparison.
Intelligence & AssessmentBack to top ↑
- Imagery & Geospatial Intelligence
- Signals & Cyber Intelligence
- Technical & Measurement Intelligence
- Open-Source & Financial Intelligence
- Human Intelligence & Counterintelligence
- All-Source Analysis & Warning
Joint Command, Projection & SustainmentBack to top ↑
- Command, Control & Communications
- Strategic Lift & Mobility
- Expeditionary & Peace Operations
- Operational Sustainment & War Reserves
- Defence Industrial Mobilisation
- CBRN Defence
Land PowerBack to top ↑
- Combined Arms Manoeuvre
- Land Fires
- Battlefield Aviation & Uncrewed Systems
- Special Operations & Irregular Warfare
Maritime PowerBack to top ↑
- Maritime Security & Constabulary
- Sea Denial & Undersea Warfare
- Sea Control
- Amphibious & Expeditionary Operations
Air PowerBack to top ↑
- Air Sovereignty & Policing
- Control of the Air
- Air Strike & Interdiction
- Airborne ISR, Early Warning & Battle Management
Strategic Strike & Missile DefenceBack to top ↑
Space OperationsBack to top ↑
Cyber & Electromagnetic OperationsBack to top ↑
Nuclear DeterrenceBack to top ↑
GINC Capability Domains · Chapter 07
Human Capital
🇪🇹 Ethiopia’s population, health and the skills that sustain capability
DemographyBack to top ↑
96,633,458
2.89% (2014 est.)
37.66 births/1,000 population (2014 est.)
8.52 deaths/1,000 population (2014 est.)
5.23 children born/woman (2014 est.)
19.6
28.6% (2010/11)
Migration and urbanisationBack to top ↑
-0.23 migrant(s)/1,000 population
ADDIS ABABA (capital) 2.979 million (2011)
Welfare and equityBack to top ↑
39% (2012 est.)
33 (2011)//30 (2000)
DisplacementBack to top ↑
Early Childhood DevelopmentBack to top ↑
29.2% (2011)
Foundational EducationBack to top ↑
4.7% of GDP (2010)
Advanced EducationBack to top ↑
Technical & Vocational SkillsBack to top ↑
Digital & AI CompetenceBack to top ↑
Generative AI adoption
Modelled share of working-age adults using generative AI, from Microsoft telemetry scaled to each country’s 15–64 population. A measure of how fast a workforce is absorbing the technology rather than of how much of it a nation builds. The card opens the full cross-country comparison.
Lifelong Learning & ReskillingBack to top ↑
Research Talent & Knowledge CreationBack to top ↑
Population HealthBack to top ↑
350 deaths/100,000 live births (2010)
1.1% (2008)
1.3% (2012 est.)
758,600 (2012 est.)
47,200 (2012 est.)
Health System CapabilityBack to top ↑
4.7% of GDP (2011)
0.03 physicians/1,000 population (2009)
6.3 beds/1,000 population (2011)
GINC Capability Domains · Chapter 08
Governance and Integrity
🇪🇹 Ethiopia’s institutions, law and the integrity of the state
State structureBack to top ↑
federal republic
9 ethnically based states (kililoch, singular - kilil) and 2 self-governing administrations* (astedaderoch, singular - astedader); Adis Abeba* (Addis Ababa), Afar, Amara (Amhara), Binshangul Gumuz, Dire Dawa*, Gambela Hizboch (Gambela Peoples), Hareri Hizb (Harari People), Oromiya (Oromia), Sumale (Somali), Tigray, Ye Debub Biheroch Bihereseboch na Hizboch (Southern Nations, Nationalities, and Peoples)
several previous; latest drafted June 1994, adopted 8 December 1994, entered into force 21 August 1995 (2013)
18 years of age; universal
Political Institutions & Civic ParticipationBack to top ↑
- Electoral Management & Integrity
- Legislature & Deliberative Institutions
- Citizen Participation & Civic Space
bicameral Parliament consists of the House of Federation (or upper chamber responsible for interpreting the constitution and federal-regional issues) (108 seats; members chosen by state assemblies to serve five-year terms) and the House of People's Representatives (or lower chamber responsible for passing legislation) (547 seats; members directly elected by popular vote from single-member districts to serve five-year terms)
Afar National Democratic Party or ANDP [Mohammed KEDIR]//All Ethiopian Unity Organization or AEUO [Hailu SHAWEL]//Arena Tigray [GEBRU Asrat]//Argoba People's Democratic Organization or APDO [Abdulkader MOHAMMED]//Benishangul Gumuz People's Democratic Party or BGPDP [Mulualem BESSE]//Coalition for Unity and Democratic Party or CUDP [AYELE Chamiso]//Ethiopian Democratic Party or EDP [MUSHE Semu]//Ethiopian Federal Democratic Forum or FORUM (a UDJ-led 6-party alliance established for the 2010 parliamentary elections) [Dr. Moga FRISSA]//Ethiopian People's Revolutionary Democratic Front or EPRDF (including the following organizations: Amhara National Democratic Movement or ANDM; Oromo People's Democratic Organization or OPDO; Southern Ethiopian People's Democratic Movement or SEPDM; and Tigray People's Liberation Front or TPLF)//Gambella Peoples Unity Democratic Movement or GPUDM//Gurage Peoples Democratic Front [GIRMA Bogale]//Harari National League or HNL [YASIN Husein]//Oromo Federalist Democratic Movement or OFDM//Oromo People's Congress or OPC [IMERERA Gudina]//Somali Democratic Alliance Forces or SODAF [BUH Hussien]//Somali People's Democratic Party or SPDP [Abdulfetah Sheck ABDULAHI]//South Ethiopian People's Democratic Union or SEPDU [TILAHUN Endeshaw]//United Ethiopian Democratic Forces or UEDF [BEYENE Petros]//Unity for Democracy and Justice or UDJ [Dr. NEGASSO Gidada]
Ethiopian People's Patriotic Front or EPPF//Ogaden National Liberation Front or ONLF//Oromo Liberation Front or OLF [DAOUD Ibsa]
Justice System & Fundamental RightsBack to top ↑
- Judicial Independence & Court Capability
- Access to Justice & Legal Services
- Fundamental Rights Protection
- Human Rights Institutions & Equality Bodies
civil law system
has not submitted an ICJ jurisdiction declaration; non-party state to the ICCt
Internal Security & OrderBack to top ↑
transit hub for heroin originating in Southwest and Southeast Asia and destined for Europe, as well as cocaine destined for markets in southern Africa; cultivates qat (khat) for local use and regional export, principally to Djibouti and Somalia (legal in all three countries); the lack of a well-developed financial system limits the country's utility as a money laundering center
Regulatory Governance & Strategic ControlsBack to top ↑
- Regulatory Quality & Better Regulation
- Regulatory Delivery & Independent Regulators
- Strategic Controls & Economic Security Administration
Government Effectiveness & Public AdministrationBack to top ↑
- Centre of Government & Policy Coordination
- Civil Service & Public Workforce
- Digital Government & Service Delivery
- Legal Identity & Civil Registration
- Statistical & Data Capability
Public Integrity & Anti-CorruptionBack to top ↑
Transparency, Oversight & AccountabilityBack to top ↑
- Right to Information & Open Government
- Independent Oversight & Supreme Audit
- Independent Media & Journalist Safety
National Resilience & Crisis ManagementBack to top ↑
GINC Capability Domains · Chapter 09
Information and Influence
🇪🇹 Ethiopia’s identity, media and the projection of influence
Identity and cultureBack to top ↑
Oromo (official working language in the State of Oromiya) 33.8%, Amharic (official national language) 29.3%, Somali (official working language of the State of Sumale) 6.2%, Tigrigna (Tigrinya) (official working language of the State of Tigray) 5.9%, Sidamo 4%, Wolaytta 2.2%, Gurage 2%, Afar (official working language of the State of Afar) 1.7%, Hadiyya 1.7%, Gamo 1.5%, Gedeo 1.3%, Opuuo 1.2%, Kafa 1.1%, other 8.1%, English (major foreign language taught in schools), Arabic (2007 est.)
Ethiopian Orthodox 43.5%, Muslim 33.9%, Protestant 18.5%, traditional 2.7%, Catholic 0.7%, other 0.6% (2007 est.)
Oromo 34.4%, Amhara (Amara) 27%, Somali (Somalie) 6.2%, Tigray (Tigrinya) 6.1%, Sidama 4%, Gurage 2.5%, Welaita 2.3%, Hadiya 1.7%, Afar (Affar) 1.7%, Gamo 1.5%, Gedeo 1.3%, Silte 1.3%, Kefficho 1.2%, other 10.5% (2007 est.)
Abyssinian lion
three equal horizontal bands of green (top), yellow, and red, with a yellow pentagram and single yellow rays emanating from the angles between the points on a light blue disk centered on the three bands; green represents hope and the fertility of the land, yellow symbolizes justice and harmony, while red stands for sacrifice and heroism in the defense of the land; the blue of the disk symbolizes peace and the pentagram represents the unity and equality of the nationalities and peoples of Ethiopia
Diplomatic Statecraft & Global NetworksBack to top ↑
- Diplomatic Network & Consular Reach
- Multilateral Leadership & Norm Setting
- Agenda-Setting & Convening
- Mediation & Crisis Diplomacy
ACP, AfDB, AU, COMESA, FAO, G-24, G-77, IAEA, IBRD, ICAO, ICRM, IDA, IFAD, IFC, IFRCS, IGAD, ILO, IMF, IMO, Interpol, IOC, IOM, IPU, ISO, ITSO, ITU, ITUC (NGOs), MIGA, NAM, OPCW, PCA, UN, UNAMID, UNCTAD, UNESCO, UNHCR, UNIDO, UNISFA, UNMIL, UNOCI, UNWTO, UPU, WCO, WFTU (NGOs), WHO, WIPO, WMO, WTO (observer)
Alliances & Security CooperationBack to top ↑
Development Cooperation & Global AssistanceBack to top ↑
Culture, Language & Education DiplomacyBack to top ↑
- Cultural & Language Institutes
- Creative Industries & Cultural Export Reach
- Heritage & Cultural Institutions
- Education Diplomacy & Alumni Networks
- Sports & Major Events
Diaspora & Global CommunitiesBack to top ↑
Information Environment & Strategic CommunicationBack to top ↑
- Strategic Communications & Public Diplomacy
- International Media & Broadcasting
- Information Defence & Counter-Interference
1 public TV station broadcasting nationally and 1 public radio broadcaster with stations in each of the 13 administrative districts; a few commercial radio stations and roughly a dozen community radio stations (2009)
GINC Capability Domains · Chapter 10
Financial Strength
🇪🇹 Ethiopia’s fiscal depth, reserves and the capacity to act
Monetary & Currency CapabilityBack to top ↑
- Monetary Policy & Price Stability
- Exchange Rate & External Account Management
- Currency Issuance & Digital Money
8.4% (2013 est.)//22.9% (2012 est.)
birr (ETB) per US dollar -//19.92 (2013 est.)//17.705 (2012 est.)//14.41 (2010 est.)//11.78 (2009)//9.57 (2008)
NA%
12% (31 December 2013 est.)//14.5% (31 December 2012 est.)
$9.006 billion (31 December 2013 est.)//$9.107 billion (31 December 2012 est.)
$15.43 billion (31 December 2013 est.)//$15.45 billion (31 December 2012 est.)
Fiscal Capacity & Public FinanceBack to top ↑
- Revenue Mobilisation & Tax Administration
- Public Expenditure & Budget Management
- Sovereign Debt & Treasury Management
- Public Investment Management
14.2% of GDP (2013 est.)
-2.8% of GDP (2013 est.)
50.4% of GDP (2013 est.)//39.7% of GDP (2012 est.)
8 July - 7 July
Financial System Depth & AccessBack to top ↑
- Banking System Capacity
- Capital Markets Depth & Development
- Long-Term & Institutional Capital
- Financial Inclusion & Household Access
- Development & Policy Finance
$16.07 billion (31 December 2013 est.)//$16.09 billion (31 December 2012 est.)
$NA
18.8% of GDP (2013 est.)//18.2% of GDP (2012 est.)//22.9% of GDP (2011 est.)
Financial Regulation & IntegrityBack to top ↑
- Prudential Regulation & Supervision
- Financial Integrity & Illicit Finance Control
- Market Conduct & Consumer Protection
- Payment & Market Infrastructure Oversight
Financial Stability & Crisis ManagementBack to top ↑
- Macroprudential & Systemic Oversight
- Crisis Management, Resolution & Deposit Insurance
- External Liquidity & Financial Safety Nets
Sovereign Capital & External Financial PowerBack to top ↑
- Official Reserves Management
- Sovereign Wealth & Public Asset Management
- Currency Internationalisation & Reserve Status
- Capital Account & Flow Management
- International Financial Centre Capability
$3.382 billion (31 December 2013 est.)//$3.272 billion (31 December 2012 est.)
$11.99 billion (31 December 2013 est.)//$10.03 billion (31 December 2012 est.)
GINC Capability Domains · Chapter 11
Production and Innovation
🇪🇹 Ethiopia’s output, industry and the engine of prosperity
Economic Output & ProductivityBack to top ↑
Ethiopia's economy is based on agriculture but the government is pushing to diversify into manufacturing, textiles, and energy generation.. Coffee is a major export crop. The agricultural sector suffers from poor cultivation practices and frequent drought, but recent joint efforts by the Government of Ethiopia and donors have strengthened Ethiopia's agricultural resilience, contributing to a reduction in the number of Ethiopians threatened with starvation. The banking, insurance, telecommunications, and micro-credit industries are restricted to domestic investors, but Ethiopia has attracted significant foreign investment in textiles, leather, commercial agriculture and manufacturing. Under Ethiopia's constitution, the state owns all land and provides long-term leases to the tenants; land use certificates are now being issued in some areas so that tenants have more recognizable rights to continued occupancy and hence make more concerted efforts to improve their leaseholds. While GDP growth has remained high, per capita income is among the lowest in the world. Ethiopia's economy continues on its state-led Growth and Transformation Plan under the new collective leadership that followed Prime Minister MELES’s death. The five-year economic plan has achieved high single-digit growth rates through government-led infrastructure expansion and commercial agriculture development. Ethiopia in 2014 will continue construction of its Grand Renaissance Dam on the Nile – a controversial five billion dollar effort to develop electricity for domestic consumption and export.
$118.2 billion (2013 est.)//$110.4 billion (2012 est.)//$101.8 billion (2011 est.)
7% (2013 est.)//8.5% (2012 est.)//11.4% (2011 est.)
$1,300 (2013 est.)//$1,300 (2012 est.)//$1,200 (2011 est.)
$47.34 billion (2013 est.)
Labour & EmploymentBack to top ↑
- Employment & Labour Force Participation
- Labour Market Institutions & Wage Setting
- Employment Services & Skills Matching
- Labour Adjustment, Transition & Formalisation
45.65 million (2013 est.)
17.5% (2012 est.)//18% (2011 est.)
Industrial & Sectoral BaseBack to top ↑
- Manufacturing & Advanced Industry
- Foundational & Process Industries
- Agrifood & Primary Production
- Services Economy
cereals, pulses, coffee, oilseed, cotton, sugarcane, potatoes, khat, cut flowers; hides, cattle, sheep, goats; fish
food processing, beverages, textiles, leather, chemicals, metals processing, cement
9% (2013 est.)
Structural Transformation & ComplexityBack to top ↑
Business Dynamism & EntrepreneurshipBack to top ↑
- Entrepreneurship & Firm Creation
- Risk Capital & Scale-Up Finance
- Firm Growth, Exit & Renewal
- Competition & Market Contestability
Innovation & CommercialisationBack to top ↑
- Business Innovation Capability
- Research Commercialisation & Knowledge Transfer
- Intellectual Property & Intangible Assets
- Innovation Ecosystems & Clusters
Technology Adoption & DiffusionBack to top ↑
GINC Capability Domains · Chapter 12
Trade and Investment
🇪🇹 Ethiopia’s markets, capital and the terms of global exchange
Overall tradeBack to top ↑
$3.21B of exports to 120 partners and $7.23B of imports from 94 in 2024, a deficit of $4.01B.
- Exports
- $3.21B120 partners
- Imports
- $7.23B94 partners
- Balance
- −$4.01Bdeficit
- Total trade
- $10.4B2024
ExportsBack to top ↑
Where its exports go
The largest partners in 2024, with each one's share of the nation's exports.
| Partner | Value | Share | |
|---|---|---|---|
| China | $409M | 13% | |
| United States | $409M | 13% | |
| Saudi Arabia | $376M | 12% | |
| Germany | $250M | 7.8% | |
| Netherlands | $214M | 6.7% | |
| Japan | $130M | 4.0% | |
| South Korea | $126M | 3.9% | |
| France | $117M | 3.6% | |
| Italy | $113M | 3.5% | |
| Kenya | $99.6M | 3.1% | |
| India | $85.8M | 2.7% | |
| Pakistan | $70.6M | 2.2% | |
| Singapore | $67.7M | 2.1% | |
| United Kingdom | $64.3M | 2.0% | |
| Switzerland | $61.9M | 1.9% | |
| Hong Kong | $53.1M | 1.7% | |
| Canada | $45.2M | 1.4% | |
| Turkey | $42.5M | 1.3% | |
| Israel | $41.8M | 1.3% | |
| Taiwan | $38.1M | 1.2% |
What it exports
The largest categories in 2024.
| Category | Value | Share | |
|---|---|---|---|
| Coffee, tea, mate and spices | $1.47B | 46% | |
| Oil seed, oleaginous fruits, grain, seed, fruits | $360M | 11% | |
| Live trees, plants, bulbs, roots, cut flowers | $322M | 10% | |
| Edible vegetables and certain roots and tubers | $192M | 6.0% | |
| Articles of apparel, knit or crocheted | $181M | 5.6% | |
| Articles of apparel, not knit or crocheted | $146M | 4.5% | |
| Mineral fuels, oils, distillation products | $85.5M | 2.7% | |
| Machinery, nuclear reactors, boilers | $67.1M | 2.1% | |
| Aircraft, spacecraft | $62.2M | 1.9% | |
| Vegetable textile fibers not specified elsewhere, paper yarn, woven fabric | $46.0M | 1.4% | |
| Meat and edible meat offal | $44.2M | 1.4% | |
| Residues, wastes of food industry, animal fodder | $35.4M | 1.1% | |
| Cereal, flour, starch, milk preparations and products | $26.3M | 0.8% | |
| Raw hides and skins (other than furskins) and leather | $25.9M | 0.8% | |
| Cotton | $22.8M | 0.7% |
ImportsBack to top ↑
Where its imports come from
The largest partners in 2024, with each one's share of the nation's imports.
| Partner | Value | Share | |
|---|---|---|---|
| China | $3.14B | 43% | |
| France | $748M | 10% | |
| India | $443M | 6.1% | |
| United States | $386M | 5.3% | |
| United Kingdom | $380M | 5.3% | |
| Turkey | $190M | 2.6% | |
| Italy | $174M | 2.4% | |
| South Korea | $148M | 2.0% | |
| Germany | $139M | 1.9% | |
| Belgium | $136M | 1.9% | |
| Malaysia | $126M | 1.7% | |
| Singapore | $114M | 1.6% | |
| Egypt | $113M | 1.6% | |
| Kenya | $112M | 1.5% | |
| Hong Kong | $105M | 1.4% | |
| Netherlands | $94.3M | 1.3% | |
| Indonesia | $76.2M | 1.1% | |
| Thailand | $52.4M | 0.7% | |
| Japan | $49.2M | 0.7% | |
| Saudi Arabia | $41.2M | 0.6% |
What it imports
The largest categories in 2024.
| Category | Value | Share | |
|---|---|---|---|
| Machinery, nuclear reactors, boilers | $1.75B | 24% | |
| Electrical, electronic equipment | $1.12B | 16% | |
| Aircraft, spacecraft | $660M | 9.1% | |
| Pharmaceutical products | $429M | 5.9% | |
| Plastics | $347M | 4.8% | |
| Vehicles other than railway, tramway | $280M | 3.9% | |
| Mineral fuels, oils, distillation products | $250M | 3.5% | |
| Optical, photo, technical, medical apparatus | $230M | 3.2% | |
| Articles of iron or steel | $183M | 2.5% | |
| Iron and steel | $167M | 2.3% | |
| Miscellaneous chemical products | $153M | 2.1% | |
| Rubbers | $112M | 1.6% | |
| Manmade filaments | $111M | 1.5% | |
| Essential oils, perfumes, cosmetics, toiletries | $98.9M | 1.4% | |
| Aluminum | $83.3M | 1.2% |
In a list, the bar runs to the largest in that list. The line is each figure’s history from 2000, drawn to its own peak: it shows the shape of the years, and the value shows the size.
External balanceBack to top ↑
-$2.744 billion (2013 est.)//-$2.031 billion (2012 est.)
Trade Facilitation & LogisticsBack to top ↑
Trade Policy & Market AccessBack to top ↑
- Trade Policy & Negotiation Capability
- Market Access & Agreements Network
- Trade Law & Enforcement
- Standards, Conformity & Quality Infrastructure
Digital & Services TradeBack to top ↑
- Services Trade Capability
- Digital Trade & E-Commerce
- Data Flows & Digital Trade Governance
- Tourism & Visitor Economy
Investment Attraction & ProjectionBack to top ↑
- Investment Attraction & Facilitation
- Investment Absorption & Linkages
- Outward Investment & Global Corporate Presence
Export Capability & SophisticationBack to top ↑
$3.214 billion (2013 est.)//$3.039 billion (2012 est.)
China 13%, Germany 10.8%, US 8%, Belgium 7.7%, Saudi Arabia 7.6% (2012)
coffee, khat, gold, leather products, live animals, oilseeds
Global Value Chain PositionBack to top ↑
- Value Chain Participation & Integration
- Value Chain Position & Upgrading
- Regional Integration & Hub Anchoring
Economic Leverage & DependenceBack to top ↑
- Strategic Supply Security
- Concentration Risk & Revenue Stabilisation
- Economic Leverage & Coercion Resistance
$10.68 billion (2013 est.)//$10.25 billion (2012 est.)
China 13.1%, US 11%, Saudi Arabia 8.4%, India 5.4% (2012)
food and live animals, petroleum and petroleum products, chemicals, machinery, motor vehicles, cereals, textiles
Ethiopia · you are in
Historical Context
Foundations
GINC Capability Domains
Find in this brief · Ethiopia