
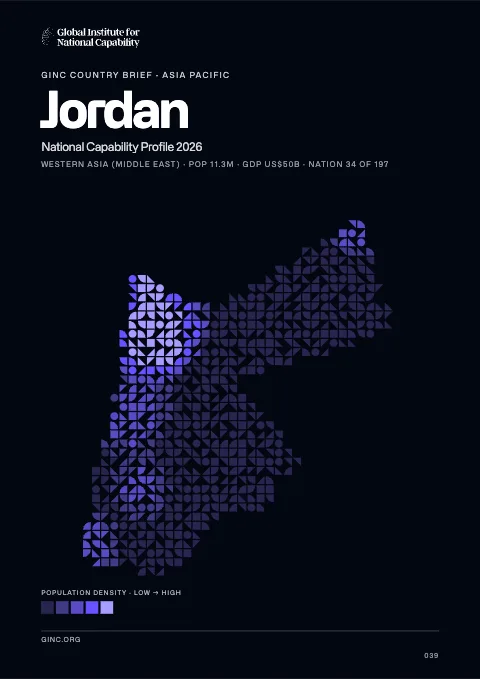
Jordan
Jordan is a constitutional monarchy in the Middle East, home to 7.9 million people, with its capital at Amman.
Contents
12 chapters
Foundations
01–03
At a glance
- Area
- 89.3Kkm²#112 World#8 Middle East
- Population
- 7.9M#97 World#8 Middle East
- GDP (market)
- $34.1B
- GDP (PPP)
- $40B#104 World#14 Middle East
- GDP per capita
- $6.1K#152 World#15 Middle East
The whole brief
Jordan National Capability Profile 2026
Foundations · Chapter 01
Historical Context
🇯🇴 Jordan’s understanding the origins and evolution of the modern nation
BackgroundBack to top ↑
Following World War I and the dissolution of the Ottoman Empire, the League of Nations awarded Britain the mandate to govern much of the Middle East. Britain demarcated a semi-autonomous region of Transjordan from Palestine in the early 1920s. The area gained its independence in 1946 and thereafter became The Hashemite Kingdom of Jordan. The country's long-time ruler, King HUSSEIN (1953-99), successfully navigated competing pressures from the major powers (US, USSR, and UK), various Arab states, Israel, and a large internal Palestinian population. Jordan lost the West Bank to Israel in the 1967 Six-Day War. King HUSSEIN in 1988 permanently relinquished Jordanian claims to the West Bank; in 1994 he signed a peace treaty with Israel. King ABDALLAH II, King HUSSEIN's eldest son, assumed the throne following his father's death in 1999. He implemented modest political and economic reforms, but in the wake of the "Arab Revolution" across the Middle East, Jordanians continue to press for further political liberalization, government reforms, and economic improvements. In January 2014, Jordan assumed a nonpermanent seat on the UN Security Council for the 2014-15 term.
IndependenceBack to top ↑
25 May 1946 (from League of Nations mandate under British administration)
National holidayBack to top ↑
Independence Day, 25 May (1946)
Foundations · Chapter 02
Geography
🇯🇴 Jordan’s territory, resources and strategic position
Location and areaBack to top ↑
Middle East, northwest of Saudi Arabia, between Israel (to the west) and Iraq
31 00 N, 36 00 E
Middle East
slightly smaller than Indiana
26 km
Terrain and resourcesBack to top ↑
mostly desert plateau in east, highland area in west; Great Rift Valley separates East and West Banks of the Jordan River
phosphates, potash, shale oil
788.6 sq km (2004)
Settlement and hazardsBack to top ↑
droughts; periodic earthquakes
strategic location at the head of the Gulf of Aqaba and as the Arab country that shares the longest border with Israel and the occupied West Bank
OtherBack to top ↑
0.94 cu km (2011)
limited natural freshwater resources; deforestation; overgrazing; soil erosion; desertification
Foundations · Chapter 03
Environment
🇯🇴 Jordan’s environmental conditions, resources and national resilience
ClimateBack to top ↑
mostly arid desert; rainy season in west (November to April)
Emissions and pollutionBack to top ↑
Water, waste and foodBack to top ↑
Resources and agreementsBack to top ↑
GINC Capability Domains · Chapter 04
Critical Technology
🇯🇴 Jordan’s technology frontiers and the pursuit of national advantage
Two counts are set side by side for 2015–2024: on the left, the papers researchers in Jordan published; on the right, the patent families that began there and were filed in more than one country. First by capability group, then group by group with each group’s capabilities. The badge on a card is the nation’s place among all nations. Papers are from GINC Research Analytics, patent families from GINC Patents.
Research by capability group
#56 WorldPapers published, 2015–2024
1,905
525
442
333
320
187
97
63
26
2
Patents by capability group
#77 WorldInternational patent families, 2015–2024
Advanced Materials & ManufacturingBack to top ↑
Research
#69 WorldPapers published, 2015–2024
Patents
#67 WorldInternational patent families, 2015–2024
Energy TechnologiesBack to top ↑
Research
#66 WorldPapers published, 2015–2024
Patents
#84 WorldInternational patent families, 2015–2024
Semiconductors & Advanced ComputingBack to top ↑
Research
#53 WorldPapers published, 2015–2024
No research topic: Semiconductor Design & EDA · Advanced Semiconductor Fabrication · Semiconductor Equipment & Materials · Advanced Packaging & Heterogeneous Integration
Patents
International patent families, 2015–2024
No international patent families on record for 2015–2024.
Artificial IntelligenceBack to top ↑
Research
#46 WorldPapers published, 2015–2024
Patents
#67 WorldInternational patent families, 2015–2024
Quantum TechnologiesBack to top ↑
Research
#82 WorldPapers published, 2015–2024
Patents
International patent families, 2015–2024
No international patent families on record for 2015–2024.
Connectivity, Cyber & Trust TechnologiesBack to top ↑
Research
#45 WorldPapers published, 2015–2024
Patents
#79 WorldInternational patent families, 2015–2024
Sensing, Timing & NavigationBack to top ↑
Research
#73 WorldPapers published, 2015–2024
Patents
International patent families, 2015–2024
No international patent families on record for 2015–2024.
Robotics & Autonomous SystemsBack to top ↑
Research
#61 WorldPapers published, 2015–2024
No research topic: Human-Machine Interfaces
Patents
#59 WorldInternational patent families, 2015–2024
Biotechnology & Health TechnologiesBack to top ↑
Research
#55 WorldPapers published, 2015–2024
Patents
#84 WorldInternational patent families, 2015–2024
Medicine and BioTech
Clinical research and life-science invention, drawn from the same series that drive the metric pages. Each card opens the full cross-country comparison.
Space TechnologiesBack to top ↑
Research
#79 WorldPapers published, 2015–2024
Patents
International patent families, 2015–2024
No international patent families on record for 2015–2024.
GINC Capability Domains · Chapter 05
Strategic Infrastructure
🇯🇴 Jordan’s energy, connectivity and the material foundations of capability
Resource InfrastructureBack to top ↑
164.8 bbl/day (2012 est.)
0 bbl/day (2010 est.)
68,320 bbl/day (2010 est.)
1 million bbl (1 January 2013 est.)
72,190 bbl/day (2010 est.)
107,000 bbl/day (2011 est.)
0 bbl/day (2010 est.)
35,600 bbl/day (2010 est.)
230 million cu m (2011 est.)
1.4 billion cu m (2011 est.)
0 cu m (2011 est.)
830 million cu m (2011 est.)
6.031 billion cu m (1 January 2013 est.)
gas 473 km; oil 49 km (2013)
Agriculture & Food InfrastructureBack to top ↑
- Irrigation & Agricultural Water
- Livestock & Veterinary
- Fisheries & Aquaculture
- Storage, Cold Chain & Markets
Energy InfrastructureBack to top ↑
- Thermal Generation
- Nuclear Generation
- Nuclear Fuel Cycle & Radioactive Waste
- Hydropower
- Renewable Generation
- Transmission & Distribution
- System Control & Dispatch
- Storage & Fuel Supply
3.138 million kW (2010 est.)
14.64 billion kWh (2011 est.)
13.54 billion kWh (2011 est.)
86 million kWh (2011 est.)
1.738 billion kWh (2011 est.)
99.4% of total installed capacity (2010 est.)
0% of total installed capacity (2010 est.)
0.4% of total installed capacity (2010 est.)
0.2% of total installed capacity (2010 est.)
18.55 million Mt (2011 est.)
Water, Sanitation & Waste InfrastructureBack to top ↑
- Dams, Reservoirs & Flood Defence
- Water Supply & Treatment
- Bulk Water Transfer & Desalination
- Wastewater & Sanitation
- Solid Waste & Recycling
Advanced ManufacturingBack to top ↑
- Materials & Inputs
- Chemicals & Hazardous Process Industry
- Production Systems
- Supply Chain & Ecosystem
- Workforce & Innovation
Transport InfrastructureBack to top ↑
- Seaports & Terminals
- Air Infrastructure
- Air Navigation & Traffic Management
- Inland Waterways & Ferries
- Rail Infrastructure
- Roads & Bridges
- Logistics, Multimodal & Border Infrastructure
- Postal & Parcel
18 (2013)
1 (2012)
Communications & Digital InfrastructureBack to top ↑
- Subsea Cables & International Gateways
- Core & Backbone Networks
- Mobile & Wireless Networks
- Spectrum & Broadcasting
- Data Centres, Compute & Cloud
- Data Resources
- AI Tools & Applications
435,000 (2012)
8.984 million (2012)
1.642 million (2009)
69,473 (2012)
.jo
Financial InfrastructureBack to top ↑
- Currency & Reserves
- Payments & Settlement Systems
- Markets, Exchanges & Depositories
- Banks, Insurers & Systemic Institutions
Social InfrastructureBack to top ↑
- Health Infrastructure
- Public Health & Laboratories
- Medical Supply & Stockpiles
- Education & Skills Infrastructure
- Research & Scientific Facilities
- Housing, Community & Social Services
- Government & Public Administration
- Cultural, Community & Recreational Infrastructure
- Justice & Corrections
- Emergency Services & Civil Protection
- Hydrometeorology & Early Warning
Space, Aerospace & Defence InfrastructureBack to top ↑
GINC Capability Domains · Chapter 06
National Security
🇯🇴 Jordan’s force, intelligence and the defence of the nation
Disputes and terrorismBack to top ↑
2004 Agreement settles border dispute with Syria pending demarcation
Force Generation & MobilisationBack to top ↑
Jordanian Armed Forces (JAF): Royal Jordanian Land Force (RJLF), Royal Jordanian Navy, Royal Jordanian Air Force (Al-Quwwat al-Jawwiya al-Malakiya al-Urduniya, RJAF), Special Operations Command (Socom); Public Security Directorate (normally falls under Ministry of Interior, but comes under JAF in wartime or crisis) (2013)
17 years of age for voluntary male military service; initial service term 2 years, with option to reenlist for 18 years; conscription at age 18 suspended in 1999; women not subject to conscription, but can volunteer to serve in noncombat military positions in the Royal Jordanian Arab Army Women's Corps and RJAF (2013)
4.65% of GDP (2012)//4.64% of GDP (2011)//4.65% of GDP (2010)
Forces under arms
Active-duty strength on the Correlates of War series, which reaches back to 1816 and so carries a nation’s whole record of mobilisation rather than its present establishment. The card opens the full cross-country comparison.
Intelligence & AssessmentBack to top ↑
- Imagery & Geospatial Intelligence
- Signals & Cyber Intelligence
- Technical & Measurement Intelligence
- Open-Source & Financial Intelligence
- Human Intelligence & Counterintelligence
- All-Source Analysis & Warning
Joint Command, Projection & SustainmentBack to top ↑
- Command, Control & Communications
- Strategic Lift & Mobility
- Expeditionary & Peace Operations
- Operational Sustainment & War Reserves
- Defence Industrial Mobilisation
- CBRN Defence
Land PowerBack to top ↑
- Combined Arms Manoeuvre
- Land Fires
- Battlefield Aviation & Uncrewed Systems
- Special Operations & Irregular Warfare
Maritime PowerBack to top ↑
- Maritime Security & Constabulary
- Sea Denial & Undersea Warfare
- Sea Control
- Amphibious & Expeditionary Operations
Air PowerBack to top ↑
- Air Sovereignty & Policing
- Control of the Air
- Air Strike & Interdiction
- Airborne ISR, Early Warning & Battle Management
Strategic Strike & Missile DefenceBack to top ↑
Space OperationsBack to top ↑
Cyber & Electromagnetic OperationsBack to top ↑
Nuclear DeterrenceBack to top ↑
GINC Capability Domains · Chapter 07
Human Capital
🇯🇴 Jordan’s population, health and the skills that sustain capability
DemographyBack to top ↑
7,930,491 (July 2014 est.)
3.86% (2014 est.)
25.23 births/1,000 population (2014 est.)
3.8 deaths/1,000 population (2014 est.)
3.16 children born/woman (2014 est.)
24.7
59.3% (2009)
Migration and urbanisationBack to top ↑
17.22 migrant(s)/1,000 population (2014 est.)
AMMAN (capital) 1.179 million (2011)
Welfare and equityBack to top ↑
14.2% (2002)
39.7 (2007)//36.4 (1997)
Early Childhood DevelopmentBack to top ↑
1.9% (2009)
Foundational EducationBack to top ↑
NA
Advanced EducationBack to top ↑
Technical & Vocational SkillsBack to top ↑
Digital & AI CompetenceBack to top ↑
Generative AI adoption
Modelled share of working-age adults using generative AI, from Microsoft telemetry scaled to each country’s 15–64 population. A measure of how fast a workforce is absorbing the technology rather than of how much of it a nation builds. The card opens the full cross-country comparison.
Lifelong Learning & ReskillingBack to top ↑
Research Talent & Knowledge CreationBack to top ↑
Population HealthBack to top ↑
63 deaths/100,000 live births (2010)
30% (2008)
less than 0.1% (2001 est.)
600 (2007 est.)
fewer than 500 (2003 est.)
Health System CapabilityBack to top ↑
8.4% of GDP (2011)
2.56 physicians/1,000 population (2010)
1.8 beds/1,000 population (2010)
GINC Capability Domains · Chapter 08
Governance and Integrity
🇯🇴 Jordan’s institutions, law and the integrity of the state
State structureBack to top ↑
constitutional monarchy
12 governorates (muhafazat, singular - muhafazah); 'Ajlun, Al 'Aqabah, Al Balqa', Al Karak, Al Mafraq, 'Amman, At Tafilah, Az Zarqa', Irbid, Jarash, Ma'an, Madaba
previous 1928 (preindependence); latest initially adopted 28 November 1947, revised and ratified 1 January 1952; amended several times, last in 2011 (2012)
18 years of age; universal
Political Institutions & Civic ParticipationBack to top ↑
- Electoral Management & Integrity
- Legislature & Deliberative Institutions
- Citizen Participation & Civic Space
bicameral National Assembly or Majlis al-'Umma consists of the Senate, also called the House of Notables or Majlis al-Ayan (60 seats; members appointed by the monarch to serve four-year terms) and the Chamber of Deputies, also called the House of Representatives or Majlis al-Nuwaab (150 seats; 123 members elected using the single, non-transferable vote system in multi-member districts, and 27 seats elected using a closed national list system based on proportional representation; all legislators serve four-year terms); note - the new electoral law enacted in July 2012 allocated an additional 10 seats (6 seats added to the number reserved for women, bringing the total to 15; 2 additional seats for Amman; and 1 seat each for the cities of Zarqa and Irbid; unchanged are 9 seats reserved for Christian candidates, 9 for Bedouin candidates, and 3 for Jordanians of Chechen or Circassian descent
Ahl al-Himma//Al-Bayyan//Al-Hayah Jordanian Party [Zahier AMR]//Arab Ba'ath Socialist Party [Akram al-HIMSI]//Ba'ath Arab Progressive Party [Fuad DABBOUR]//Citizenship//Construction//Cooperation//Dawn//Democratic People's Party [Ablah ABU ULBAH]//Democratic Popular Unity Party [Sa'id DIAB]//Dignity//Du'a Party [Muhammed ABU BAKR]//Free Voice//Islamic Action Front or IAF [Hamzah MANSOUR]//Islamic Centrist Party [Muhammad al-HAJ]//Jordanian Communist Party [Munir HAMARNAH]//Jordanian National Party [Muna ABU BAKR]//Jordanian United Front [Amjad al-MAJALI]//Labor and Trade//Nation//National Accord Youth Block//National Action//National Constitution Party [Ahmad al-SHUNAQ]//National Current Party [Abd al-Hadi al-MAJALI]//National Movement for Direct Democracy [Muhammad al-QAQ]//National Union//National Unity//Nobel Jerusalem//Risalah Party [Hazem QASHOU]//Salvation//Stronger Jordan//The Direct Democratic Nationalists Movement Party [Nash'at KHALIFAH]//The People//Unified Front//United Front//Voice of the Nation
15 April Movement [Mohammad SUNEID, chairman]//24 March Movement [Mu'az al-KHAWALIDAH, Abdel Rahman HASANEIN, spokespersons]//1952 Constitution Movement//Anti-Normalization Committee [Hamzah MANSOUR, chairman]//Economic and Social Association of Retired Servicemen and Veterans or ESARSV [Abdulsalam al-HASSANAT, chairman]//Group of 36//Higher Coordination Committee of Opposition Parties [Said DIAB]//Higher National Committee for Military Retirees or HNCMR [Ali al-HABASHNEH, chairman]//Hirak//Jordan Bar Association [Saleh al-ARMUTI, chairman]//Jordanian Campaign for Change or Jayin//Jordanian Muslim Brotherhood [Dr. Hamam SAID, controller general]//Jordanian Press Association [Sayf al-SHARIF, president]//National Front for Reform or NFR [Ahmad OBEIDAT, chairman]//Popular Gathering for Reform//Professional Associations Council [Abd al-Hadi al-FALAHAT, chairman]//Sons of Jordan
Justice System & Fundamental RightsBack to top ↑
- Judicial Independence & Court Capability
- Access to Justice & Legal Services
- Fundamental Rights Protection
- Human Rights Institutions & Equality Bodies
mixed legal system of civil law and Islamic religious law; judicial review of legislative acts in a specially provided High Tribunal
has not submitted an ICJ jurisdiction declaration; accepts ICCt jurisdiction
Internal Security & OrderBack to top ↑
Regulatory Governance & Strategic ControlsBack to top ↑
- Regulatory Quality & Better Regulation
- Regulatory Delivery & Independent Regulators
- Strategic Controls & Economic Security Administration
Government Effectiveness & Public AdministrationBack to top ↑
- Centre of Government & Policy Coordination
- Civil Service & Public Workforce
- Digital Government & Service Delivery
- Legal Identity & Civil Registration
- Statistical & Data Capability
Public Integrity & Anti-CorruptionBack to top ↑
Transparency, Oversight & AccountabilityBack to top ↑
- Right to Information & Open Government
- Independent Oversight & Supreme Audit
- Independent Media & Journalist Safety
National Resilience & Crisis ManagementBack to top ↑
GINC Capability Domains · Chapter 09
Information and Influence
🇯🇴 Jordan’s identity, media and the projection of influence
Identity and cultureBack to top ↑
Arabic (official), English (widely understood among upper and middle classes)
Muslim 97.2% (official; predominantly Sunni), Christian 2.2% (majority Greek Orthodox, but some Greek and Roman Catholics, Syrian Orthodox, Coptic Orthodox, Armenian Orthodox, and Protestant denominations), Buddhist 0.4%, Hindu 0.1%, Jewish
Arab 98%, Circassian 1%, Armenian 1%
eagle
three equal horizontal bands of black (top), representing the Abbassid Caliphate, white, representing the Ummayyad Caliphate, and green, representing the Fatimid Caliphate; a red isosceles triangle on the hoist side, representing the Great Arab Revolt of 1916, and bearing a small white seven-pointed star symbolizing the seven verses of the opening Sura (Al-Fatiha) of the Holy Koran; the seven points on the star represent faith in One God, humanity, national spirit, humility, social justice, virtue, and aspirations; design is based on the Arab Revolt flag of World War I
Diplomatic Statecraft & Global NetworksBack to top ↑
- Diplomatic Network & Consular Reach
- Multilateral Leadership & Norm Setting
- Agenda-Setting & Convening
- Mediation & Crisis Diplomacy
ABEDA, AFESD, AMF, CAEU, CD, CICA, EBRD, FAO, G-11, G-77, IAEA, IBRD, ICAO, ICC (national committees), ICRM, IDA, IDB, IFAD, IFC, IFRCS, ILO, IMF, IMO, Interpol, IOC, IOM, IPU, ISO, ITSO, ITU, ITUC (NGOs), LAS, MIGA, MINUSTAH, MINUSMA, MONUSCO, NAM, OIC, OPCW, OSCE (partner), PCA, UN, UN Security Council (temporary), UNAMID, UNCTAD, UNESCO, UNHCR, UNIDO, UNISFA, UNMIL, UNMISS, UNOCI, UNRWA, UNWTO, UPU, WCO, WFTU (NGOs), WHO, WIPO, WMO, WTO
Alliances & Security CooperationBack to top ↑
Development Cooperation & Global AssistanceBack to top ↑
Culture, Language & Education DiplomacyBack to top ↑
- Cultural & Language Institutes
- Creative Industries & Cultural Export Reach
- Heritage & Cultural Institutions
- Education Diplomacy & Alumni Networks
- Sports & Major Events
Diaspora & Global CommunitiesBack to top ↑
Information Environment & Strategic CommunicationBack to top ↑
- Strategic Communications & Public Diplomacy
- International Media & Broadcasting
- Information Defence & Counter-Interference
radio and TV dominated by the government-owned Jordan Radio and Television Corporation (JRTV) that operates a main network, a sports network, a film network, and a satellite channel; first independent TV broadcaster aired in 2007; international satellite TV and Israeli and Syrian TV broadcasts are available; roughly 30 radio stations with JRTV operating the main government-owned station; transmissions of multiple international radio broadcasters are available (2007)
GINC Capability Domains · Chapter 10
Financial Strength
🇯🇴 Jordan’s fiscal depth, reserves and the capacity to act
Monetary & Currency CapabilityBack to top ↑
- Monetary Policy & Price Stability
- Exchange Rate & External Account Management
- Currency Issuance & Digital Money
5.9% (2013 est.)//4.8% (2012 est.)
Jordanian dinars (JOD) per US dollar -//0.709 (2013 est.)//0.709 (2012 est.)//0.71 (2010 est.)//0.709 (2009)//0.709 (2008)
0.3% (31 December 2010 est.)//$NA (31 December 2009 est.)
8.9% (31 December 2013 est.)//8.95% (31 December 2012 est.)
$10.68 billion (31 December 2013 est.)//$10.17 billion (31 December 2012 est.)
$37.19 billion (31 December 2013 est.)//$35.18 billion (31 December 2012 est.)
Fiscal Capacity & Public FinanceBack to top ↑
- Revenue Mobilisation & Tax Administration
- Public Expenditure & Budget Management
- Sovereign Debt & Treasury Management
- Public Investment Management
20.2% of GDP (2013 est.)
-11.3% of GDP (2013 est.)
79.1% of GDP (2013 est.)//75.5% of GDP (2012 est.)
calendar year
Financial System Depth & AccessBack to top ↑
- Banking System Capacity
- Capital Markets Depth & Development
- Long-Term & Institutional Capital
- Financial Inclusion & Household Access
- Development & Policy Finance
$38.3 billion (31 December 2013 est.)//$35.39 billion (31 December 2012 est.)
$27 billion (31 December 2012 est.)//$27.18 billion (31 December 2011)//$30.86 billion (31 December 2010 est.)
29.1% of GDP (2013 est.)//24.7% of GDP (2012 est.)//28.5% of GDP (2011 est.)
Financial Regulation & IntegrityBack to top ↑
- Prudential Regulation & Supervision
- Financial Integrity & Illicit Finance Control
- Market Conduct & Consumer Protection
- Payment & Market Infrastructure Oversight
Financial Stability & Crisis ManagementBack to top ↑
- Macroprudential & Systemic Oversight
- Crisis Management, Resolution & Deposit Insurance
- External Liquidity & Financial Safety Nets
Sovereign Capital & External Financial PowerBack to top ↑
- Official Reserves Management
- Sovereign Wealth & Public Asset Management
- Currency Internationalisation & Reserve Status
- Capital Account & Flow Management
- International Financial Centre Capability
$11.83 billion (31 December 2013 est.)//$8.829 billion (31 December 2012 est.)
$22.04 billion (31 December 2013 est.)//$19.67 billion (31 December 2012 est.)
GINC Capability Domains · Chapter 11
Production and Innovation
🇯🇴 Jordan’s output, industry and the engine of prosperity
Economic Output & ProductivityBack to top ↑
Jordan's economy is among the smallest in the Middle East, with insufficient supplies of water, oil, and other natural resources underlying the government's heavy reliance on foreign assistance. Other economic challenges for the government include chronic high rates of poverty, unemployment, inflation, and a large budget deficit. Since assuming the throne in 1999, King ABDALLAH has implemented significant economic reforms, such as opening the trade regime, privatizing state-owned companies, and eliminating some fuel subsidies, which in the last decade spurred economic growth by attracting foreign investment and creating some jobs. The global economic slowdown and regional turmoil, however, have depressed Jordan's GDP growth, impacting export-oriented sectors, construction, and tourism. In 2011 and 2012, the government approved two economic relief packages and a budgetary supplement, meant to improve the living conditions for the middle and poor classes. Jordan's finances have also been strained by a series of natural gas pipeline attacks in Egypt, causing Jordan to substitute more expensive diesel imports, primarily from Saudi Arabia, to generate electricity. Jordan is currently exploring nuclear power generation in addition to the exploitation of abundant oil shale reserves and renewable technologies to forestall energy shortfalls. In 2012, to correct budgetary and balance of payments imbalances, Jordan entered into a $2.1 billion, multiple year International Monetary Fund Stand-By Arrangement. Jordan's financial sector has been relatively isolated from the international financial crisis because of its limited exposure to overseas capital markets. In 2013, Jordan depended heavily on foreign assistance to finance the budget deficit, as the influx of about 600,000 Syrian refugees put additional pressure on expenditures.
$40.02 billion (2013 est.)//$38.76 billion (2012 est.)//$37.71 billion (2011 est.)
3.3% (2013 est.)//2.8% (2012 est.)//2.6% (2011 est.)
$6,100 (2013 est.)//$6,100 (2012 est.)//$6,000 (2011 est.)
$34.08 billion (2013 est.)
Labour & EmploymentBack to top ↑
- Employment & Labour Force Participation
- Labour Market Institutions & Wage Setting
- Employment Services & Skills Matching
- Labour Adjustment, Transition & Formalisation
1.898 million (2013 est.)
14% (2013 est.)//12.5% (2012 est.)
Industrial & Sectoral BaseBack to top ↑
- Manufacturing & Advanced Industry
- Foundational & Process Industries
- Agrifood & Primary Production
- Services Economy
citrus, tomatoes, cucumbers, olives, strawberries, stone fruits; sheep, poultry, dairy
clothing, fertilizers, potash, phosphate mining, pharmaceuticals, petroleum refining, cement, inorganic chemicals, light manufacturing, tourism
2.8% (2013 est.)
Structural Transformation & ComplexityBack to top ↑
Business Dynamism & EntrepreneurshipBack to top ↑
- Entrepreneurship & Firm Creation
- Risk Capital & Scale-Up Finance
- Firm Growth, Exit & Renewal
- Competition & Market Contestability
Innovation & CommercialisationBack to top ↑
- Business Innovation Capability
- Research Commercialisation & Knowledge Transfer
- Intellectual Property & Intangible Assets
- Innovation Ecosystems & Clusters
Technology Adoption & DiffusionBack to top ↑
GINC Capability Domains · Chapter 12
Trade and Investment
🇯🇴 Jordan’s markets, capital and the terms of global exchange
Overall tradeBack to top ↑
$10.5B of exports to 128 partners and $21.1B of imports from 107 in 2024, a deficit of $10.6B.
- Exports
- $10.5B128 partners
- Imports
- $21.1B107 partners
- Balance
- −$10.6Bdeficit
- Total trade
- $31.6B2024
ExportsBack to top ↑
Where its exports go
The largest partners in 2024, with each one's share of the nation's exports.
| Partner | Value | Share | |
|---|---|---|---|
| United States | $3.36B | 32% | |
| India | $1.67B | 16% | |
| Saudi Arabia | $1.49B | 14% | |
| China | $442M | 4.2% | |
| Israel | $368M | 3.5% | |
| Egypt | $256M | 2.4% | |
| Indonesia | $217M | 2.1% | |
| Kuwait | $212M | 2.0% | |
| Qatar | $175M | 1.7% | |
| Brazil | $123M | 1.2% | |
| Canada | $117M | 1.1% | |
| United Kingdom | $112M | 1.1% | |
| Switzerland | $105M | 1.0% | |
| Germany | $104M | 1.0% | |
| Lebanon | $99.4M | 0.9% | |
| Turkey | $96.3M | 0.9% | |
| Australia | $91.1M | 0.9% | |
| Morocco | $90.8M | 0.9% | |
| Netherlands | $90.4M | 0.9% | |
| Italy | $83.6M | 0.8% |
What it exports
The largest categories in 2024.
| Category | Value | Share | |
|---|---|---|---|
| Articles of apparel, knit or crocheted | $1.94B | 19% | |
| Fertilizers | $1.21B | 12% | |
| Pearls, precious stones, metals, coins | $1.13B | 11% | |
| Salt, sulphur, earth, stone, plaster, lime and cement | $1.06B | 10% | |
| Inorganic chemicals, precious metal compound, isotope | $1.04B | 10.0% | |
| Articles of apparel, not knit or crocheted | $577M | 5.5% | |
| Pharmaceutical products | $531M | 5.1% | |
| Machinery, nuclear reactors, boilers | $226M | 2.2% | |
| Organic chemicals | $195M | 1.9% | |
| Edible vegetables and certain roots and tubers | $182M | 1.7% | |
| Plastics | $162M | 1.5% | |
| Electrical, electronic equipment | $155M | 1.5% | |
| Aluminum | $131M | 1.3% | |
| Live animals | $130M | 1.2% | |
| Edible fruits, nuts, peel of citrus fruit, melons | $129M | 1.2% |
ImportsBack to top ↑
Where its imports come from
The largest partners in 2024, with each one's share of the nation's imports.
| Partner | Value | Share | |
|---|---|---|---|
| China | $4.81B | 23% | |
| Saudi Arabia | $2.12B | 10% | |
| United States | $1.75B | 8.3% | |
| Turkey | $1.04B | 4.9% | |
| India | $954M | 4.5% | |
| Germany | $912M | 4.3% | |
| Egypt | $752M | 3.6% | |
| Indonesia | $705M | 3.3% | |
| Italy | $688M | 3.3% | |
| Switzerland | $593M | 2.8% | |
| South Korea | $547M | 2.6% | |
| United Kingdom | $546M | 2.6% | |
| Brazil | $540M | 2.6% | |
| Japan | $465M | 2.2% | |
| Netherlands | $459M | 2.2% | |
| Spain | $376M | 1.8% | |
| Romania | $330M | 1.6% | |
| France | $322M | 1.5% | |
| Belgium | $230M | 1.1% | |
| Taiwan | $161M | 0.8% |
What it imports
The largest categories in 2024.
| Category | Value | Share | |
|---|---|---|---|
| Vehicles other than railway, tramway | $2.68B | 13% | |
| Machinery, nuclear reactors, boilers | $1.75B | 8.3% | |
| Plastics | $1.27B | 6.0% | |
| Electrical, electronic equipment | $1.19B | 5.6% | |
| Pearls, precious stones, metals, coins | $1.13B | 5.4% | |
| Pharmaceutical products | $780M | 3.7% | |
| Mineral fuels, oils, distillation products | $698M | 3.3% | |
| Knitted or crocheted fabric | $603M | 2.9% | |
| Cereals | $571M | 2.7% | |
| Organic chemicals | $496M | 2.4% | |
| Meat and edible meat offal | $471M | 2.2% | |
| Iron and steel | $428M | 2.0% | |
| Optical, photo, technical, medical apparatus | $416M | 2.0% | |
| Paper and paperboard, articles of pulp, paper and board | $327M | 1.5% | |
| Dairy products, eggs, honey, edible products | $318M | 1.5% |
In a list, the bar runs to the largest in that list. The line is each figure’s history from 2000, drawn to its own peak: it shows the shape of the years, and the value shows the size.
External balanceBack to top ↑
-$4.766 billion (2013 est.)//-$5.37 billion (2012 est.)
Trade Facilitation & LogisticsBack to top ↑
Trade Policy & Market AccessBack to top ↑
- Trade Policy & Negotiation Capability
- Market Access & Agreements Network
- Trade Law & Enforcement
- Standards, Conformity & Quality Infrastructure
Digital & Services TradeBack to top ↑
- Services Trade Capability
- Digital Trade & E-Commerce
- Data Flows & Digital Trade Governance
- Tourism & Visitor Economy
Investment Attraction & ProjectionBack to top ↑
- Investment Attraction & Facilitation
- Investment Absorption & Linkages
- Outward Investment & Global Corporate Presence
$26.69 billion (31 December 2013 est.)//$24.78 billion (31 December 2012 est.)
$549 million (31 December 2013 est.)//$509 million (31 December 2012 est.)
Export Capability & SophisticationBack to top ↑
$7.914 billion (2013 est.)//$7.898 billion (2012 est.)
US 16.6%, Iraq 15.1%, Saudi Arabia 11%, India 10.5%, Indonesia 4.2% (2012)
clothing, fertilizers, potash, phosphates, vegetables, pharmaceuticals
Global Value Chain PositionBack to top ↑
- Value Chain Participation & Integration
- Value Chain Position & Upgrading
- Regional Integration & Hub Anchoring
Economic Leverage & DependenceBack to top ↑
- Strategic Supply Security
- Concentration Risk & Revenue Stabilisation
- Economic Leverage & Coercion Resistance
$18.61 billion (2013 est.)//$18.46 billion (2012 est.)
Saudi Arabia 23.6%, China 9.4%, US 6.7%, Italy 4.7%, Turkey 4.6% (2012)
crude oil, machinery, transport equipment, iron, cereals
Jordan · you are in
Historical Context
Foundations
GINC Capability Domains
Find in this brief · Jordan