
Burundi
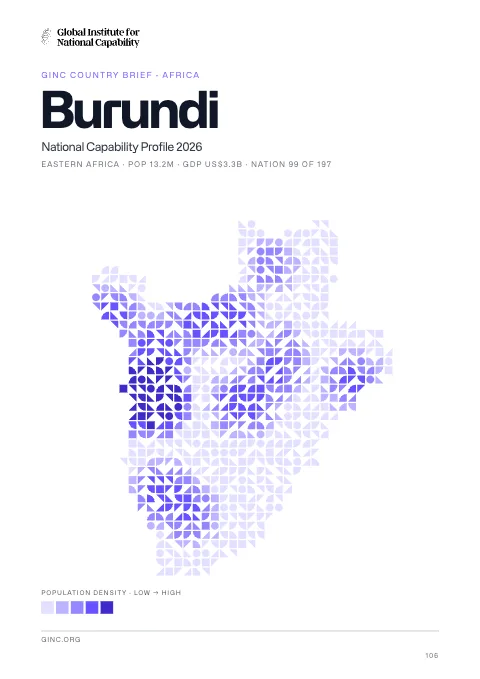
Burundi is a landlocked republic in Africa, home to 10 million people, with its capital at Bujumbura.
Contents
12 chapters
Foundations
01–03
At a glance
- Area
- 27.8Kkm²#146 World#46 Africa
- Population
- 10.4M#85 World#31 Africa
- GDP (market)
- $2.7B
- GDP (PPP)
- $5.8B#167 World#43 Africa
- GDP per capita
- $600#225 World#53 Africa
The whole brief
Burundi National Capability Profile 2026
Foundations · Chapter 01
Historical Context
🇧🇮 Burundi’s understanding the origins and evolution of the modern nation
BackgroundBack to top ↑
Burundi's first democratically elected president was assassinated in October 1993 after only 100 days in office, triggering widespread ethnic violence between Hutu and Tutsi factions. More than 200,000 Burundians perished during the conflict that spanned almost a dozen years. Hundreds of thousands of Burundians were internally displaced or became refugees in neighboring countries. An internationally brokered power-sharing agreement between the Tutsi-dominated government and the Hutu rebels in 2003 paved the way for a transition process that led to an integrated defense force, established a new constitution in 2005, and elected a majority Hutu government in 2005. The government of President Pierre NKURUNZIZA, who was reelected in 2010, continues to face many political and economic challenges.
IndependenceBack to top ↑
1 July 1962 (from UN trusteeship under Belgian administration)
National holidayBack to top ↑
Independence Day, 1 July (1962)
Foundations · Chapter 02
Geography
🇧🇮 Burundi’s territory, resources and strategic position
Location and areaBack to top ↑
Central Africa, east of Democratic Republic of the Congo
3 30 S, 30 00 E
Africa
slightly smaller than Maryland
0 km (landlocked)
none (landlocked)
Terrain and resourcesBack to top ↑
hilly and mountainous, dropping to a plateau in east, some plains
nickel, uranium, rare earth oxides, peat, cobalt, copper, platinum, vanadium, arable land, hydropower, niobium, tantalum, gold, tin, tungsten, kaolin, limestone
214.3 sq km (2003)
Settlement and hazardsBack to top ↑
flooding; landslides; drought
landlocked; straddles crest of the Nile-Congo watershed; the Kagera, which drains into Lake Victoria, is the most remote headstream of the White Nile
OtherBack to top ↑
12.54 cu km (2011)
soil erosion as a result of overgrazing and the expansion of agriculture into marginal lands; deforestation (little forested land remains because of uncontrolled cutting of trees for fuel); habitat loss threatens wildlife populations
Foundations · Chapter 03
Environment
🇧🇮 Burundi’s environmental conditions, resources and national resilience
ClimateBack to top ↑
equatorial; high plateau with considerable altitude variation (772 m to 2,670 m above sea level); average annual temperature varies with altitude from 23 to 17 degrees centigrade but is generally moderate as the average altitude is about 1,700 m; average annual rainfall is about 150 cm; two wet seasons (February to May and September to November), and two dry seasons (June to August and December to January)
Emissions and pollutionBack to top ↑
Water, waste and foodBack to top ↑
Resources and agreementsBack to top ↑
GINC Capability Domains · Chapter 04
Critical Technology
🇧🇮 Burundi’s technology frontiers and the pursuit of national advantage
Two counts are set side by side for 2015–2024: on the left, the papers researchers in Burundi published; on the right, the patent families that began there and were filed in more than one country. First by capability group, then group by group with each group’s capabilities. The badge on a card is the nation’s place among all nations. Papers are from GINC Research Analytics, patent families from GINC Patents.
Research by capability group
#126 WorldPapers published, 2015–2024
Patents by capability group
International patent families, 2015–2024
No international patent families on record for 2015–2024.
Advanced Materials & ManufacturingBack to top ↑
Research
#117 WorldPapers published, 2015–2024
Patents
International patent families, 2015–2024
No international patent families on record for 2015–2024.
Energy TechnologiesBack to top ↑
Research
#137 WorldPapers published, 2015–2024
Patents
International patent families, 2015–2024
No international patent families on record for 2015–2024.
Semiconductors & Advanced ComputingBack to top ↑
Research
#121 WorldPapers published, 2015–2024
No research topic: Semiconductor Design & EDA · Advanced Semiconductor Fabrication · Semiconductor Equipment & Materials · Advanced Packaging & Heterogeneous Integration
Patents
International patent families, 2015–2024
No international patent families on record for 2015–2024.
Artificial IntelligenceBack to top ↑
Research
#125 WorldPapers published, 2015–2024
Patents
International patent families, 2015–2024
No international patent families on record for 2015–2024.
Quantum TechnologiesBack to top ↑
Research
#64 WorldPapers published, 2015–2024
Patents
International patent families, 2015–2024
No international patent families on record for 2015–2024.
Connectivity, Cyber & Trust TechnologiesBack to top ↑
Research
#144 WorldPapers published, 2015–2024
Patents
International patent families, 2015–2024
No international patent families on record for 2015–2024.
Sensing, Timing & NavigationBack to top ↑
Research
#140 WorldPapers published, 2015–2024
Patents
International patent families, 2015–2024
No international patent families on record for 2015–2024.
Robotics & Autonomous SystemsBack to top ↑
Research
#125 WorldPapers published, 2015–2024
No research topic: Human-Machine Interfaces
Patents
International patent families, 2015–2024
No international patent families on record for 2015–2024.
Biotechnology & Health TechnologiesBack to top ↑
Research
#149 WorldPapers published, 2015–2024
Patents
International patent families, 2015–2024
No international patent families on record for 2015–2024.
Medicine and BioTech
Clinical research and life-science invention, drawn from the same series that drive the metric pages. Each card opens the full cross-country comparison.
Space TechnologiesBack to top ↑
- Space Launch & Reusable Systems
- Advanced Propulsion & Hypersonic Systems
- Satellite & Constellation Technologies
GINC Capability Domains · Chapter 05
Strategic Infrastructure
🇧🇮 Burundi’s energy, connectivity and the material foundations of capability
Resource InfrastructureBack to top ↑
0 bbl/day (2012 est.)
0 bbl/day (2010 est.)
0 bbl/day (2010 est.)
0 bbl (1 January 2013 est.)
0 bbl/day (2010 est.)
2,290 bbl/day (2011 est.)
0 bbl/day (2010 est.)
1,429 bbl/day (2010 est.)
0 cu m (2011 est.)
0 cu m (2010 est.)
0 cu m (2011 est.)
0 cu m (2011 est.)
0 cu m (1 January 2013 est.)
Agriculture & Food InfrastructureBack to top ↑
- Irrigation & Agricultural Water
- Livestock & Veterinary
- Fisheries & Aquaculture
- Storage, Cold Chain & Markets
Energy InfrastructureBack to top ↑
- Thermal Generation
- Nuclear Generation
- Nuclear Fuel Cycle & Radioactive Waste
- Hydropower
- Renewable Generation
- Transmission & Distribution
- System Control & Dispatch
- Storage & Fuel Supply
52,000 kW (2010 est.)
152 million kWh (2010 est.)
221.4 million kWh (2010 est.)
0 kWh (2012 est.)
80 million kWh (2010 est.)
1.9% of total installed capacity (2010 est.)
0% of total installed capacity (2010 est.)
98.1% of total installed capacity (2010 est.)
0% of total installed capacity (2010 est.)
204,700 Mt (2011 est.)
Water, Sanitation & Waste InfrastructureBack to top ↑
- Dams, Reservoirs & Flood Defence
- Water Supply & Treatment
- Bulk Water Transfer & Desalination
- Wastewater & Sanitation
- Solid Waste & Recycling
Advanced ManufacturingBack to top ↑
- Materials & Inputs
- Chemicals & Hazardous Process Industry
- Production Systems
- Supply Chain & Ecosystem
- Workforce & Innovation
Transport InfrastructureBack to top ↑
- Seaports & Terminals
- Air Infrastructure
- Air Navigation & Traffic Management
- Inland Waterways & Ferries
- Rail Infrastructure
- Roads & Bridges
- Logistics, Multimodal & Border Infrastructure
- Postal & Parcel
7 (2013)
1 (2012)
(mainly on Lake Tanganyika between Bujumbura, Burundi's principal port, and lake ports in Tanzania, Zambia, and the Democratic Republic of Congo) (2011)
Communications & Digital InfrastructureBack to top ↑
- Subsea Cables & International Gateways
- Core & Backbone Networks
- Mobile & Wireless Networks
- Spectrum & Broadcasting
- Data Centres, Compute & Cloud
- Data Resources
- AI Tools & Applications
17,400 (2012)
2.247 million (2012)
157,800 (2009)
229 (2012)
.bi
Financial InfrastructureBack to top ↑
- Currency & Reserves
- Payments & Settlement Systems
- Markets, Exchanges & Depositories
- Banks, Insurers & Systemic Institutions
Social InfrastructureBack to top ↑
- Health Infrastructure
- Public Health & Laboratories
- Medical Supply & Stockpiles
- Education & Skills Infrastructure
- Research & Scientific Facilities
- Housing, Community & Social Services
- Government & Public Administration
- Cultural, Community & Recreational Infrastructure
- Justice & Corrections
- Emergency Services & Civil Protection
- Hydrometeorology & Early Warning
Space, Aerospace & Defence InfrastructureBack to top ↑
GINC Capability Domains · Chapter 06
National Security
🇧🇮 Burundi’s force, intelligence and the defence of the nation
Disputes and terrorismBack to top ↑
Burundi and Rwanda dispute two sq km (0.8 sq mi) of Sabanerwa, a farmed area in the Rukurazi Valley where the Akanyaru/Kanyaru River shifted its course southward after heavy rains in 1965; cross-border conflicts persist among Tutsi, Hutu, other ethnic groups, associated political rebels, armed gangs, and various government forces in the Great Lakes region
Force Generation & MobilisationBack to top ↑
National Defense Forces (Forces de Defense Nationale, FDN): Army (includes maritime wing, Air Wing), National Gendarmerie (2013)
18 years of age for voluntary military service; the armed forces law of 31 December 2004 did not specify a minimum age for enlistment, but the government claimed that no one younger than 18 was being recruited; mandatory retirement age 45 (enlisted), 50 (NCOs), and 55 (officers) (2012)
2.39% of GDP (2012)//NA% (2011)//2.39% of GDP (2010)
Forces under arms
Active-duty strength on the Correlates of War series, which reaches back to 1816 and so carries a nation’s whole record of mobilisation rather than its present establishment. The card opens the full cross-country comparison.
Intelligence & AssessmentBack to top ↑
- Imagery & Geospatial Intelligence
- Signals & Cyber Intelligence
- Technical & Measurement Intelligence
- Open-Source & Financial Intelligence
- Human Intelligence & Counterintelligence
- All-Source Analysis & Warning
Joint Command, Projection & SustainmentBack to top ↑
- Command, Control & Communications
- Strategic Lift & Mobility
- Expeditionary & Peace Operations
- Operational Sustainment & War Reserves
- Defence Industrial Mobilisation
- CBRN Defence
Land PowerBack to top ↑
- Combined Arms Manoeuvre
- Land Fires
- Battlefield Aviation & Uncrewed Systems
- Special Operations & Irregular Warfare
Maritime PowerBack to top ↑
- Maritime Security & Constabulary
- Sea Denial & Undersea Warfare
- Sea Control
- Amphibious & Expeditionary Operations
Air PowerBack to top ↑
- Air Sovereignty & Policing
- Control of the Air
- Air Strike & Interdiction
- Airborne ISR, Early Warning & Battle Management
Strategic Strike & Missile DefenceBack to top ↑
Space OperationsBack to top ↑
Cyber & Electromagnetic OperationsBack to top ↑
Nuclear DeterrenceBack to top ↑
GINC Capability Domains · Chapter 07
Human Capital
🇧🇮 Burundi’s population, health and the skills that sustain capability
DemographyBack to top ↑
10,395,931
3.28% (2014 est.)
42.33 births/1,000 population (2014 est.)
9.54 deaths/1,000 population (2014 est.)
6.14 children born/woman (2014 est.)
21.3
21.9% (2010/11)
Migration and urbanisationBack to top ↑
0 migrant(s)/1,000 population (2014 est.)
BUJUMBURA (capital) 605,000 (2011)
Welfare and equityBack to top ↑
68% (2002 est.)
42.4 (1998)
DisplacementBack to top ↑
Early Childhood DevelopmentBack to top ↑
29.1% (2011)
Foundational EducationBack to top ↑
5.8% of GDP (2012)
Advanced EducationBack to top ↑
Technical & Vocational SkillsBack to top ↑
Digital & AI CompetenceBack to top ↑
Generative AI adoption
Modelled share of working-age adults using generative AI, from Microsoft telemetry scaled to each country’s 15–64 population. A measure of how fast a workforce is absorbing the technology rather than of how much of it a nation builds. The card opens the full cross-country comparison.
Lifelong Learning & ReskillingBack to top ↑
Research Talent & Knowledge CreationBack to top ↑
Population HealthBack to top ↑
800 deaths/100,000 live births (2010)
2.9% (2008)
1.3% (2012 est.)
89,500 (2012 est.)
4,800 (2012 est.)
Health System CapabilityBack to top ↑
8.7% of GDP (2011)
0.03 physicians/1,000 population (2004)
1.9 beds/1,000 population (2011)
GINC Capability Domains · Chapter 08
Governance and Integrity
🇧🇮 Burundi’s institutions, law and the integrity of the state
State structureBack to top ↑
republic
17 provinces; Bubanza, Bujumbura Mairie, Bujumbura Rural, Bururi, Cankuzo, Cibitoke, Gitega, Karuzi, Kayanza, Kirundo, Makamba, Muramvya, Muyinga, Mwaro, Ngozi, Rutana, Ruyigi
several previous; latest ratified by popular referendum 28 February 2005 (2012)
18 years of age; universal
Political Institutions & Civic ParticipationBack to top ↑
- Electoral Management & Integrity
- Legislature & Deliberative Institutions
- Citizen Participation & Civic Space
bicameral Parliament or Parlement, consists of a Senate (54 seats; 34 members elected by indirect vote to serve five-year terms, with remaining seats assigned to ethnic groups and former chiefs of state) and a National Assembly or Assemblee Nationale (minimum 100 seats, 60% Hutu and 40% Tutsi with at least 30% being women; additional seats appointed by a National Independent Electoral Commission to ensure ethnic representation; members are elected by popular vote to serve five-year terms)
Forum for the Strengthening of Civil Society or FORSC [Pacifique NININAHAZWE] (civil society umbrella organization)//Observatoire de lutte contre la corruption et les malversations economiques or OLUCOME [Gabriel RUFYIRI] (anti-corruption pressure group)
Justice System & Fundamental RightsBack to top ↑
- Judicial Independence & Court Capability
- Access to Justice & Legal Services
- Fundamental Rights Protection
- Human Rights Institutions & Equality Bodies
mixed legal system of Belgian civil law and customary law
has not submitted an ICJ jurisdiction declaration; accepts ICCt jurisdiction
Internal Security & OrderBack to top ↑
Regulatory Governance & Strategic ControlsBack to top ↑
- Regulatory Quality & Better Regulation
- Regulatory Delivery & Independent Regulators
- Strategic Controls & Economic Security Administration
Government Effectiveness & Public AdministrationBack to top ↑
- Centre of Government & Policy Coordination
- Civil Service & Public Workforce
- Digital Government & Service Delivery
- Legal Identity & Civil Registration
- Statistical & Data Capability
Public Integrity & Anti-CorruptionBack to top ↑
Transparency, Oversight & AccountabilityBack to top ↑
- Right to Information & Open Government
- Independent Oversight & Supreme Audit
- Independent Media & Journalist Safety
National Resilience & Crisis ManagementBack to top ↑
GINC Capability Domains · Chapter 09
Information and Influence
🇧🇮 Burundi’s identity, media and the projection of influence
Identity and cultureBack to top ↑
Kirundi 29.7% (official), Kirundi and other language 9.1%, French (official) and French and other language 0.3%, Swahili and Swahili and other language 0.2% (along Lake Tanganyika and in the Bujumbura area), English and English and other language 0.06%, more than 2 languages 3.7%, unspecified 56.9% (2008 est.)
Catholic 62.1%, Protestant 23.9% (includes Adventist 2.3% and other Protestant 21.6%), Muslim 2.5%, other 3.6%, unspecified 7.9% (2008 est.)
Hutu (Bantu) 85%, Tutsi (Hamitic) 14%, Twa (Pygmy) 1%, Europeans 3,000, South Asians 2,000
lion
divided by a white diagonal cross into red panels (top and bottom) and green panels (hoist side and fly side) with a white disk superimposed at the center bearing three red six-pointed stars outlined in green arranged in a triangular design (one star above, two stars below); green symbolizes hope and optimism, white purity and peace, and red the blood shed in the struggle for independence; the three stars in the disk represent the three major ethnic groups: Hutu, Twa, Tutsi, as well as the three elements in the national motto: unity, work, progress
Diplomatic Statecraft & Global NetworksBack to top ↑
- Diplomatic Network & Consular Reach
- Multilateral Leadership & Norm Setting
- Agenda-Setting & Convening
- Mediation & Crisis Diplomacy
ACP, AfDB, AU, CEPGL, COMESA, EAC, FAO, G-77, IAEA, IBRD, ICAO, ICRM, IDA, IFAD, IFC, IFRCS, ILO, IMF, Interpol, IOC, IOM, IPU, ISO (correspondent), ITU, ITUC (NGOs), MIGA, NAM, OIF, OPCW, UN, UNAMID, UNCTAD, UNESCO, UNIDO, UNISFA, UNWTO, UPU, WCO, WHO, WIPO, WMO, WTO
Alliances & Security CooperationBack to top ↑
Development Cooperation & Global AssistanceBack to top ↑
Culture, Language & Education DiplomacyBack to top ↑
- Cultural & Language Institutes
- Creative Industries & Cultural Export Reach
- Heritage & Cultural Institutions
- Education Diplomacy & Alumni Networks
- Sports & Major Events
Diaspora & Global CommunitiesBack to top ↑
Information Environment & Strategic CommunicationBack to top ↑
- Strategic Communications & Public Diplomacy
- International Media & Broadcasting
- Information Defence & Counter-Interference
state-controlled La Radiodiffusion et Television Nationale de Burundi (RTNB) operates the lone TV station and the only national radio network; about 10 privately owned radio stations; transmissions of several international broadcasters are available in Bujumbura (2007)
GINC Capability Domains · Chapter 10
Financial Strength
🇧🇮 Burundi’s fiscal depth, reserves and the capacity to act
Monetary & Currency CapabilityBack to top ↑
- Monetary Policy & Price Stability
- Exchange Rate & External Account Management
- Currency Issuance & Digital Money
9.3% (2013 est.)//18% (2012 est.)
Burundi francs (BIF) per US dollar -//1,556.5 (2013 est.)//1,442.51 (2012 est.)//1,230.8 (2010 est.)//1,230.18 (2009)//1,198 (2008)
11.25% (31 December 2010 est.)//10% (31 December 2009 est.)
13.7% (31 December 2013 est.)//14.32% (31 December 2012 est.)
$339.4 million (31 December 2013 est.)//$332.5 million (31 December 2012 est.)
$471.1 million (31 December 2013 est.)//$458.3 million (31 December 2012 est.)
Fiscal Capacity & Public FinanceBack to top ↑
- Revenue Mobilisation & Tax Administration
- Public Expenditure & Budget Management
- Sovereign Debt & Treasury Management
- Public Investment Management
28.7% of GDP (2013 est.)
-3.3% of GDP (2013 est.)
47.6% of GDP (2013 est.)//50.3% of GDP (2012 est.)
calendar year
Financial System Depth & AccessBack to top ↑
- Banking System Capacity
- Capital Markets Depth & Development
- Long-Term & Institutional Capital
- Financial Inclusion & Household Access
- Development & Policy Finance
$597.2 million (31 December 2013 est.)//$572.2 million (31 December 2012 est.)
$NA
-0.9% of GDP (2013 est.)//-0.8% of GDP (2012 est.)//6.3% of GDP (2011 est.)
Financial Regulation & IntegrityBack to top ↑
- Prudential Regulation & Supervision
- Financial Integrity & Illicit Finance Control
- Market Conduct & Consumer Protection
- Payment & Market Infrastructure Oversight
Financial Stability & Crisis ManagementBack to top ↑
- Macroprudential & Systemic Oversight
- Crisis Management, Resolution & Deposit Insurance
- External Liquidity & Financial Safety Nets
Sovereign Capital & External Financial PowerBack to top ↑
- Official Reserves Management
- Sovereign Wealth & Public Asset Management
- Currency Internationalisation & Reserve Status
- Capital Account & Flow Management
- International Financial Centre Capability
$314.6 million (31 December 2013 est.)//$308.8 million (31 December 2012 est.)
$677.2 million (31 December 2013 est.)//$641.9 million (31 December 2012 est.)
GINC Capability Domains · Chapter 11
Production and Innovation
🇧🇮 Burundi’s output, industry and the engine of prosperity
Economic Output & ProductivityBack to top ↑
Burundi is a landlocked, resource-poor country with an underdeveloped manufacturing sector. The economy is predominantly agricultural; agriculture accounts for just over 30% of GDP and employs more than 90% of the population. Burundi's primary exports are coffee and tea, which account for 90% of foreign exchange earnings, though exports are a relatively small share of GDP. Burundi's export earnings - and its ability to pay for imports - rests primarily on weather conditions and international coffee and tea prices. An ethnic-based war that lasted for over a decade resulted in more than 200,000 deaths, forced more than 48,000 refugees into Tanzania, and displaced 140,000 others internally. Only one in two children go to school, and approximately one in 15 adults has HIV/AIDS. Food, medicine, and electricity remain in short supply. Less than 2% of the population has electricity in its homes. Burundi's GDP grew around 4% annually in 2006-13. Political stability and the end of the civil war have improved aid flows and economic activity has increased, but underlying weaknesses - a high poverty rate, poor education rates, a weak legal system, a poor transportation network, overburdened utilities, and low administrative capacity - risk undermining planned economic reforms. The purchasing power of most Burundians has decreased as wage increases have not kept up with inflation. Burundi will remain heavily dependent on aid from bilateral and multilateral donors - foreign aid represents 42% of Burundi's national income, the second highest rate in Sub-Saharan Africa. Burundi joined the East African Community in 2009. Government corruption is hindering the development of a healthy private sector as companies seek to navigate an environment with ever changing rules.
$5.75 billion (2013 est.)//$5.504 billion (2012 est.)//$5.291 billion (2011 est.)
4.5% (2013 est.)//4% (2012 est.)//4.2% (2011 est.)
$600 (2013 est.)//$600 (2012 est.)//$600 (2011 est.)
$2.676 billion (2013 est.)
Labour & EmploymentBack to top ↑
- Employment & Labour Force Participation
- Labour Market Institutions & Wage Setting
- Employment Services & Skills Matching
- Labour Adjustment, Transition & Formalisation
4.245 million (2007)
NA%
Industrial & Sectoral BaseBack to top ↑
- Manufacturing & Advanced Industry
- Foundational & Process Industries
- Agrifood & Primary Production
- Services Economy
coffee, cotton, tea, corn, sorghum, sweet potatoes, bananas, cassava (manioc, tapioca); beef, milk, hides
light consumer goods (blankets, shoes, soap, beer); assembly of imported components; public works construction; food processing
4.5% (2013 est.)
Structural Transformation & ComplexityBack to top ↑
Business Dynamism & EntrepreneurshipBack to top ↑
- Entrepreneurship & Firm Creation
- Risk Capital & Scale-Up Finance
- Firm Growth, Exit & Renewal
- Competition & Market Contestability
Innovation & CommercialisationBack to top ↑
- Business Innovation Capability
- Research Commercialisation & Knowledge Transfer
- Intellectual Property & Intangible Assets
- Innovation Ecosystems & Clusters
Technology Adoption & DiffusionBack to top ↑
GINC Capability Domains · Chapter 12
Trade and Investment
🇧🇮 Burundi’s markets, capital and the terms of global exchange
Overall tradeBack to top ↑
$68.2M of exports to 77 partners and $484M of imports from 74 in 2024, a deficit of $416M.
- Exports
- $68.2M77 partners
- Imports
- $484M74 partners
- Balance
- −$416Mdeficit
- Total trade
- $552M2024
ExportsBack to top ↑
Where its exports go
The largest partners in 2024, with each one's share of the nation's exports.
| Partner | Value | Share | |
|---|---|---|---|
| China | $22.9M | 34% | |
| Finland | $5.33M | 7.8% | |
| Belgium | $4.57M | 6.7% | |
| United States | $3.78M | 5.5% | |
| Sweden | $3.04M | 4.5% | |
| Germany | $3.01M | 4.4% | |
| France | $2.89M | 4.2% | |
| Malaysia | $2.61M | 3.8% | |
| Pakistan | $2.43M | 3.6% | |
| India | $2.21M | 3.2% | |
| Uganda | $1.95M | 2.9% | |
| Japan | $1.92M | 2.8% | |
| United Kingdom | $1.48M | 2.2% | |
| Zambia | $1.30M | 1.9% | |
| Tanzania | $997K | 1.5% | |
| Italy | $922K | 1.4% | |
| South Africa | $856K | 1.3% | |
| Australia | $751K | 1.1% | |
| Netherlands | $621K | 0.9% | |
| Canada | $565K | 0.8% |
What it exports
The largest categories in 2024.
| Category | Value | Share | |
|---|---|---|---|
| Coffee, tea, mate and spices | $37.8M | 55% | |
| Ores slag and ash | $20.6M | 30% | |
| Cereals | $1.20M | 1.8% | |
| Copper | $951K | 1.4% | |
| Machinery, nuclear reactors, boilers | $777K | 1.1% | |
| Raw hides and skins (other than furskins) and leather | $761K | 1.1% | |
| Optical, photo, technical, medical apparatus | $728K | 1.1% | |
| Essential oils, perfumes, cosmetics, toiletries | $599K | 0.9% | |
| Aluminum | $531K | 0.8% | |
| Iron and steel | $482K | 0.7% | |
| Articles of apparel, knit or crocheted | $467K | 0.7% | |
| Vehicles other than railway, tramway | $400K | 0.6% | |
| Manmade staple fibers | $295K | 0.4% | |
| Pulp of wood, fibrous cellulosic material, waste | $259K | 0.4% | |
| Lead | $215K | 0.3% |
ImportsBack to top ↑
Where its imports come from
The largest partners in 2024, with each one's share of the nation's imports.
| Partner | Value | Share | |
|---|---|---|---|
| China | $89.7M | 19% | |
| Uganda | $72.5M | 15% | |
| Tanzania | $61.5M | 13% | |
| Kenya | $56.2M | 12% | |
| Belgium | $35.9M | 7.4% | |
| India | $32.2M | 6.7% | |
| Zambia | $14.2M | 2.9% | |
| Germany | $14.1M | 2.9% | |
| Japan | $13.6M | 2.8% | |
| Egypt | $11.5M | 2.4% | |
| France | $10.6M | 2.2% | |
| Malta | $9.56M | 2.0% | |
| Italy | $8.22M | 1.7% | |
| Turkey | $7.34M | 1.5% | |
| United States | $6.49M | 1.3% | |
| Netherlands | $5.55M | 1.1% | |
| South Africa | $3.87M | 0.8% | |
| Poland | $3.56M | 0.7% | |
| Luxembourg | $3.09M | 0.6% | |
| Denmark | $2.50M | 0.5% |
What it imports
The largest categories in 2024.
| Category | Value | Share | |
|---|---|---|---|
| Machinery, nuclear reactors, boilers | $43.4M | 9.0% | |
| Pharmaceutical products | $38.2M | 7.9% | |
| Vehicles other than railway, tramway | $36.4M | 7.5% | |
| Electrical, electronic equipment | $26.8M | 5.5% | |
| Plastics | $26.8M | 5.5% | |
| Salt, sulphur, earth, stone, plaster, lime and cement | $23.4M | 4.8% | |
| Cereals | $20.8M | 4.3% | |
| Iron and steel | $19.8M | 4.1% | |
| Articles of iron or steel | $18.9M | 3.9% | |
| Sugars and sugar confectionery | $17.4M | 3.6% | |
| Optical, photo, technical, medical apparatus | $17.3M | 3.6% | |
| Printed books, newspapers, pictures | $14.3M | 3.0% | |
| Miscellaneous edible preparations | $12.9M | 2.7% | |
| Milling products, malt, starches, inulin, wheat gluten | $12.5M | 2.6% | |
| Fertilizers | $12.0M | 2.5% |
In a list, the bar runs to the largest in that list. The line is each figure’s history from 2000, drawn to its own peak: it shows the shape of the years, and the value shows the size.
External balanceBack to top ↑
-$492.5 million (2013 est.)//-$432.1 million (2012 est.)
Trade Facilitation & LogisticsBack to top ↑
Trade Policy & Market AccessBack to top ↑
- Trade Policy & Negotiation Capability
- Market Access & Agreements Network
- Trade Law & Enforcement
- Standards, Conformity & Quality Infrastructure
Digital & Services TradeBack to top ↑
- Services Trade Capability
- Digital Trade & E-Commerce
- Data Flows & Digital Trade Governance
- Tourism & Visitor Economy
Investment Attraction & ProjectionBack to top ↑
- Investment Attraction & Facilitation
- Investment Absorption & Linkages
- Outward Investment & Global Corporate Presence
Export Capability & SophisticationBack to top ↑
$122.8 million (2013 est.)//$134.7 million (2012 est.)
Switzerland 23.9%, UK 12.9%, Belgium 7.4%, Pakistan 7.4%, Democratic Republic of the Congo 7.4%, Uganda 5.6%, Germany 5.2%, China 4.9%, Egypt 4.7% (2012)
coffee, tea, sugar, cotton, hides
Global Value Chain PositionBack to top ↑
- Value Chain Participation & Integration
- Value Chain Position & Upgrading
- Regional Integration & Hub Anchoring
Economic Leverage & DependenceBack to top ↑
- Strategic Supply Security
- Concentration Risk & Revenue Stabilisation
- Economic Leverage & Coercion Resistance
$867.2 million (2013 est.)//$886.2 million (2012 est.)
Saudi Arabia 11.3%, Belgium 10.1%, China 9.1%, India 7.9%, Tanzania 6.5%, Kenya 6%, Uganda 5.7%, Zambia 4.6%, US 4.1% (2012)
capital goods, petroleum products, foodstuffs
Burundi · you are in
Historical Context
Foundations
GINC Capability Domains
Find in this brief · Burundi