
Denmark
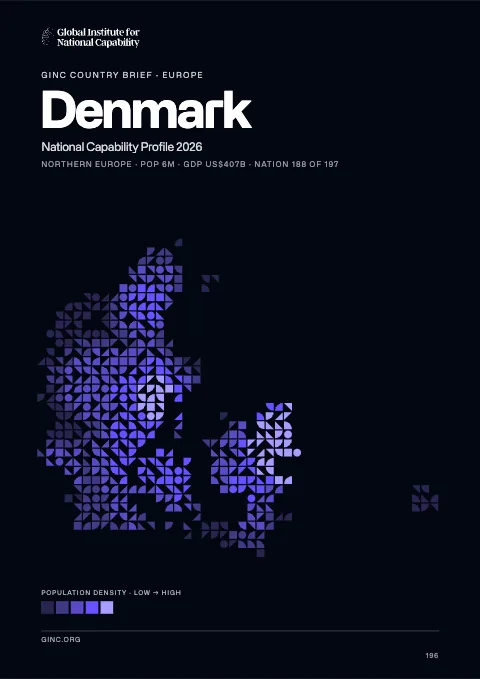
Denmark is a constitutional monarchy in Europe, home to 5.6 million people, with its capital at Copenhagen.
Contents
12 chapters
Foundations
01–03
At a glance
- Area
- 43.1Kkm²#133 World#28 Europe
- Population
- 5.6M#114 World#20 Europe
- GDP (market)
- $324B
- GDP (PPP)
- $211.3B#54 World#17 Europe
- GDP per capita
- $37.8K#33 World#17 Europe
The whole brief
Denmark National Capability Profile 2026
Foundations · Chapter 01
Historical Context
🇩🇰 Denmark’s understanding the origins and evolution of the modern nation
BackgroundBack to top ↑
Once the seat of Viking raiders and later a major north European power, Denmark has evolved into a modern, prosperous nation that is participating in the general political and economic integration of Europe. It joined NATO in 1949 and the EEC (now the EU) in 1973. However, the country has opted out of certain elements of the European Union's Maastricht Treaty, including the European Economic and Monetary Union (EMU), European defense cooperation, and issues concerning certain justice and home affairs.
IndependenceBack to top ↑
ca. 965 (unified and Christianized under HARALD I Gormson); 5 June 1849 (became a constitutional monarchy)
National holidayBack to top ↑
none designated; Constitution Day, 5 June (1849) is generally viewed as the National Day
Foundations · Chapter 02
Geography
🇩🇰 Denmark’s territory, resources and strategic position
Location and areaBack to top ↑
Northern Europe, bordering the Baltic Sea and the North Sea, on a peninsula north of Germany (Jutland); also includes several major islands (Sjaelland, Fyn, and Bornholm)
56 00 N, 10 00 E
Europe
slightly less than twice the size of Massachusetts
7,314 km
Terrain and resourcesBack to top ↑
low and flat to gently rolling plains
petroleum, natural gas, fish, salt, limestone, chalk, stone, gravel and sand
4,354 sq km (2007)
Settlement and hazardsBack to top ↑
flooding is a threat in some areas of the country (e.g., parts of Jutland, along the southern coast of the island of Lolland) that are protected from the sea by a system of dikes
controls Danish Straits (Skagerrak and Kattegat) linking Baltic and North Seas; about one-quarter of the population lives in greater Copenhagen
OtherBack to top ↑
6 cu km (2011)
air pollution, principally from vehicle and power plant emissions; nitrogen and phosphorus pollution of the North Sea; drinking and surface water becoming polluted from animal wastes and pesticides
Foundations · Chapter 03
Environment
🇩🇰 Denmark’s environmental conditions, resources and national resilience
ClimateBack to top ↑
temperate; humid and overcast; mild, windy winters and cool summers
Emissions and pollutionBack to top ↑
Water, waste and foodBack to top ↑
Resources and agreementsBack to top ↑
GINC Capability Domains · Chapter 04
Critical Technology
🇩🇰 Denmark’s technology frontiers and the pursuit of national advantage
Two counts are set side by side for 2015–2024: on the left, the papers researchers in Denmark published; on the right, the patent families that began there and were filed in more than one country. First by capability group, then group by group with each group’s capabilities. The badge on a card is the nation’s place among all nations. Papers are from GINC Research Analytics, patent families from GINC Patents.
Research by capability group
#35 WorldPapers published, 2015–2024
2,276
1,753
1,493
1,290
1,055
835
552
379
355
23
Patents by capability group
#18 WorldInternational patent families, 2015–2024
3,686
1,739
826
502
444
402
204
109
31
11
Advanced Materials & ManufacturingBack to top ↑
Research
#38 WorldPapers published, 2015–2024
Patents
#18 WorldInternational patent families, 2015–2024
Energy TechnologiesBack to top ↑
Research
#29 WorldPapers published, 2015–2024
Patents
#7 WorldInternational patent families, 2015–2024
Semiconductors & Advanced ComputingBack to top ↑
Research
#32 WorldPapers published, 2015–2024
No research topic: Semiconductor Design & EDA · Advanced Semiconductor Fabrication · Semiconductor Equipment & Materials · Advanced Packaging & Heterogeneous Integration
Patents
#26 WorldInternational patent families, 2015–2024
Artificial IntelligenceBack to top ↑
Research
#48 WorldPapers published, 2015–2024
Patents
#24 WorldInternational patent families, 2015–2024
Quantum TechnologiesBack to top ↑
Research
#21 WorldPapers published, 2015–2024
Patents
#22 WorldInternational patent families, 2015–2024
Connectivity, Cyber & Trust TechnologiesBack to top ↑
Research
#44 WorldPapers published, 2015–2024
Patents
#25 WorldInternational patent families, 2015–2024
Sensing, Timing & NavigationBack to top ↑
Research
#37 WorldPapers published, 2015–2024
Patents
#25 WorldInternational patent families, 2015–2024
Robotics & Autonomous SystemsBack to top ↑
Research
#36 WorldPapers published, 2015–2024
No research topic: Human-Machine Interfaces
Patents
#20 WorldInternational patent families, 2015–2024
Biotechnology & Health TechnologiesBack to top ↑
Research
#20 WorldPapers published, 2015–2024
Patents
#14 WorldInternational patent families, 2015–2024
Medicine and BioTech
Clinical research and life-science invention, drawn from the same series that drive the metric pages. Each card opens the full cross-country comparison.
Space TechnologiesBack to top ↑
Research
#36 WorldPapers published, 2015–2024
Patents
#27 WorldInternational patent families, 2015–2024
GINC Capability Domains · Chapter 05
Strategic Infrastructure
🇩🇰 Denmark’s energy, connectivity and the material foundations of capability
Resource InfrastructureBack to top ↑
207,400 bbl/day (2012 est.)
155,200 bbl/day (2010 est.)
55,010 bbl/day (2010 est.)
805 million bbl (1 January 2013 est.)
145,300 bbl/day (2010 est.)
160,200 bbl/day (2011 est.)
104,400 bbl/day (2010 est.)
124,100 bbl/day (2010 est.)
6.412 billion cu m (2012 est.)
4.994 billion cu m (2010 est.)
2.983 billion cu m (2012 est.)
254 million cu m (2012 est.)
42.98 billion cu m (1 January 2013 est.)
condensate 11 km; gas 4,377 km; oil 647 km; oil/gas/water 2 km (2013)
Agriculture & Food InfrastructureBack to top ↑
- Irrigation & Agricultural Water
- Livestock & Veterinary
- Fisheries & Aquaculture
- Storage, Cold Chain & Markets
Energy InfrastructureBack to top ↑
- Thermal Generation
- Nuclear Generation
- Nuclear Fuel Cycle & Radioactive Waste
- Hydropower
- Renewable Generation
- Transmission & Distribution
- System Control & Dispatch
- Storage & Fuel Supply
13.71 million kW (2010 est.)
33.71 billion kWh (2011 est.)
33.56 billion kWh (2010 est.)
10.71 billion kWh (2012 est.)
15.92 billion kWh (2012 est.)
63% of total installed capacity (2010 est.)
0% of total installed capacity (2010 est.)
0.1% of total installed capacity (2010 est.)
36.9% of total installed capacity (2010 est.)
46.66 million Mt (2011 est.)
Water, Sanitation & Waste InfrastructureBack to top ↑
- Dams, Reservoirs & Flood Defence
- Water Supply & Treatment
- Bulk Water Transfer & Desalination
- Wastewater & Sanitation
- Solid Waste & Recycling
Advanced ManufacturingBack to top ↑
- Materials & Inputs
- Chemicals & Hazardous Process Industry
- Production Systems
- Supply Chain & Ecosystem
- Workforce & Innovation
Transport InfrastructureBack to top ↑
- Seaports & Terminals
- Air Infrastructure
- Air Navigation & Traffic Management
- Inland Waterways & Ferries
- Rail Infrastructure
- Roads & Bridges
- Logistics, Multimodal & Border Infrastructure
- Postal & Parcel
80 (2013)
400 km (2010)
Communications & Digital InfrastructureBack to top ↑
- Subsea Cables & International Gateways
- Core & Backbone Networks
- Mobile & Wireless Networks
- Spectrum & Broadcasting
- Data Centres, Compute & Cloud
- Data Resources
- AI Tools & Applications
2.431 million (2012)
6.6 million (2012)
4.75 million (2009)
4.297 million (2012)
.dk
Financial InfrastructureBack to top ↑
- Currency & Reserves
- Payments & Settlement Systems
- Markets, Exchanges & Depositories
- Banks, Insurers & Systemic Institutions
Social InfrastructureBack to top ↑
- Health Infrastructure
- Public Health & Laboratories
- Medical Supply & Stockpiles
- Education & Skills Infrastructure
- Research & Scientific Facilities
- Housing, Community & Social Services
- Government & Public Administration
- Cultural, Community & Recreational Infrastructure
- Justice & Corrections
- Emergency Services & Civil Protection
- Hydrometeorology & Early Warning
Space, Aerospace & Defence InfrastructureBack to top ↑
GINC Capability Domains · Chapter 06
National Security
🇩🇰 Denmark’s force, intelligence and the defence of the nation
Disputes and terrorismBack to top ↑
Iceland, the UK, and Ireland dispute Denmark's claim that the Faroe Islands' continental shelf extends beyond 200 nm; Faroese continue to study proposals for full independence; sovereignty dispute with Canada over Hans Island in the Kennedy Channel between Ellesmere Island and Greenland; Denmark (Greenland) and Norway have made submissions to the Commission on the Limits of the Continental Shelf (CLCS) and Russia is collecting additional data to augment its 2001 CLCS submission
Force Generation & MobilisationBack to top ↑
Defense Command: Army Operational Command, Admiral Danish Fleet, Arctic Command, Tactical Air Command, Home Guard (2010)
18 years of age for compulsory and voluntary military service; conscripts serve an initial training period that varies from 4 to 12 months according to specialization; reservists are assigned to mobilization units following completion of their conscript service; women eligible to volunteer for military service (2012)
1.41% of GDP (2012)//1.35% of GDP (2011)//1.41% of GDP (2010)
Forces under arms
Active-duty strength on the Correlates of War series, which reaches back to 1816 and so carries a nation’s whole record of mobilisation rather than its present establishment. The card opens the full cross-country comparison.
Intelligence & AssessmentBack to top ↑
- Imagery & Geospatial Intelligence
- Signals & Cyber Intelligence
- Technical & Measurement Intelligence
- Open-Source & Financial Intelligence
- Human Intelligence & Counterintelligence
- All-Source Analysis & Warning
Joint Command, Projection & SustainmentBack to top ↑
- Command, Control & Communications
- Strategic Lift & Mobility
- Expeditionary & Peace Operations
- Operational Sustainment & War Reserves
- Defence Industrial Mobilisation
- CBRN Defence
Land PowerBack to top ↑
- Combined Arms Manoeuvre
- Land Fires
- Battlefield Aviation & Uncrewed Systems
- Special Operations & Irregular Warfare
Maritime PowerBack to top ↑
- Maritime Security & Constabulary
- Sea Denial & Undersea Warfare
- Sea Control
- Amphibious & Expeditionary Operations
Air PowerBack to top ↑
- Air Sovereignty & Policing
- Control of the Air
- Air Strike & Interdiction
- Airborne ISR, Early Warning & Battle Management
Strategic Strike & Missile DefenceBack to top ↑
Space OperationsBack to top ↑
Cyber & Electromagnetic OperationsBack to top ↑
Nuclear DeterrenceBack to top ↑
GINC Capability Domains · Chapter 07
Human Capital
🇩🇰 Denmark’s population, health and the skills that sustain capability
DemographyBack to top ↑
5,569,077 (July 2014 est.)
0.22% (2014 est.)
10.22 births/1,000 population (2014 est.)
10.23 deaths/1,000 population (2014 est.)
1.73 children born/woman (2014 est.)
29.1 (2012 est.)
Migration and urbanisationBack to top ↑
2.25 migrant(s)/1,000 population (2014 est.)
COPENHAGEN (capital) 1.206 million (2011)
Welfare and equityBack to top ↑
13.4% (2011)
24.8 (2011 est.)//24.7 (1992)
Early Childhood DevelopmentBack to top ↑
Foundational EducationBack to top ↑
8.7% of GDP (2009)
Advanced EducationBack to top ↑
Technical & Vocational SkillsBack to top ↑
Digital & AI CompetenceBack to top ↑
Generative AI adoption
Modelled share of working-age adults using generative AI, from Microsoft telemetry scaled to each country’s 15–64 population. A measure of how fast a workforce is absorbing the technology rather than of how much of it a nation builds. The card opens the full cross-country comparison.
Lifelong Learning & ReskillingBack to top ↑
Research Talent & Knowledge CreationBack to top ↑
Population HealthBack to top ↑
12 deaths/100,000 live births (2010)
18.2% (2008)
0.2% (2009 est.)
5,300 (2009 est.)
fewer than 100 (2009 est.)
Health System CapabilityBack to top ↑
11.2% of GDP (2011)
3.42 physicians/1,000 population (2007)
3.5 beds/1,000 population (2010)
GINC Capability Domains · Chapter 08
Governance and Integrity
🇩🇰 Denmark’s institutions, law and the integrity of the state
State structureBack to top ↑
constitutional monarchy
metropolitan Denmark - 5 regions (regioner, singular - region); Hovedstaden (Capital), Midtjylland (Central Jutland), Nordjylland (North Jutland), Sjaelland (Zealand), Syddanmark (Southern Denmark)
previous 1665; latest adopted 5 June 1849; amended several times, last in 2009 (2009)
18 years of age; universal
Political Institutions & Civic ParticipationBack to top ↑
- Electoral Management & Integrity
- Legislature & Deliberative Institutions
- Citizen Participation & Civic Space
unicameral People's Assembly or Folketing (179 seats, including 2 from Greenland and 2 from the Faroe Islands; members elected by popular vote on the basis of proportional representation to serve four-year terms unless the Folketing is dissolved earlier)
Conservative People's Party or C [Lars BARFOED]//Danish People's Party or DF [Kristian THULESEN DAHL]//Liberal Alliance or LA [Anders SAMUELSEN]//Liberal Party or V [Lars LOKKE RAMUSSEN]//Red-Green Alliance (Unity List) or O [collective leadership, spokesperson Johanne SCHMIDT-NIELSEN]//Social Democratic Party or SDP [Helle THORNING-SCHMIDT]//Social Liberal Party or SLP [Margrethe VESTAGER]//Socialist People's Party or SF [Annette VILHELMSEN]
Confederation of Danish Employers or DA [President Jorn Neergaard LARSEN]//Confederation of Danish Industries [CEO Karsten DYBVAD]//Confederation of Danish Labor Unions (Landsorganisationen) or LO [President Harald BORSTING]//Danish Shipowners' Association [Chairman Carsten MORTENSEN]; Danish Bankers Association [CEO Joergen HORWITZ]//DaneAge Association [President Bjarne HASTRUP]//Danish Society for Nature Conservation [President Ella Maria BISSCHOP-LARSEN]
Justice System & Fundamental RightsBack to top ↑
- Judicial Independence & Court Capability
- Access to Justice & Legal Services
- Fundamental Rights Protection
- Human Rights Institutions & Equality Bodies
civil law; judicial review of legislative acts
accepts compulsory ICJ jurisdiction with reservations; accepts ICCt jurisdiction
Internal Security & OrderBack to top ↑
Regulatory Governance & Strategic ControlsBack to top ↑
- Regulatory Quality & Better Regulation
- Regulatory Delivery & Independent Regulators
- Strategic Controls & Economic Security Administration
Government Effectiveness & Public AdministrationBack to top ↑
- Centre of Government & Policy Coordination
- Civil Service & Public Workforce
- Digital Government & Service Delivery
- Legal Identity & Civil Registration
- Statistical & Data Capability
Public Integrity & Anti-CorruptionBack to top ↑
Transparency, Oversight & AccountabilityBack to top ↑
- Right to Information & Open Government
- Independent Oversight & Supreme Audit
- Independent Media & Journalist Safety
National Resilience & Crisis ManagementBack to top ↑
GINC Capability Domains · Chapter 09
Information and Influence
🇩🇰 Denmark’s identity, media and the projection of influence
Identity and cultureBack to top ↑
Danish, Faroese, Greenlandic (an Inuit dialect), German (small minority)
Evangelical Lutheran (official) 80%, Muslim 4%, other (denominations of less than 1% each, includes Roman Catholic, Jehovah's Witness, Serbian Orthodox Christian, Jewish, Baptist, and Buddhist) 16% (2012 est.)
Scandinavian, Inuit, Faroese, German, Turkish, Iranian, Somali
lion; mute swan
red with a white cross that extends to the edges of the flag; the vertical part of the cross is shifted to the hoist side; the banner is referred to as the Dannebrog (Danish flag) and is one of the oldest national flags in the world; traditions as to the origin of the flag design vary, but the best known is a legend that the banner fell from the sky during an early-13th century battle; caught up by the Danish king before it ever touched the earth, this heavenly talisman inspired the royal army to victory; in actuality, the flag may derive from a crusade banner or ensign
Diplomatic Statecraft & Global NetworksBack to top ↑
- Diplomatic Network & Consular Reach
- Multilateral Leadership & Norm Setting
- Agenda-Setting & Convening
- Mediation & Crisis Diplomacy
ADB (nonregional member), AfDB (nonregional member), Arctic Council, Australia Group, BIS, CBSS, CD, CE, CERN, EAPC, EBRD, EIB, EITI (implementing country), ESA, EU, FAO, FATF, G-9, IADB, IAEA, IBRD, ICAO, ICC (national committees), ICRM, IDA, IEA, IFAD, IFC, IFRCS, IGAD (partners), IHO, ILO, IMF, IMO, IMSO, Interpol, IOC, IOM, IPU, ISO, ITSO, ITU, ITUC (NGOs), MIGA, MINUSMA, NATO, NC, NEA, NIB, NSG, OAS (observer), OECD, OPCW, OSCE, Paris Club, PCA, Schengen Convention, UN, UNCTAD, UNESCO, UNHCR, UNIDO, UNMIL, UNMISS, UNRWA, UNTSO, UPU, WCO, WHO, WIPO, WMO, WTO, ZC
Alliances & Security CooperationBack to top ↑
Development Cooperation & Global AssistanceBack to top ↑
Culture, Language & Education DiplomacyBack to top ↑
- Cultural & Language Institutes
- Creative Industries & Cultural Export Reach
- Heritage & Cultural Institutions
- Education Diplomacy & Alumni Networks
- Sports & Major Events
Diaspora & Global CommunitiesBack to top ↑
Information Environment & Strategic CommunicationBack to top ↑
- Strategic Communications & Public Diplomacy
- International Media & Broadcasting
- Information Defence & Counter-Interference
strong public-sector TV presence with state-owned Danmarks Radio (DR) operating 4 channels and publicly owned TV2 operating roughly a half dozen channels; broadcasts of privately owned stations are available via satellite and cable feed; DR operates 4 nationwide FM radio stations, 15 digital audio broadcasting stations, and about 15 web-based radio stations; approximately 250 commercial and community radio stations (2007)
GINC Capability Domains · Chapter 10
Financial Strength
🇩🇰 Denmark’s fiscal depth, reserves and the capacity to act
Monetary & Currency CapabilityBack to top ↑
- Monetary Policy & Price Stability
- Exchange Rate & External Account Management
- Currency Issuance & Digital Money
0.8% (2013 est.)//2.4% (2012 est.)
Danish kroner (DKK) per US dollar -//5.695 (2013 est.)//5.7925 (2012 est.)//5.6241 (2010 est.)//5.361 (2009)//5.0236 (2008)
0.75% (31 December 2011 est.)//0.75% (31 December 2010 est.)
3.6% (31 December 2013 est.)//3.6% (31 December 2012 est.)
$147.6 billion (31 December 2013 est.)//$150.4 billion (31 December 2012 est.)
$180.2 billion (31 December 2013 est.)//$174.3 billion (31 December 2012 est.)
Fiscal Capacity & Public FinanceBack to top ↑
- Revenue Mobilisation & Tax Administration
- Public Expenditure & Budget Management
- Sovereign Debt & Treasury Management
- Public Investment Management
55.9% of GDP (2013 est.)
-2.5% of GDP (2013 est.)
47% of GDP (2013 est.)//45.6% of GDP (2012 est.)
calendar year
Financial System Depth & AccessBack to top ↑
- Banking System Capacity
- Capital Markets Depth & Development
- Long-Term & Institutional Capital
- Financial Inclusion & Household Access
- Development & Policy Finance
$675 billion (31 December 2013 est.)//$664.5 billion (31 December 2012 est.)
$NA (31 December 2012 est.)//$179.5 billion (31 December 2011)//$231.7 billion (31 December 2010 est.)
24.1% of GDP (2013 est.)//22.6% of GDP (2012 est.)//23.3% of GDP (2011 est.)
Financial Regulation & IntegrityBack to top ↑
- Prudential Regulation & Supervision
- Financial Integrity & Illicit Finance Control
- Market Conduct & Consumer Protection
- Payment & Market Infrastructure Oversight
Financial Stability & Crisis ManagementBack to top ↑
- Macroprudential & Systemic Oversight
- Crisis Management, Resolution & Deposit Insurance
- External Liquidity & Financial Safety Nets
Sovereign Capital & External Financial PowerBack to top ↑
- Official Reserves Management
- Sovereign Wealth & Public Asset Management
- Currency Internationalisation & Reserve Status
- Capital Account & Flow Management
- International Financial Centre Capability
$89.5 billion (31 December 2013 est.)//$89.7 billion (31 December 2012 est.)
$586.7 billion (31 December 2012 est.)//$571.4 billion (31 December 2011)
GINC Capability Domains · Chapter 11
Production and Innovation
🇩🇰 Denmark’s output, industry and the engine of prosperity
Economic Output & ProductivityBack to top ↑
This thoroughly modern market economy features a high-tech agricultural sector, state-of-the-art industry with world-leading firms in pharmaceuticals, maritime shipping and renewable energy, and a high dependence on foreign trade. Denmark is a member of the European Union (EU); Danish legislation and regulations conform to EU standards on almost all issues. Danes enjoy a high standard of living and the Danish economy is characterized by extensive government welfare measures and an equitable distribution of income. Denmark is a net exporter of food and energy and enjoys a comfortable balance of payments surplus, but depends on imports of raw materials for the manufacturing sector. Within the EU, Denmark is among the strongest supporters of trade liberalization. After a long consumption-driven upswing, Denmark's economy began slowing in 2007 with the end of a housing boom. Housing prices dropped markedly in 2008-09 and, following a short respite in 2010, have since continued to decline. Household indebtedness is still relatively high at more than 275% of gross disposable income in the first half of 2013. The global financial crisis has exacerbated this cyclical slowdown through increased borrowing costs and lower export demand, consumer confidence, and investment. Denmark made a modest recovery in 2010, in part because of increased government spending; however, the country experienced a technical recession in late 2010-early 2011. Historically low levels of unemployment rose sharply with the recession and have remained at about 6% in 2010-13, based on the national measure, about two-thirds average EU unemployment. An impending decline in the ratio of workers to retirees will be a major long-term issue. Denmark maintained a healthy budget surplus for many years up to 2008, but the budget balance swung into deficit in 2009, where it remains. In spite of the deficits, the new coalition government delivered a modest stimulus to the economy in 2012. Nonetheless, Denmark's fiscal position remains among the strongest in the EU with public debt at about 46% of GDP in 2013. Despite previously meeting the criteria to join the European Economic and Monetary Union (EMU), so far Denmark has decided not to join, although the Danish krone remains pegged to the euro.
$211.3 billion (2013 est.)//$211.1 billion (2012 est.)//$211.9 billion (2011 est.)
0.1% (2013 est.)//-0.4% (2012 est.)//1.1% (2011 est.)
$37,800 (2013 est.)//$37,800 (2012 est.)//$38,100 (2011 est.)
$324.3 billion (2013 est.)
Labour & EmploymentBack to top ↑
- Employment & Labour Force Participation
- Labour Market Institutions & Wage Setting
- Employment Services & Skills Matching
- Labour Adjustment, Transition & Formalisation
2.795 million (2013 est.)
6% (2013 est.)//6% (2012 est.)
Industrial & Sectoral BaseBack to top ↑
- Manufacturing & Advanced Industry
- Foundational & Process Industries
- Agrifood & Primary Production
- Services Economy
barley, wheat, potatoes, sugar beets; pork, dairy products; fish
iron, steel, nonferrous metals, chemicals, food processing, machinery and transportation equipment, textiles and clothing, electronics, construction, furniture and other wood products, shipbuilding and refurbishment, windmills, pharmaceuticals, medical equipment
1.1% (2013 est.)
Structural Transformation & ComplexityBack to top ↑
Business Dynamism & EntrepreneurshipBack to top ↑
- Entrepreneurship & Firm Creation
- Risk Capital & Scale-Up Finance
- Firm Growth, Exit & Renewal
- Competition & Market Contestability
Innovation & CommercialisationBack to top ↑
- Business Innovation Capability
- Research Commercialisation & Knowledge Transfer
- Intellectual Property & Intangible Assets
- Innovation Ecosystems & Clusters
Technology Adoption & DiffusionBack to top ↑
GINC Capability Domains · Chapter 12
Trade and Investment
🇩🇰 Denmark’s markets, capital and the terms of global exchange
Overall tradeBack to top ↑
$114B of exports to 220 partners and $123B of imports from 218 in 2024, a deficit of $8.78B.
- Exports
- $114B220 partners
- Imports
- $123B218 partners
- Balance
- −$8.78Bdeficit
- Total trade
- $238B2024
ExportsBack to top ↑
Where its exports go
The largest partners in 2024, with each one's share of the nation's exports.
| Partner | Value | Share | |
|---|---|---|---|
| Germany | $15.1B | 13% | |
| Sweden | $11.4B | 9.9% | |
| United States | $9.37B | 8.2% | |
| Netherlands | $6.71B | 5.9% | |
| United Kingdom | $6.11B | 5.3% | |
| China | $5.73B | 5.0% | |
| Poland | $4.65B | 4.1% | |
| Norway | $4.53B | 4.0% | |
| France | $4.19B | 3.7% | |
| Italy | $3.55B | 3.1% | |
| Spain | $2.65B | 2.3% | |
| Japan | $2.20B | 1.9% | |
| Belgium | $2.04B | 1.8% | |
| Finland | $2.00B | 1.7% | |
| Switzerland | $1.96B | 1.7% | |
| Brazil | $1.78B | 1.6% | |
| Czech Republic | $1.51B | 1.3% | |
| Canada | $1.51B | 1.3% | |
| Australia | $1.35B | 1.2% | |
| Turkey | $1.29B | 1.1% |
What it exports
The largest categories in 2024.
| Category | Value | Share | |
|---|---|---|---|
| Pharmaceutical products | $18.8B | 16% | |
| Machinery, nuclear reactors, boilers | $14.0B | 12% | |
| Electrical, electronic equipment | $7.98B | 7.0% | |
| Mineral fuels, oils, distillation products | $6.38B | 5.6% | |
| Optical, photo, technical, medical apparatus | $5.17B | 4.5% | |
| Meat and edible meat offal | $4.24B | 3.7% | |
| Fish, crustaceans, molluscs, aquatics invertebrates | $3.96B | 3.5% | |
| Vehicles other than railway, tramway | $3.90B | 3.4% | |
| Dairy products, eggs, honey, edible products | $3.65B | 3.2% | |
| Plastics | $3.23B | 2.8% | |
| Albuminoids, modified starches, glues, enzymes | $2.76B | 2.4% | |
| Furniture, lighting signs, prefabricated buildings | $2.46B | 2.2% | |
| Articles of iron or steel | $2.30B | 2.0% | |
| Organic chemicals | $2.26B | 2.0% | |
| Live animals | $2.00B | 1.7% |
ImportsBack to top ↑
Where its imports come from
The largest partners in 2024, with each one's share of the nation's imports.
| Partner | Value | Share | |
|---|---|---|---|
| Germany | $23.7B | 19% | |
| Sweden | $14.0B | 11% | |
| Netherlands | $11.0B | 9.0% | |
| China | $10.2B | 8.3% | |
| United States | $6.55B | 5.3% | |
| Norway | $6.08B | 4.9% | |
| Poland | $5.99B | 4.9% | |
| Italy | $4.25B | 3.4% | |
| France | $4.24B | 3.4% | |
| Belgium | $4.02B | 3.3% | |
| United Kingdom | $2.58B | 2.1% | |
| Spain | $2.49B | 2.0% | |
| South Korea | $2.40B | 1.9% | |
| Czech Republic | $2.32B | 1.9% | |
| Finland | $1.43B | 1.2% | |
| Turkey | $1.34B | 1.1% | |
| Bangladesh | $1.15B | 0.9% | |
| India | $1.11B | 0.9% | |
| Austria | $1.07B | 0.9% | |
| Lithuania | $994M | 0.8% |
What it imports
The largest categories in 2024.
| Category | Value | Share | |
|---|---|---|---|
| Machinery, nuclear reactors, boilers | $13.8B | 11% | |
| Electrical, electronic equipment | $11.9B | 9.7% | |
| Vehicles other than railway, tramway | $11.9B | 9.6% | |
| Mineral fuels, oils, distillation products | $8.79B | 7.1% | |
| Pharmaceutical products | $6.83B | 5.5% | |
| Plastics | $4.90B | 4.0% | |
| Optical, photo, technical, medical apparatus | $3.84B | 3.1% | |
| Articles of iron or steel | $3.39B | 2.8% | |
| Ships, boats, and other floating structures | $3.33B | 2.7% | |
| Articles of apparel, not knit or crocheted | $3.03B | 2.5% | |
| Furniture, lighting signs, prefabricated buildings | $2.92B | 2.4% | |
| Articles of apparel, knit or crocheted | $2.73B | 2.2% | |
| Fish, crustaceans, molluscs, aquatics invertebrates | $2.68B | 2.2% | |
| Iron and steel | $2.68B | 2.2% | |
| Wood and articles of wood, wood charcoal | $2.35B | 1.9% |
In a list, the bar runs to the largest in that list. The line is each figure’s history from 2000, drawn to its own peak: it shows the shape of the years, and the value shows the size.
External balanceBack to top ↑
$19.6 billion (2013 est.)//$17.44 billion (2012 est.)
Trade Facilitation & LogisticsBack to top ↑
Trade Policy & Market AccessBack to top ↑
- Trade Policy & Negotiation Capability
- Market Access & Agreements Network
- Trade Law & Enforcement
- Standards, Conformity & Quality Infrastructure
Digital & Services TradeBack to top ↑
- Services Trade Capability
- Digital Trade & E-Commerce
- Data Flows & Digital Trade Governance
- Tourism & Visitor Economy
Investment Attraction & ProjectionBack to top ↑
- Investment Attraction & Facilitation
- Investment Absorption & Linkages
- Outward Investment & Global Corporate Presence
$146 billion (31 December 2013 est.)//$147.1 billion (31 December 2012 est.)
$248.3 billion (31 December 2013 est.)//$241.7 billion (31 December 2012 est.)
Export Capability & SophisticationBack to top ↑
$106 billion (2013 est.)//$104.9 billion (2012 est.)
Germany 15.9%, Sweden 13.5%, UK 9.6%, US 6.6%, Norway 6.3%, Netherlands 4.6% (2012)
machinery and instruments, meat and meat products, dairy products, fish, pharmaceuticals, furniture, windmills
Global Value Chain PositionBack to top ↑
- Value Chain Participation & Integration
- Value Chain Position & Upgrading
- Regional Integration & Hub Anchoring
Economic Leverage & DependenceBack to top ↑
- Strategic Supply Security
- Concentration Risk & Revenue Stabilisation
- Economic Leverage & Coercion Resistance
$98.45 billion (2013 est.)//$96.77 billion (2012 est.)
Germany 21.2%, Sweden 13.5%, Netherlands 7.5%, China 6.4%, Norway 6.3%, UK 5.6% (2012)
machinery and equipment, raw materials and semimanufactures for industry, chemicals, grain and foodstuffs, consumer goods
Denmark · you are in
Historical Context
Foundations
GINC Capability Domains
Find in this brief · Denmark