
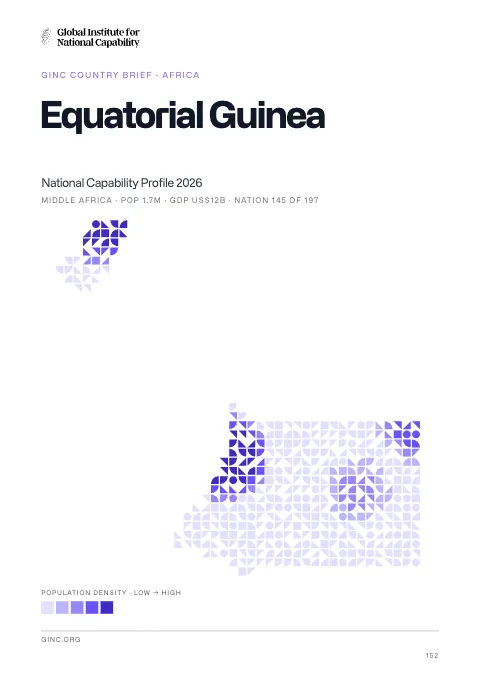
Equatorial Guinea
Equatorial Guinea is a republic in Africa, home to 722,000 people, with its capital at Malabo.
Contents
12 chapters
Foundations
01–03
At a glance
- Area
- 28.1Kkm²#145 World#45 Africa
- Population
- 722.3K#166 World#51 Africa
- GDP (market)
- $17.1B
- GDP (PPP)
- $19.7B#135 World#28 Africa
- GDP per capita
- $25.7K#57 World#2 Africa
The whole brief
Equatorial Guinea National Capability Profile 2026
Foundations · Chapter 01
Historical Context
🇬🇶 Equatorial Guinea’s understanding the origins and evolution of the modern nation
BackgroundBack to top ↑
Equatorial Guinea gained independence in 1968 after 190 years of Spanish rule. This tiny country, composed of a mainland portion plus five inhabited islands, is one of the smallest on the African continent. President Teodoro Obiang NGUEMA MBASOGO has ruled the country since 1979 when he seized power in a coup. Although nominally a constitutional democracy since 1991, the 1996, 2002, and 2009 presidential elections - as well as the 1999, 2004, 2008, and 2013 legislative elections - were widely seen as flawed. The president exerts almost total control over the political system and has discouraged political opposition. Equatorial Guinea has experienced rapid economic growth due to the discovery of large offshore oil reserves, and in the last decade has become Sub-Saharan Africa's third largest oil exporter. Despite the country's economic windfall from oil production, resulting in a massive increase in government revenue in recent years, improvements in the population's living standards have been slow to develop.
IndependenceBack to top ↑
12 October 1968 (from Spain)
National holidayBack to top ↑
Independence Day, 12 October (1968)
Foundations · Chapter 02
Geography
🇬🇶 Equatorial Guinea’s territory, resources and strategic position
Location and areaBack to top ↑
Central Africa, bordering the Bight of Biafra, between Cameroon and Gabon
2 00 N, 10 00 E
Africa
slightly smaller than Maryland
296 km
Terrain and resourcesBack to top ↑
coastal plains rise to interior hills; islands are volcanic
petroleum, natural gas, timber, gold, bauxite, diamonds, tantalum, sand and gravel, clay
NA
Settlement and hazardsBack to top ↑
violent windstorms; flash floods
insular and continental regions widely separated
OtherBack to top ↑
26 cu km (2011)
tap water is not potable; deforestation
Foundations · Chapter 03
Environment
🇬🇶 Equatorial Guinea’s environmental conditions, resources and national resilience
ClimateBack to top ↑
tropical; always hot, humid
Emissions and pollutionBack to top ↑
Water, waste and foodBack to top ↑
Resources and agreementsBack to top ↑
GINC Capability Domains · Chapter 04
Critical Technology
🇬🇶 Equatorial Guinea’s technology frontiers and the pursuit of national advantage
Advanced Materials & ManufacturingBack to top ↑
- Structural & Composite Materials
- Functional Materials & Coatings
- Nanomaterials & Metamaterials
- Superconducting, Magnetic & Photonic Materials
- Energetic Materials
- Additive & Precision Manufacturing
- Advanced Chemical & Process Manufacturing
Energy TechnologiesBack to top ↑
- Batteries & Energy Storage
- Hydrogen, Ammonia & Sustainable Fuels
- Next-Generation Solar & Renewables
- Advanced Nuclear & Fusion
- Directed Energy Technologies
Semiconductors & Advanced ComputingBack to top ↑
- Semiconductor Design & EDA
- Advanced Semiconductor Fabrication
- Semiconductor Equipment & Materials
- Advanced Packaging & Heterogeneous Integration
- Compound & Power Semiconductors
- High-Performance & AI Computing
Artificial IntelligenceBack to top ↑
Quantum TechnologiesBack to top ↑
Connectivity, Cyber & Trust TechnologiesBack to top ↑
- Advanced Optical Communication & Photonics
- Advanced Wireless Communication
- Resilient & Infrastructure-Independent Networks
- Protective Cybersecurity Technologies
- Privacy, Identity & Trust Technologies
Sensing, Timing & NavigationBack to top ↑
- Precision Timing & Atomic Clocks
- Resilient Positioning & Navigation
- Advanced Imaging & Photonic Sensing
- Radar & Radiofrequency Sensing
- Acoustic & Undersea Sensing
Robotics & Autonomous SystemsBack to top ↑
- Advanced Robotics
- Autonomous Systems & Trusted Autonomy
- Uncrewed & Collaborative Systems
- Human-Machine Interfaces
Biotechnology & Health TechnologiesBack to top ↑
- Genomics & Biological Data
- Synthetic Biology & Genetic Engineering
- Biomanufacturing
- Nuclear Medicine & Radioisotope Technologies
- Advanced Therapeutics, Vaccines & Medical Countermeasures
Medicine and BioTech
Clinical research and life-science invention, drawn from the same series that drive the metric pages. Each card opens the full cross-country comparison.
Space TechnologiesBack to top ↑
- Space Launch & Reusable Systems
- Advanced Propulsion & Hypersonic Systems
- Satellite & Constellation Technologies
GINC Capability Domains · Chapter 05
Strategic Infrastructure
🇬🇶 Equatorial Guinea’s energy, connectivity and the material foundations of capability
Resource InfrastructureBack to top ↑
318,000 bbl/day (2012 est.)
319,100 bbl/day (2010 est.)
0 bbl/day (2010 est.)
1.1 billion bbl (1 January 2013 est.)
3,074 bbl/day (2010 est.)
1,588 bbl/day (2011 est.)
2,320 bbl/day (2010 est.)
4,561 bbl/day (2010 est.)
6.88 billion cu m (2011 est.)
1.58 billion cu m (2010 est.)
5.26 billion cu m (2011 est.)
0 cu m (2011 est.)
36.81 billion cu m (1 January 2013 est.)
condensate 42 km; condensate/gas 5 km; gas 79 km; oil 71 km (2013)
Agriculture & Food InfrastructureBack to top ↑
- Irrigation & Agricultural Water
- Livestock & Veterinary
- Fisheries & Aquaculture
- Storage, Cold Chain & Markets
Energy InfrastructureBack to top ↑
- Thermal Generation
- Nuclear Generation
- Nuclear Fuel Cycle & Radioactive Waste
- Hydropower
- Renewable Generation
- Transmission & Distribution
- System Control & Dispatch
- Storage & Fuel Supply
38,000 kW (2010 est.)
97 million kWh (2010 est.)
90.21 million kWh (2010 est.)
0 kWh (2012 est.)
0 kWh (2012 est.)
97.4% of total installed capacity (2010 est.)
0% of total installed capacity (2010 est.)
2.6% of total installed capacity (2010 est.)
0% of total installed capacity (2010 est.)
5.232 million Mt (2011 est.)
Water, Sanitation & Waste InfrastructureBack to top ↑
- Dams, Reservoirs & Flood Defence
- Water Supply & Treatment
- Bulk Water Transfer & Desalination
- Wastewater & Sanitation
- Solid Waste & Recycling
Advanced ManufacturingBack to top ↑
- Materials & Inputs
- Chemicals & Hazardous Process Industry
- Production Systems
- Supply Chain & Ecosystem
- Workforce & Innovation
Transport InfrastructureBack to top ↑
- Seaports & Terminals
- Air Infrastructure
- Air Navigation & Traffic Management
- Inland Waterways & Ferries
- Rail Infrastructure
- Roads & Bridges
- Logistics, Multimodal & Border Infrastructure
- Postal & Parcel
7 (2013)
Communications & Digital InfrastructureBack to top ↑
- Subsea Cables & International Gateways
- Core & Backbone Networks
- Mobile & Wireless Networks
- Spectrum & Broadcasting
- Data Centres, Compute & Cloud
- Data Resources
- AI Tools & Applications
14,900 (2012)
501,000 (2012)
14,400 (2009)
7 (2012)
.gq
Financial InfrastructureBack to top ↑
- Currency & Reserves
- Payments & Settlement Systems
- Markets, Exchanges & Depositories
- Banks, Insurers & Systemic Institutions
Social InfrastructureBack to top ↑
- Health Infrastructure
- Public Health & Laboratories
- Medical Supply & Stockpiles
- Education & Skills Infrastructure
- Research & Scientific Facilities
- Housing, Community & Social Services
- Government & Public Administration
- Cultural, Community & Recreational Infrastructure
- Justice & Corrections
- Emergency Services & Civil Protection
- Hydrometeorology & Early Warning
Space, Aerospace & Defence InfrastructureBack to top ↑
GINC Capability Domains · Chapter 06
National Security
🇬🇶 Equatorial Guinea’s force, intelligence and the defence of the nation
Disputes and terrorismBack to top ↑
in 2002, ICJ ruled on an equidistance settlement of Cameroon-Equatorial Guinea-Nigeria maritime boundary in the Gulf of Guinea, but a dispute between Equatorial Guinea and Cameroon over an island at the mouth of the Ntem River and imprecisely defined maritime coordinates in the ICJ decision delayed final delimitation; UN urged Equatorial Guinea and Gabon to resolve the sovereignty dispute over Gabon-occupied Mbane and lesser islands and to create a maritime boundary in the hydrocarbon-rich Corisco Bay
Force Generation & MobilisationBack to top ↑
Equatorial Guinea Armed Forces (FAGE): Equatorial Guinea National Guard (Guardia Nacional de Guinea Ecuatorial, GNGE (Army); Navy; Air Force (2013)
18 years of age for selective compulsory military service, although conscription is rare in practice; 2-year service obligation; women hold only administrative positions in the Navy (2013)
Forces under arms
Active-duty strength on the Correlates of War series, which reaches back to 1816 and so carries a nation’s whole record of mobilisation rather than its present establishment. The card opens the full cross-country comparison.
Intelligence & AssessmentBack to top ↑
- Imagery & Geospatial Intelligence
- Signals & Cyber Intelligence
- Technical & Measurement Intelligence
- Open-Source & Financial Intelligence
- Human Intelligence & Counterintelligence
- All-Source Analysis & Warning
Joint Command, Projection & SustainmentBack to top ↑
- Command, Control & Communications
- Strategic Lift & Mobility
- Expeditionary & Peace Operations
- Operational Sustainment & War Reserves
- Defence Industrial Mobilisation
- CBRN Defence
Land PowerBack to top ↑
- Combined Arms Manoeuvre
- Land Fires
- Battlefield Aviation & Uncrewed Systems
- Special Operations & Irregular Warfare
Maritime PowerBack to top ↑
- Maritime Security & Constabulary
- Sea Denial & Undersea Warfare
- Sea Control
- Amphibious & Expeditionary Operations
Air PowerBack to top ↑
- Air Sovereignty & Policing
- Control of the Air
- Air Strike & Interdiction
- Airborne ISR, Early Warning & Battle Management
Strategic Strike & Missile DefenceBack to top ↑
Space OperationsBack to top ↑
Cyber & Electromagnetic OperationsBack to top ↑
Nuclear DeterrenceBack to top ↑
GINC Capability Domains · Chapter 07
Human Capital
🇬🇶 Equatorial Guinea’s population, health and the skills that sustain capability
DemographyBack to top ↑
722,254 (July 2014 est.)
2.54% (2014 est.)
33.83 births/1,000 population (2014 est.)
8.39 deaths/1,000 population (2014 est.)
4.66 children born/woman (2014 est.)
10.1% (2000)
Migration and urbanisationBack to top ↑
0 migrant(s)/1,000 population (2014 est.)
MALABO (capital) 137,000 (2011)
Welfare and equityBack to top ↑
NA%
Early Childhood DevelopmentBack to top ↑
10.6% (2004)
Foundational EducationBack to top ↑
0.6% of GDP (2002)
Advanced EducationBack to top ↑
Technical & Vocational SkillsBack to top ↑
Digital & AI CompetenceBack to top ↑
Lifelong Learning & ReskillingBack to top ↑
Research Talent & Knowledge CreationBack to top ↑
Population HealthBack to top ↑
240 deaths/100,000 live births (2010)
10.6% (2008)
6.2% (2012 est.)
31,400 (2012 est.)
1,400 (2012 est.)
Health System CapabilityBack to top ↑
4% of GDP (2011)
0.3 physicians/1,000 population (2004)
2.1 beds/1,000 population (2010)
GINC Capability Domains · Chapter 08
Governance and Integrity
🇬🇶 Equatorial Guinea’s institutions, law and the integrity of the state
State structureBack to top ↑
republic
7 provinces (provincias, singular - provincia); Annobon, Bioko Norte, Bioko Sur, Centro Sur, Kie-Ntem, Litoral, Wele-Nzas
approved by referendum 17 November 1991; amended several times, last in 2012 (2012)
18 years of age; universal
Political Institutions & Civic ParticipationBack to top ↑
- Electoral Management & Integrity
- Legislature & Deliberative Institutions
- Citizen Participation & Civic Space
bicameral Parliament consists of the Senate (70 seats; 55 seats directly elected and 15 appointed by the president) and the House of People's Representatives or Camara de los Diputdos or Chamber of Deputies (100 seats; members directly elected by popular vote to serve five-year terms)
Convergence Party for Social Democracy or CPDS [Andres Esono ONDO]//Democratic Party for Equatorial Guinea or PDGE [Jeronimo Osa Osa ECORO] (ruling party)//Electoral Coalition or EC//Party for Progress of Equatorial Guinea or PPGE [Severo MOTO]//Popular Action of Equatorial Guinea or APGE [Carmelo Mba BACALE]//Popular Union or UP [Daniel MARTINEZ Ayecaba]
ASODEGUE (Madrid-based pressure group for democratic reform)//EG Justice (US-based anti-corruption group)
Justice System & Fundamental RightsBack to top ↑
- Judicial Independence & Court Capability
- Access to Justice & Legal Services
- Fundamental Rights Protection
- Human Rights Institutions & Equality Bodies
mixed system of civil and customary law
has not submitted an ICJ jurisdiction declaration; non-party state to the ICCt
Internal Security & OrderBack to top ↑
Regulatory Governance & Strategic ControlsBack to top ↑
- Regulatory Quality & Better Regulation
- Regulatory Delivery & Independent Regulators
- Strategic Controls & Economic Security Administration
Government Effectiveness & Public AdministrationBack to top ↑
- Centre of Government & Policy Coordination
- Civil Service & Public Workforce
- Digital Government & Service Delivery
- Legal Identity & Civil Registration
- Statistical & Data Capability
Public Integrity & Anti-CorruptionBack to top ↑
Transparency, Oversight & AccountabilityBack to top ↑
- Right to Information & Open Government
- Independent Oversight & Supreme Audit
- Independent Media & Journalist Safety
National Resilience & Crisis ManagementBack to top ↑
GINC Capability Domains · Chapter 09
Information and Influence
🇬🇶 Equatorial Guinea’s identity, media and the projection of influence
Identity and cultureBack to top ↑
Spanish (official) 67.6%, other (includes French (official), Fang, Bubi) 32.4% (1994 census)
nominally Christian and predominantly Roman Catholic, pagan practices
Fang 85.7%, Bubi 6.5%, Mdowe 3.6%, Annobon 1.6%, Bujeba 1.1%, other 1.4% (1994 census)
silk cotton tree
three equal horizontal bands of green (top), white, and red, with a blue isosceles triangle based on the hoist side and the coat of arms centered in the white band; the coat of arms has six yellow six-pointed stars (representing the mainland and five offshore islands) above a gray shield bearing a silk-cotton tree and below which is a scroll with the motto UNIDAD, PAZ, JUSTICIA (Unity, Peace, Justice); green symbolizes the jungle and natural resources, blue represents the sea that connects the mainland to the islands, white stands for peace, and red recalls the fight for independence
Diplomatic Statecraft & Global NetworksBack to top ↑
- Diplomatic Network & Consular Reach
- Multilateral Leadership & Norm Setting
- Agenda-Setting & Convening
- Mediation & Crisis Diplomacy
ACP, AfDB, AU, BDEAC, CEMAC, CPLP (associate), FAO, FZ, G-77, IBRD, ICAO, ICRM, IDA, IFAD, IFC, IFRCS, ILO, IMF, IMO, Interpol, IOC, IPU, ITSO, ITU, MIGA, NAM, OAS (observer), OIF, OPCW, UN, UNCTAD, UNESCO, UNIDO, UNWTO, UPU, WHO, WIPO, WTO (observer)
Alliances & Security CooperationBack to top ↑
Development Cooperation & Global AssistanceBack to top ↑
Culture, Language & Education DiplomacyBack to top ↑
- Cultural & Language Institutes
- Creative Industries & Cultural Export Reach
- Heritage & Cultural Institutions
- Education Diplomacy & Alumni Networks
- Sports & Major Events
Diaspora & Global CommunitiesBack to top ↑
Information Environment & Strategic CommunicationBack to top ↑
- Strategic Communications & Public Diplomacy
- International Media & Broadcasting
- Information Defence & Counter-Interference
state maintains control of broadcast media with domestic broadcast media limited to 1 state-owned TV station, 1 private TV station owned by the president's eldest son, 1 state-owned radio station, and 1 private radio station owned by the president's eldest son; satellite TV service is available; transmissions of multiple international broadcasters are accessible (2013)
GINC Capability Domains · Chapter 10
Financial Strength
🇬🇶 Equatorial Guinea’s fiscal depth, reserves and the capacity to act
Monetary & Currency CapabilityBack to top ↑
- Monetary Policy & Price Stability
- Exchange Rate & External Account Management
- Currency Issuance & Digital Money
6% (2013 est.)//6.1% (2012 est.)
Cooperation Financiere en Afrique Centrale francs (XAF) per US dollar -//500.7 (2013 est.)//510.53 (2012 est.)//495.28 (2010 est.)//472.19 (2009)//447.81 (2008)
8.5% (31 December 2010 est.)//4.25% (31 December 2009 est.)
15% (31 December 2013 est.)//15% (31 December 2012 est.)
$3.001 billion (31 December 2013 est.)//$3.023 billion (31 December 2012 est.)
$3.382 billion (31 December 2013 est.)//$3.438 billion (31 December 2012 est.)
Fiscal Capacity & Public FinanceBack to top ↑
- Revenue Mobilisation & Tax Administration
- Public Expenditure & Budget Management
- Sovereign Debt & Treasury Management
- Public Investment Management
40% of GDP (2013 est.)
0.2% of GDP (2013 est.)
11% of GDP (2013 est.)//9.3% of GDP (2012 est.)
calendar year
Financial System Depth & AccessBack to top ↑
- Banking System Capacity
- Capital Markets Depth & Development
- Long-Term & Institutional Capital
- Financial Inclusion & Household Access
- Development & Policy Finance
$-424.6 million (31 December 2013 est.)//$-631.4 million (31 December 2012 est.)
22.6% of GDP (2013 est.)//26.4% of GDP (2012 est.)//32% of GDP (2011 est.)
Financial Regulation & IntegrityBack to top ↑
- Prudential Regulation & Supervision
- Financial Integrity & Illicit Finance Control
- Market Conduct & Consumer Protection
- Payment & Market Infrastructure Oversight
Financial Stability & Crisis ManagementBack to top ↑
- Macroprudential & Systemic Oversight
- Crisis Management, Resolution & Deposit Insurance
- External Liquidity & Financial Safety Nets
Sovereign Capital & External Financial PowerBack to top ↑
- Official Reserves Management
- Sovereign Wealth & Public Asset Management
- Currency Internationalisation & Reserve Status
- Capital Account & Flow Management
- International Financial Centre Capability
$4.027 billion (31 December 2013 est.)//$4.397 billion (31 December 2012 est.)
$2.104 billion (31 December 2013 est.)//$1.858 billion (31 December 2012 est.)
GINC Capability Domains · Chapter 11
Production and Innovation
🇬🇶 Equatorial Guinea’s output, industry and the engine of prosperity
Economic Output & ProductivityBack to top ↑
The discovery and exploitation of large oil and gas reserves have contributed to dramatic economic growth, but fluctuating oil prices along with slowing or declining oil production have resulted in much lower GDP growth in recent years. The economy is still dominated by hydrocarbon production. The government has solicited foreign investment, particularly from the United States, to diversify the economy and in February 2014 the government hosted an economic diversification symposium focused on attracting investment in five sectors: agriculture and animal ranching, fishing, mining and petrochemicals, tourism, and financial services. Undeveloped mineral resources include gold, zinc, diamonds, columbite-tantalite, and other base metals. Forestry and farming are also minor components of GDP. Subsistence farming is the dominant form of livelihood. Although pre-independence Equatorial Guinea counted on cocoa production for hard currency earnings, the neglect of the rural economy under successive regimes has diminished potential for agriculture-led growth. The government has stated its intention to reinvest some oil revenue into agriculture. A number of aid programs sponsored by the World Bank and the IMF have been cut off since 1993 because of corruption and mismanagement. The government has been widely criticized for its lack of transparency and misuse of oil revenues and has attempted to address this issue by working towards compliance with the Extractive Industries Transparency Initiative.
$19.68 billion (2013 est.)//$19.97 billion (2012 est.)//$18.96 billion (2011 est.)
-1.5% (2013 est.)//5.3% (2012 est.)//4.6% (2011 est.)
$25,700 (2013 est.)//$26,900 (2012 est.)//$26,200 (2011 est.)
$17.08 billion (2013 est.)
Labour & EmploymentBack to top ↑
- Employment & Labour Force Participation
- Labour Market Institutions & Wage Setting
- Employment Services & Skills Matching
- Labour Adjustment, Transition & Formalisation
195,200 (2007)
22.3% (2009 est.)
Industrial & Sectoral BaseBack to top ↑
- Manufacturing & Advanced Industry
- Foundational & Process Industries
- Agrifood & Primary Production
- Services Economy
coffee, cocoa, rice, yams, cassava (manioc, tapioca), bananas, palm oil nuts; livestock; timber
petroleum, natural gas, sawmilling
3.2% (2013 est.)
Structural Transformation & ComplexityBack to top ↑
Business Dynamism & EntrepreneurshipBack to top ↑
- Entrepreneurship & Firm Creation
- Risk Capital & Scale-Up Finance
- Firm Growth, Exit & Renewal
- Competition & Market Contestability
Innovation & CommercialisationBack to top ↑
- Business Innovation Capability
- Research Commercialisation & Knowledge Transfer
- Intellectual Property & Intangible Assets
- Innovation Ecosystems & Clusters
Technology Adoption & DiffusionBack to top ↑
GINC Capability Domains · Chapter 12
Trade and Investment
🇬🇶 Equatorial Guinea’s markets, capital and the terms of global exchange
Overall tradeBack to top ↑
$4.47B of exports to 62 partners and $1.02B of imports from 83 in 2024, a surplus of $3.46B.
- Exports
- $4.47B62 partners
- Imports
- $1.02B83 partners
- Balance
- +$3.46Bsurplus
- Total trade
- $5.49B2024
ExportsBack to top ↑
Where its exports go
The largest partners in 2024, with each one's share of the nation's exports.
| Partner | Value | Share | |
|---|---|---|---|
| China | $986M | 22% | |
| Spain | $692M | 15% | |
| India | $584M | 13% | |
| Italy | $297M | 6.7% | |
| Japan | $199M | 4.5% | |
| Thailand | $197M | 4.4% | |
| South Korea | $189M | 4.2% | |
| Indonesia | $172M | 3.8% | |
| Germany | $144M | 3.2% | |
| France | $143M | 3.2% | |
| Taiwan | $140M | 3.1% | |
| United States | $133M | 3.0% | |
| United Kingdom | $128M | 2.9% | |
| Philippines | $128M | 2.9% | |
| Netherlands | $122M | 2.7% | |
| Nigeria | $88.4M | 2.0% | |
| Brazil | $39.8M | 0.9% | |
| Canada | $13.6M | 0.3% | |
| El Salvador | $13.4M | 0.3% | |
| Chile | $11.6M | 0.3% |
What it exports
The largest categories in 2024.
| Category | Value | Share | |
|---|---|---|---|
| Mineral fuels, oils, distillation products | $4.16B | 93% | |
| Organic chemicals | $225M | 5.0% | |
| Wood and articles of wood, wood charcoal | $57.6M | 1.3% | |
| Iron and steel | $15.5M | 0.3% | |
| Aluminum | $3.85M | <0.1% | |
| Copper | $2.11M | <0.1% | |
| Cocoa and cocoa preparations | $2.07M | <0.1% | |
| Salt, sulphur, earth, stone, plaster, lime and cement | $1.39M | <0.1% | |
| Machinery, nuclear reactors, boilers | $1.02M | <0.1% | |
| Miscellaneous chemical products | $623K | <0.1% | |
| Lead | $328K | <0.1% | |
| Articles of iron or steel | $166K | <0.1% | |
| Vehicles other than railway, tramway | $155K | <0.1% | |
| Paper and paperboard, articles of pulp, paper and board | $138K | <0.1% | |
| Essential oils, perfumes, cosmetics, toiletries | $114K | <0.1% |
ImportsBack to top ↑
Where its imports come from
The largest partners in 2024, with each one's share of the nation's imports.
| Partner | Value | Share | |
|---|---|---|---|
| China | $170M | 17% | |
| Spain | $156M | 15% | |
| United States | $93.5M | 9.2% | |
| Angola | $92.4M | 9.1% | |
| United Kingdom | $58.7M | 5.8% | |
| Nigeria | $51.8M | 5.1% | |
| Turkey | $38.1M | 3.7% | |
| Brazil | $30.3M | 3.0% | |
| Netherlands | $30.1M | 3.0% | |
| India | $26.9M | 2.6% | |
| Italy | $25.1M | 2.5% | |
| Denmark | $23.4M | 2.3% | |
| France | $22.7M | 2.2% | |
| Germany | $22.3M | 2.2% | |
| Indonesia | $16.4M | 1.6% | |
| Poland | $15.5M | 1.5% | |
| Belgium | $15.1M | 1.5% | |
| Ivory Coast | $12.5M | 1.2% | |
| Morocco | $11.3M | 1.1% | |
| Malaysia | $10.7M | 1.1% |
What it imports
The largest categories in 2024.
| Category | Value | Share | |
|---|---|---|---|
| Ships, boats, and other floating structures | $144M | 14% | |
| Machinery, nuclear reactors, boilers | $139M | 14% | |
| Electrical, electronic equipment | $77.8M | 7.7% | |
| Beverages, spirits and vinegar | $68.4M | 6.7% | |
| Meat and edible meat offal | $56.8M | 5.6% | |
| Articles of iron or steel | $49.3M | 4.9% | |
| Plastics | $37.6M | 3.7% | |
| Vehicles other than railway, tramway | $35.3M | 3.5% | |
| Furniture, lighting signs, prefabricated buildings | $27.7M | 2.7% | |
| Miscellaneous articles of base metal | $27.3M | 2.7% | |
| Optical, photo, technical, medical apparatus | $18.7M | 1.8% | |
| Cereal, flour, starch, milk preparations and products | $18.6M | 1.8% | |
| Ceramic products | $17.3M | 1.7% | |
| Mineral fuels, oils, distillation products | $15.2M | 1.5% | |
| Animal, vegetable fats and oils, cleavage products | $14.1M | 1.4% |
In a list, the bar runs to the largest in that list. The line is each figure’s history from 2000, drawn to its own peak: it shows the shape of the years, and the value shows the size.
External balanceBack to top ↑
-$2.916 billion (2013 est.)//-$2.945 billion (2012 est.)
Trade Facilitation & LogisticsBack to top ↑
Trade Policy & Market AccessBack to top ↑
- Trade Policy & Negotiation Capability
- Market Access & Agreements Network
- Trade Law & Enforcement
- Standards, Conformity & Quality Infrastructure
Digital & Services TradeBack to top ↑
- Services Trade Capability
- Digital Trade & E-Commerce
- Data Flows & Digital Trade Governance
- Tourism & Visitor Economy
Investment Attraction & ProjectionBack to top ↑
- Investment Attraction & Facilitation
- Investment Absorption & Linkages
- Outward Investment & Global Corporate Presence
Export Capability & SophisticationBack to top ↑
$15.44 billion (2013 est.)//$14.86 billion (2012 est.)
Japan 18.8%, France 16.1%, China 11.7%, US 11.3%, Netherlands 7.2%, Spain 7.1%, Italy 5.1% (2012)
petroleum products, timber
Global Value Chain PositionBack to top ↑
- Value Chain Participation & Integration
- Value Chain Position & Upgrading
- Regional Integration & Hub Anchoring
Economic Leverage & DependenceBack to top ↑
- Strategic Supply Security
- Concentration Risk & Revenue Stabilisation
- Economic Leverage & Coercion Resistance
$7.943 billion (2013 est.)//$8.045 billion (2012 est.)
Spain 18.4%, China 17.4%, US 11.1%, France 8%, Italy 5.9%, Cote dIvoire 5.3%, Brazil 4.4% (2012)
petroleum sector equipment, other equipment, construction materials, vehicles
Equatorial Guinea · you are in
Historical Context
Foundations
GINC Capability Domains
Find in this brief · Equatorial Guinea